Financial Management Assignment: Analysis of WACC, NPV, and Investment

Verified

Added on  2022/08/13

|11
|1750
|133
Homework Assignment
AI Summary
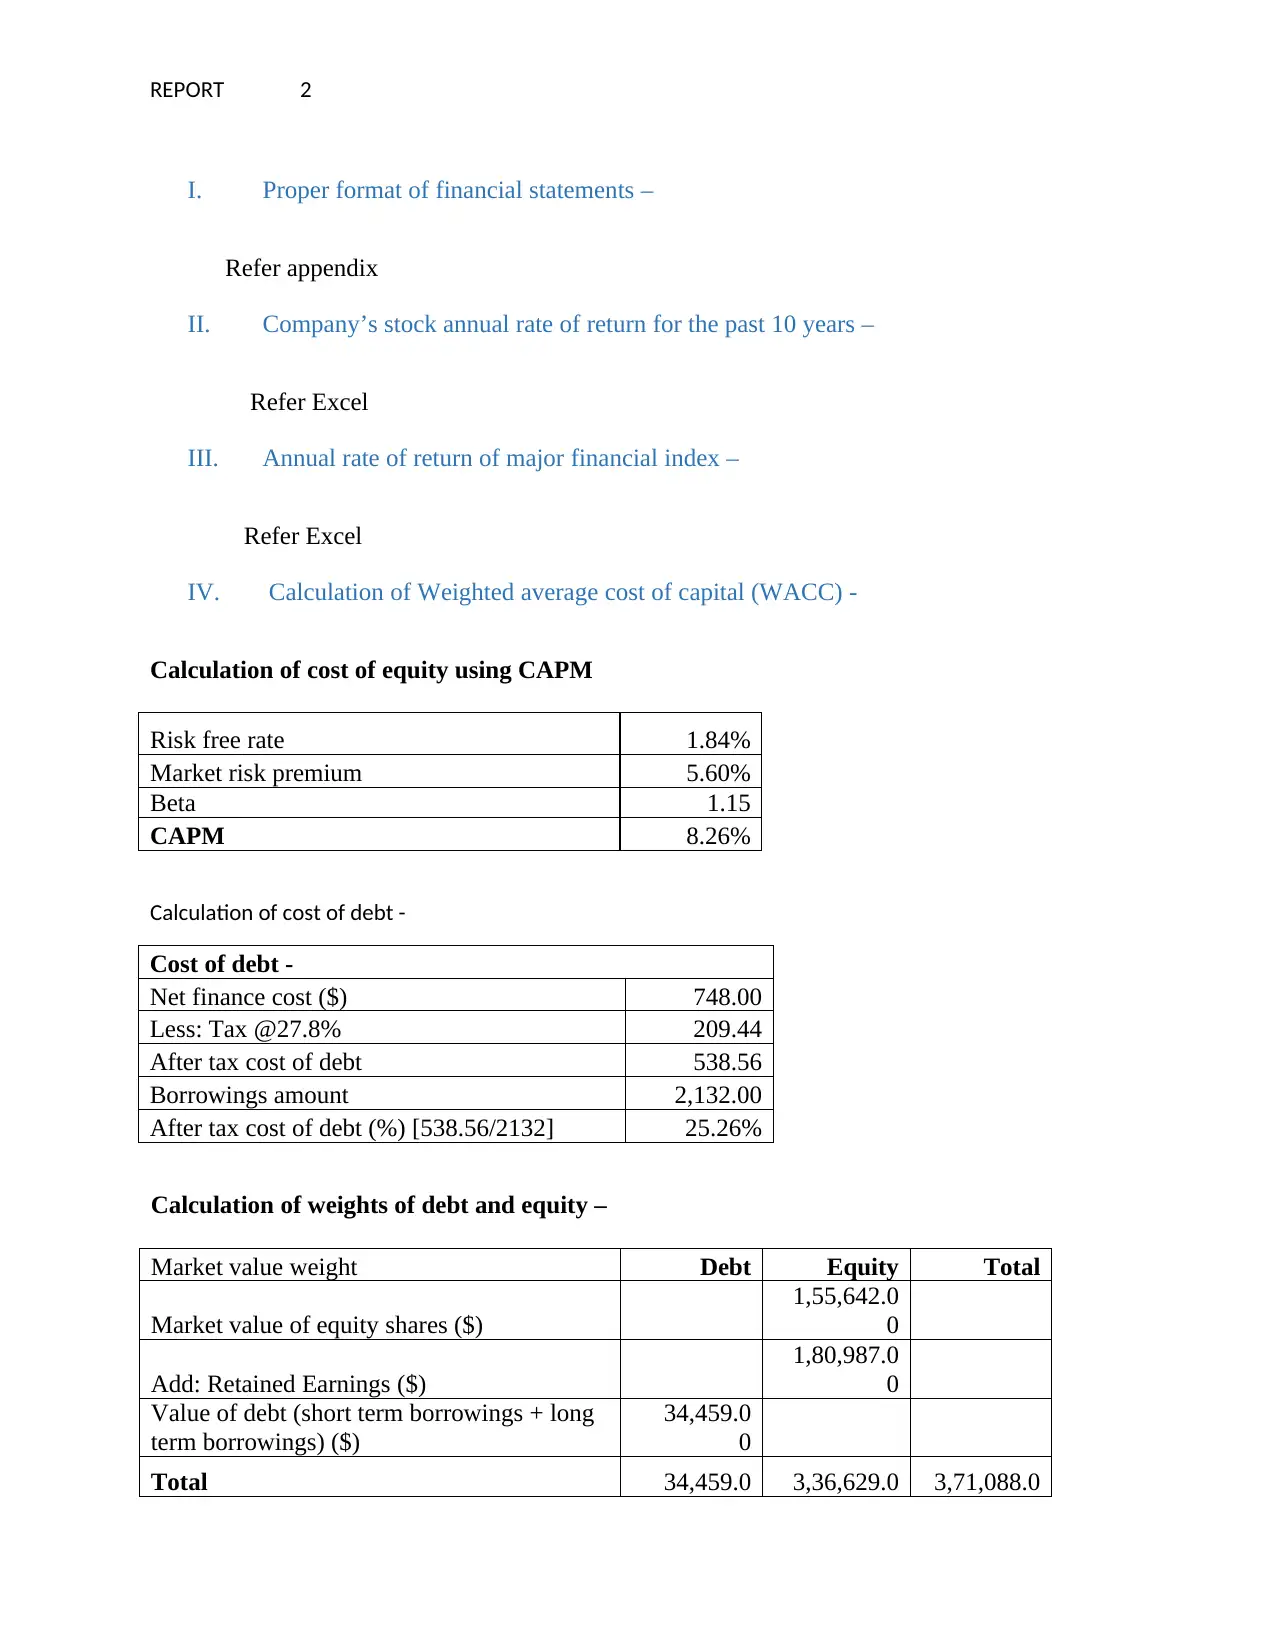
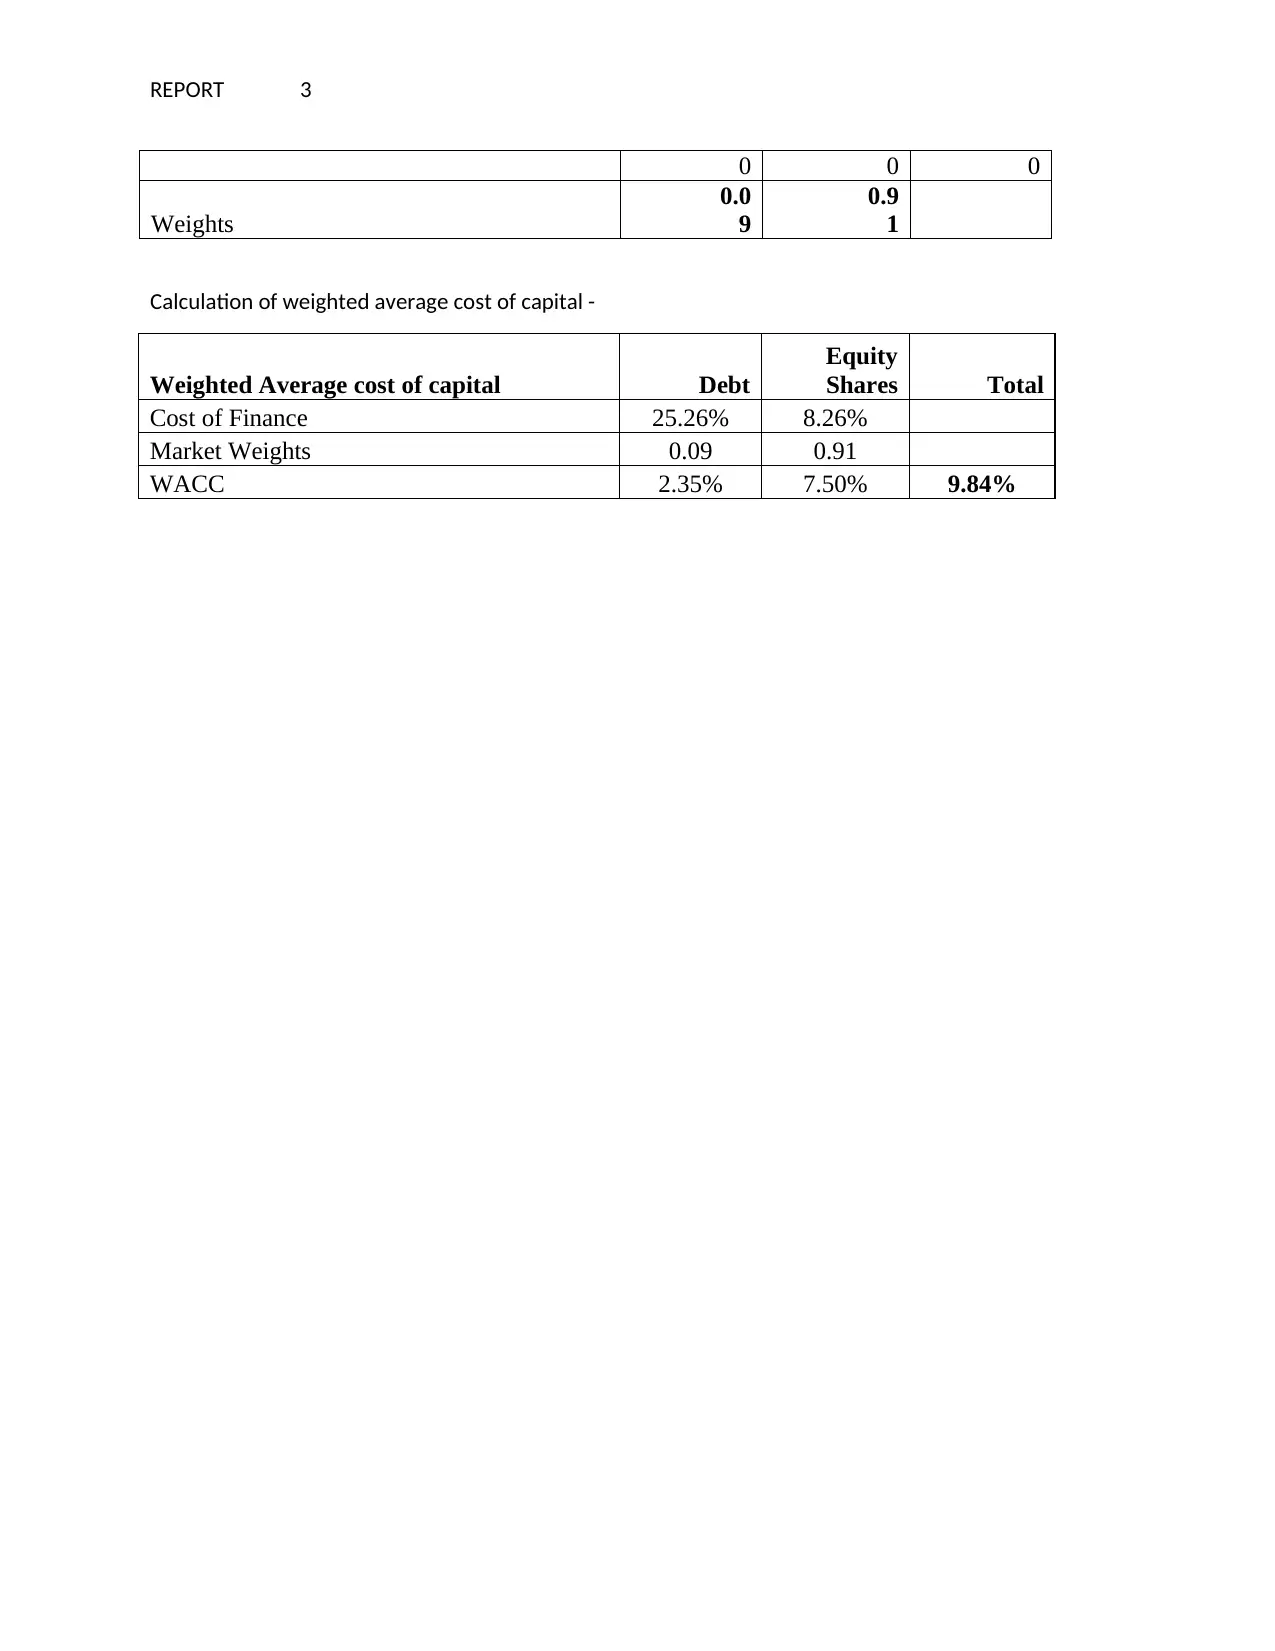
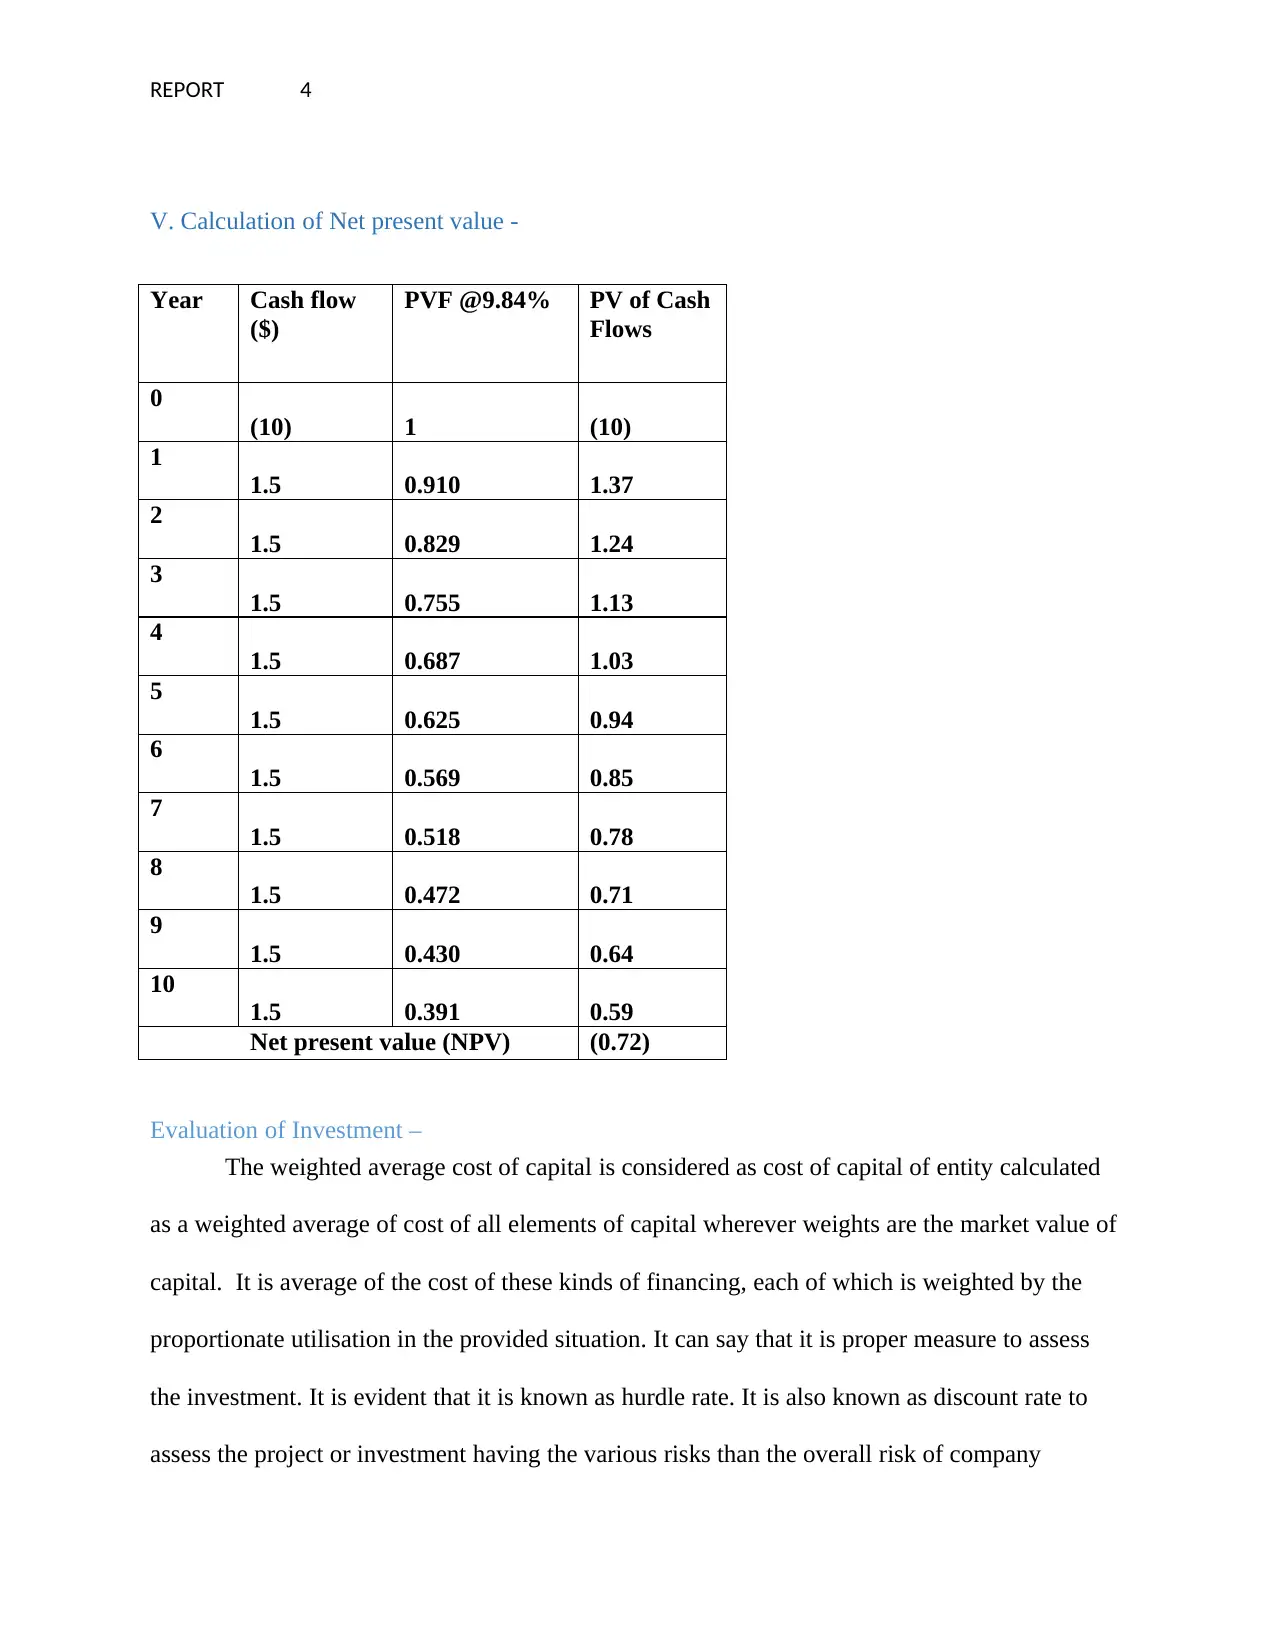
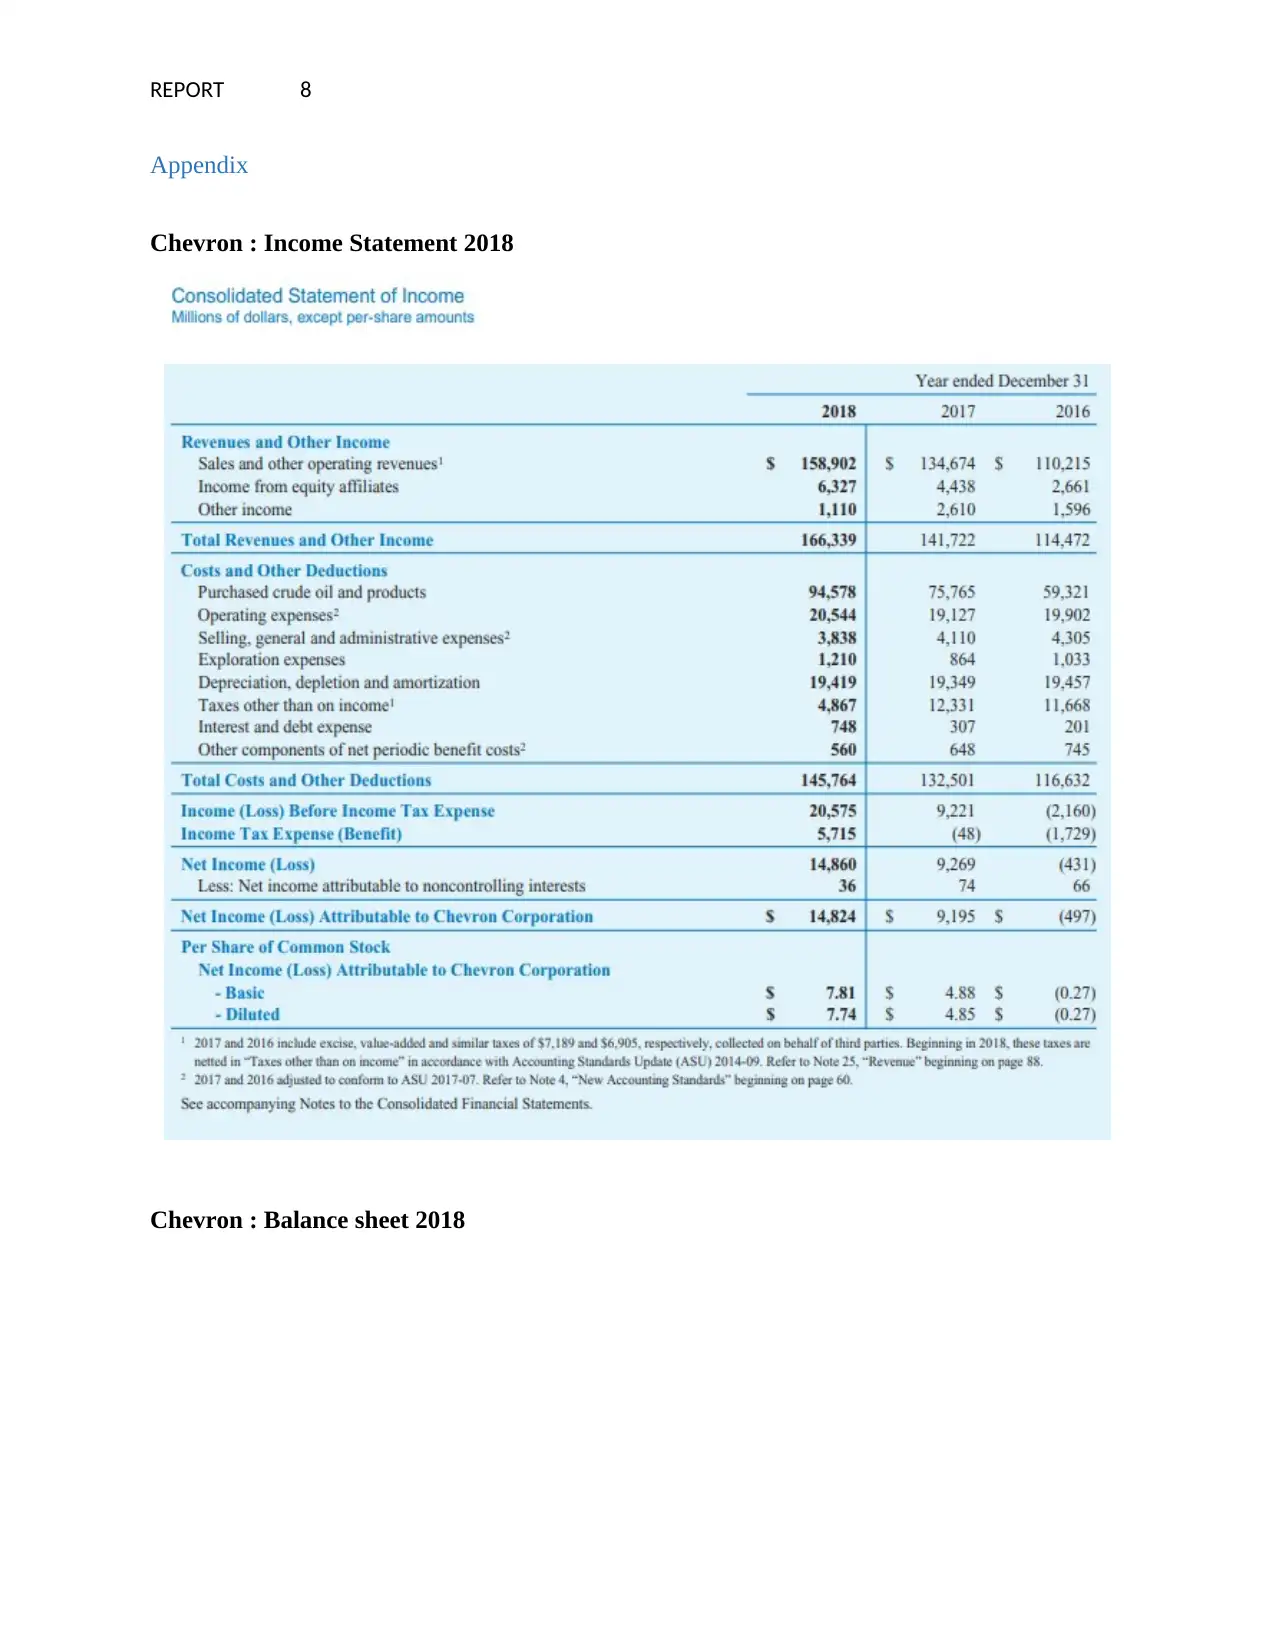
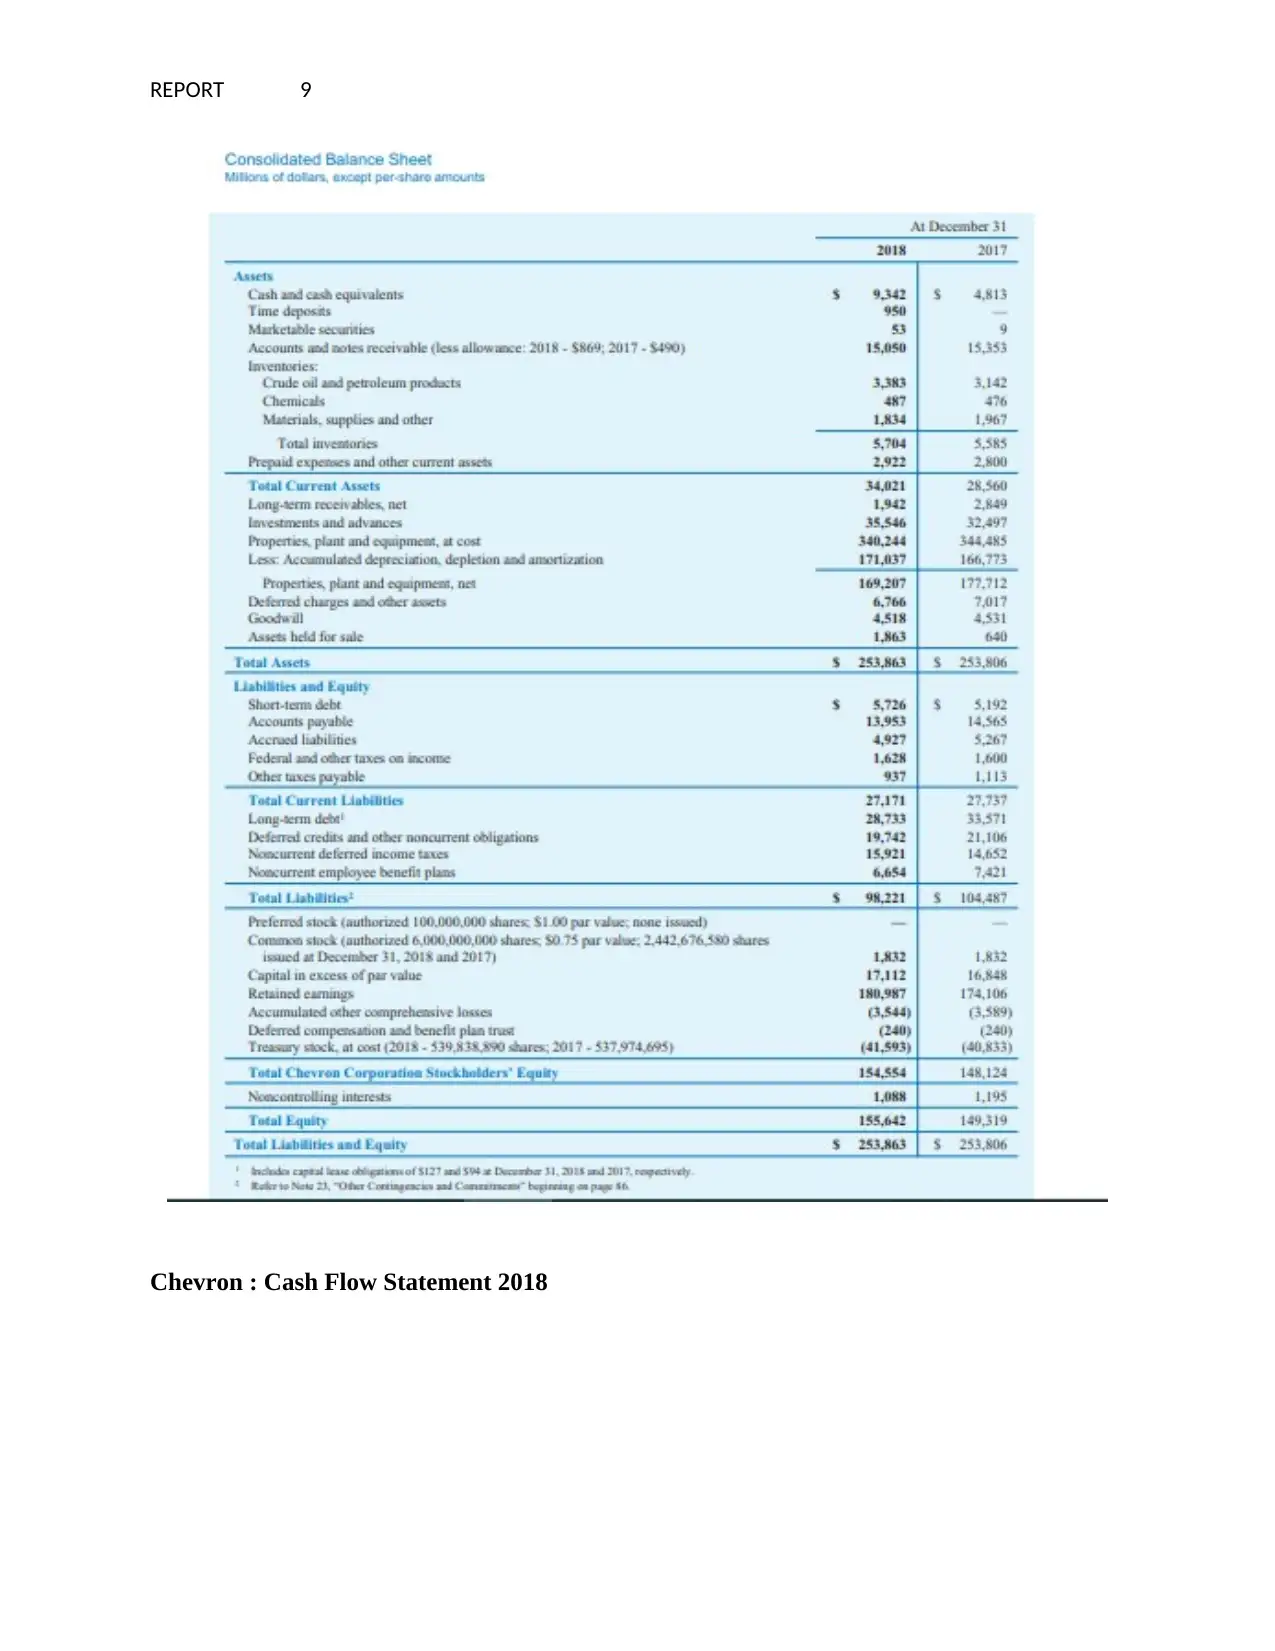
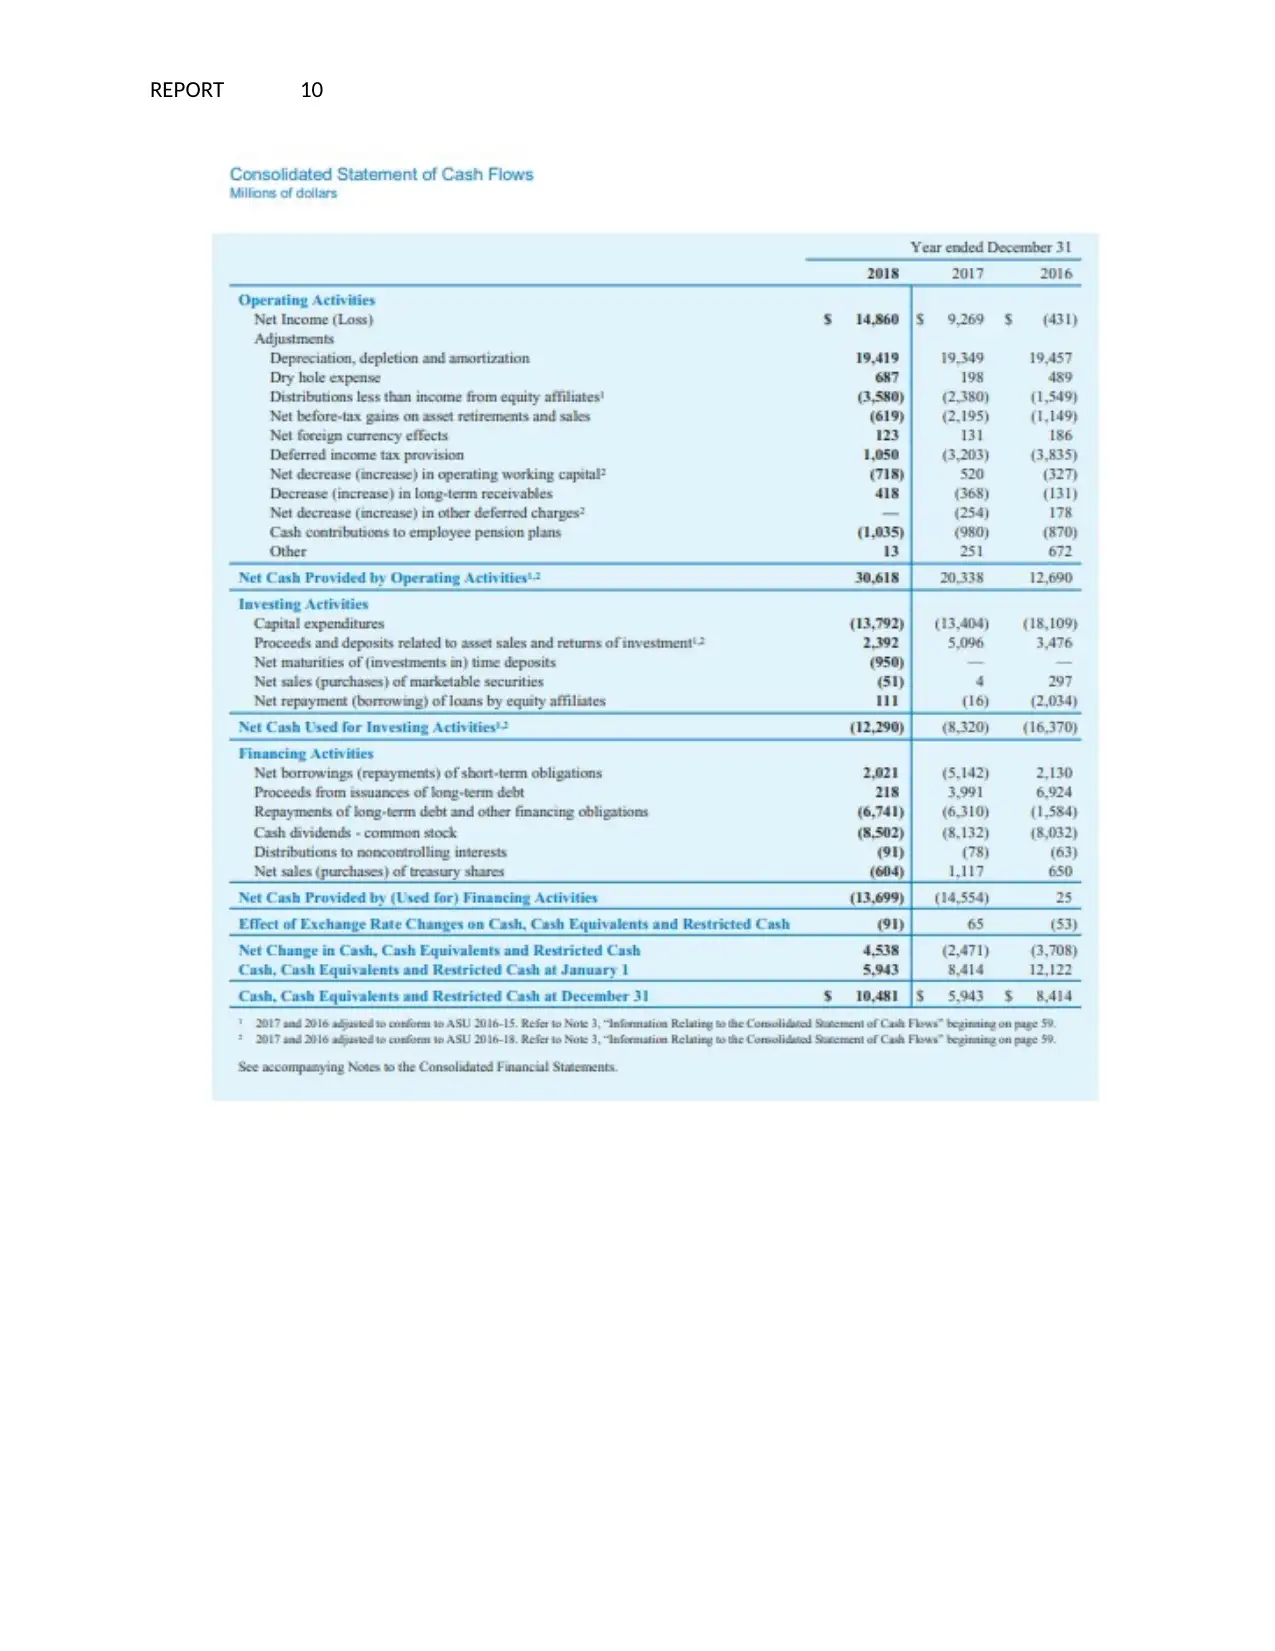
This financial management assignment analyzes Chevron Corporation's financial data, including income statements, balance sheets, and cash flow statements. The assignment calculates the company's weighted average cost of capital (WACC) using the Capital Asset Pricing Model (CAPM) for cost of equity and after-tax cost of debt, incorporating market value weights. It also calculates the net present value (NPV) of an investment, determining its viability based on the WACC as the discount rate. The analysis evaluates the investment's financial feasibility, concluding that the project has a negative NPV, suggesting it is not a viable investment. The assignment references several financial research papers and includes financial statements from Chevron Corporation in the appendix.
tabler-icon-diamond-filled.svg

Contribute Materials

Your contribution can guide someone’s learning journey. Share your documents today.
Document Page
Running head: REPORT 0
FINANCIAL MANAGEMENT
FEBRUARY 14, 2020
STUDENT DETAILS:
tabler-icon-diamond-filled.svg

Secure Best Marks with AI Grader

Need help grading? Try our AI Grader for instant feedback on your assignments.
Document Page
REPORT 1
Contents
I. Proper format of financial statements –...................................................................................2
II. Company’s stock annual rate of return for the past 10 years –................................................2
III. Annual rate of return of major financial index –..................................................................2
IV. Calculation of Weighted average cost of capital (WACC) -................................................2
V. Calculation of Net present value -..............................................................................................4
Evaluation of Investment –..........................................................................................................4
References........................................................................................................................................7
Appendix..........................................................................................................................................8
Document Page
REPORT 2
I. Proper format of financial statements –
Refer appendix
II. Company’s stock annual rate of return for the past 10 years –
Refer Excel
III. Annual rate of return of major financial index –
Refer Excel
IV. Calculation of Weighted average cost of capital (WACC) -
Calculation of cost of equity using CAPM
Risk free rate 1.84%
Market risk premium 5.60%
Beta 1.15
CAPM 8.26%
Calculation of cost of debt -
Cost of debt -
Net finance cost ($) 748.00
Less: Tax @27.8% 209.44
After tax cost of debt 538.56
Borrowings amount 2,132.00
After tax cost of debt (%) [538.56/2132] 25.26%
Calculation of weights of debt and equity –
Market value weight Debt Equity Total
Market value of equity shares ($)
1,55,642.0
0
Add: Retained Earnings ($)
1,80,987.0
0
Value of debt (short term borrowings + long
term borrowings) ($)
34,459.0
0
Total 34,459.0 3,36,629.0 3,71,088.0
Document Page
REPORT 3
0 0 0
Weights
0.0
9
0.9
1
Calculation of weighted average cost of capital -
Weighted Average cost of capital Debt
Equity
Shares Total
Cost of Finance 25.26% 8.26%
Market Weights 0.09 0.91
WACC 2.35% 7.50% 9.84%
tabler-icon-diamond-filled.svg

Secure Best Marks with AI Grader

Need help grading? Try our AI Grader for instant feedback on your assignments.
Document Page
REPORT 4
V. Calculation of Net present value -
Year Cash flow
($)
PVF @9.84% PV of Cash
Flows
0
(10) 1 (10)
1
1.5 0.910 1.37
2
1.5 0.829 1.24
3
1.5 0.755 1.13
4
1.5 0.687 1.03
5
1.5 0.625 0.94
6
1.5 0.569 0.85
7
1.5 0.518 0.78
8
1.5 0.472 0.71
9
1.5 0.430 0.64
10
1.5 0.391 0.59
Net present value (NPV) (0.72)
Evaluation of Investment –
The weighted average cost of capital is considered as cost of capital of entity calculated
as a weighted average of cost of all elements of capital wherever weights are the market value of
capital. It is average of the cost of these kinds of financing, each of which is weighted by the
proportionate utilisation in the provided situation. It can say that it is proper measure to assess
the investment. It is evident that it is known as hurdle rate. It is also known as discount rate to
assess the project or investment having the various risks than the overall risk of company
Document Page
REPORT 5
(Gehringer & Mayer, 2017). In this way, this is a discount rate arrived after creating adjustment
to weighted average cost of capital regarding changes in a risk profile of the entity, as well as
particular project or investment. It can be regarded as benchmark rate to assess new investments.
Therefore, the relevance as well as significance of the weighted average cost of capital as the
financial method for both entity and investor are well acknowledged amongst financial analysts
(Lakshmi, Khan & Vortelinos, 2017).This is significant for entity to take decision related
to investment. It is also helpful to evaluate project with same or different risk. The calculation of
significant metrics such as NPV needs the weighted average cost of capital. This is similarly
significant for investor making valuation of entities. Henceforth, this evaluation has two angles,
such as the company as well as investor. From an angle of entity, the WACC can be described as
blended cost of capital that an entity should pay to utilise the capital of both debt holder along
with owner. In different terms, WACC is a minimum rate of return the entity must have to make
values for the investor. From a point of view of investor, this is an opportunity cost of the capital.
It is a best measure to evaluate investment proposal. When the return offered by entity is less
than weighted average cost of capital, this is destroying value. Therefore, the investor can
discontinue the investment in entity (Simon, 2015).
In addition, the net present value is a best method to evaluate investment to take decision in
relation to the profitability of investment. The weighted average cost of capital is utilised as
hurdle rate (discount rate) for the calculation of the net present value. It can evident that terminal
value as well as free cash flow are discounted utilising the weighted average cost of capital
(Schmitt & Neu, 2017). Chevron Corporation is making positive cash flow. In this way, this is
great and positive situation for an organisation to be agreed to take the project. In finance, the net
present value or NPV is applicable to the series of cash flow taking place at different time. The
Document Page
REPORT 6
present value of a cash flow is depended on the interval of period between current cash flow and
future cash flow. It is depended on the discount rate. The net present value accounts for the
TVM. Moreover, NPV is regarded as a difference between the present value of cash outflows
and present value of cash inflow, which takes place as an outcome to undertake investment
(Fernanda, 2019). It is evident that NPV can be negative NPV, positive NPV or zero NPV. The
assumptions for net presnet value are discussed below –
PV of cash inflow < PV of cash outflows, then net present value would be negative net
present value
PV of cash inflow > PV of cash outflows, in that situation the net present value will be
positive net present value
PV of cash outflow = PV of cash inflows, then the NPV would be zero (Santandrea, et.a
l, 2017).
In this way, while present value of cash outflow is less than PV of cash inflow, the net
present value would be positive. This investment will be acceptable for entity. Furthermore,
while present value of cash outflow is equal to present value of cash inflow, then net present
value would be zero (Shu, et. al, 2016). Therefore, the investment having zero net present value
can be accepted by entity. Besides, if the present value of cash outflow is more than the present
value of cash outflow, then net present value will be negative. In this situation, then company
should not go for this investment (Lewellen & Lewellen, 2016). From the above calculation, it is
found that the net present value (NPV) of the investment is – $ 0.72. The net present value of
project is negative. In this way, it can say that the investment is not viable (Annual Report,
2018).
tabler-icon-diamond-filled.svg

Paraphrase This Document

Need a fresh take? Get an instant paraphrase of this document with our AI Paraphraser
Document Page
REPORT 7
References
Annual Report (2018). Chevron Corporation. Retrieved from:
https://www.chevron.com/-/media/chevron/annual-report/2018/documents/2018-Annual-
Report.pdf
Fernandez, P. (2019). WACC and CAPM according to Utilities Regulators: Confusions, Errors
and Inconsistencies. Errors and Inconsistencies (February 1, 2019).
Gehringer, A., & Mayer, T. (2017). It’s the WACC, stupid!. management, 29, 3.
Lakshmi, G., Khan, M., & Vortelinos, D. (2017). Cost of capital of stakeholders’ WACC. USA:
Springer
Lewellen, J., & Lewellen, K. (2016). Investment and cash flow: New evidence. Journal of
Financial and Quantitative Analysis, 51(4), 1135-1164.
Santandrea, M., Sironi, A., Grassi, L., & Giorgino, M. (2017). Concentration risk and internal
rate of return: Evidence from the infrastructure equity market. International
Journal of Project Management, 35(3), 241-251.
Schmitt, S., & Neu, W. (2017). The beta in the WACC for regulated fixed and mobile
telecommunica-tions services: Its role and robust estimation. USA: Springer
Shu, S. B., Zeithammer, R., & Payne, J. W. (2016). Consumer preferences for annuity attributes:
Beyond net present value. Journal of Marketing Research, 53(2), 240-262.
Simon, R. (2015). Sensitivity, specificity, PPV, and NPV for predictive biomarkers. JNCI:
Journal of the National Cancer Institute, 107(8)
Document Page
REPORT 8
Appendix
Chevron : Income Statement 2018
Chevron : Balance sheet 2018
Document Page
REPORT 9
Chevron : Cash Flow Statement 2018
tabler-icon-diamond-filled.svg

Secure Best Marks with AI Grader

Need help grading? Try our AI Grader for instant feedback on your assignments.
Document Page
REPORT 10
chevron_up_icon
1 out of 11
circle_padding
hide_on_mobile
zoom_out_icon
logo.png

Your All-in-One AI-Powered Toolkit for Academic Success.

Available 24*7 on WhatsApp / Email

[object Object]