Finance Report: Market Trends, Stock Analysis, and Company Details
VerifiedAdded on 2021/06/18
|8
|1082
|96
Report
AI Summary
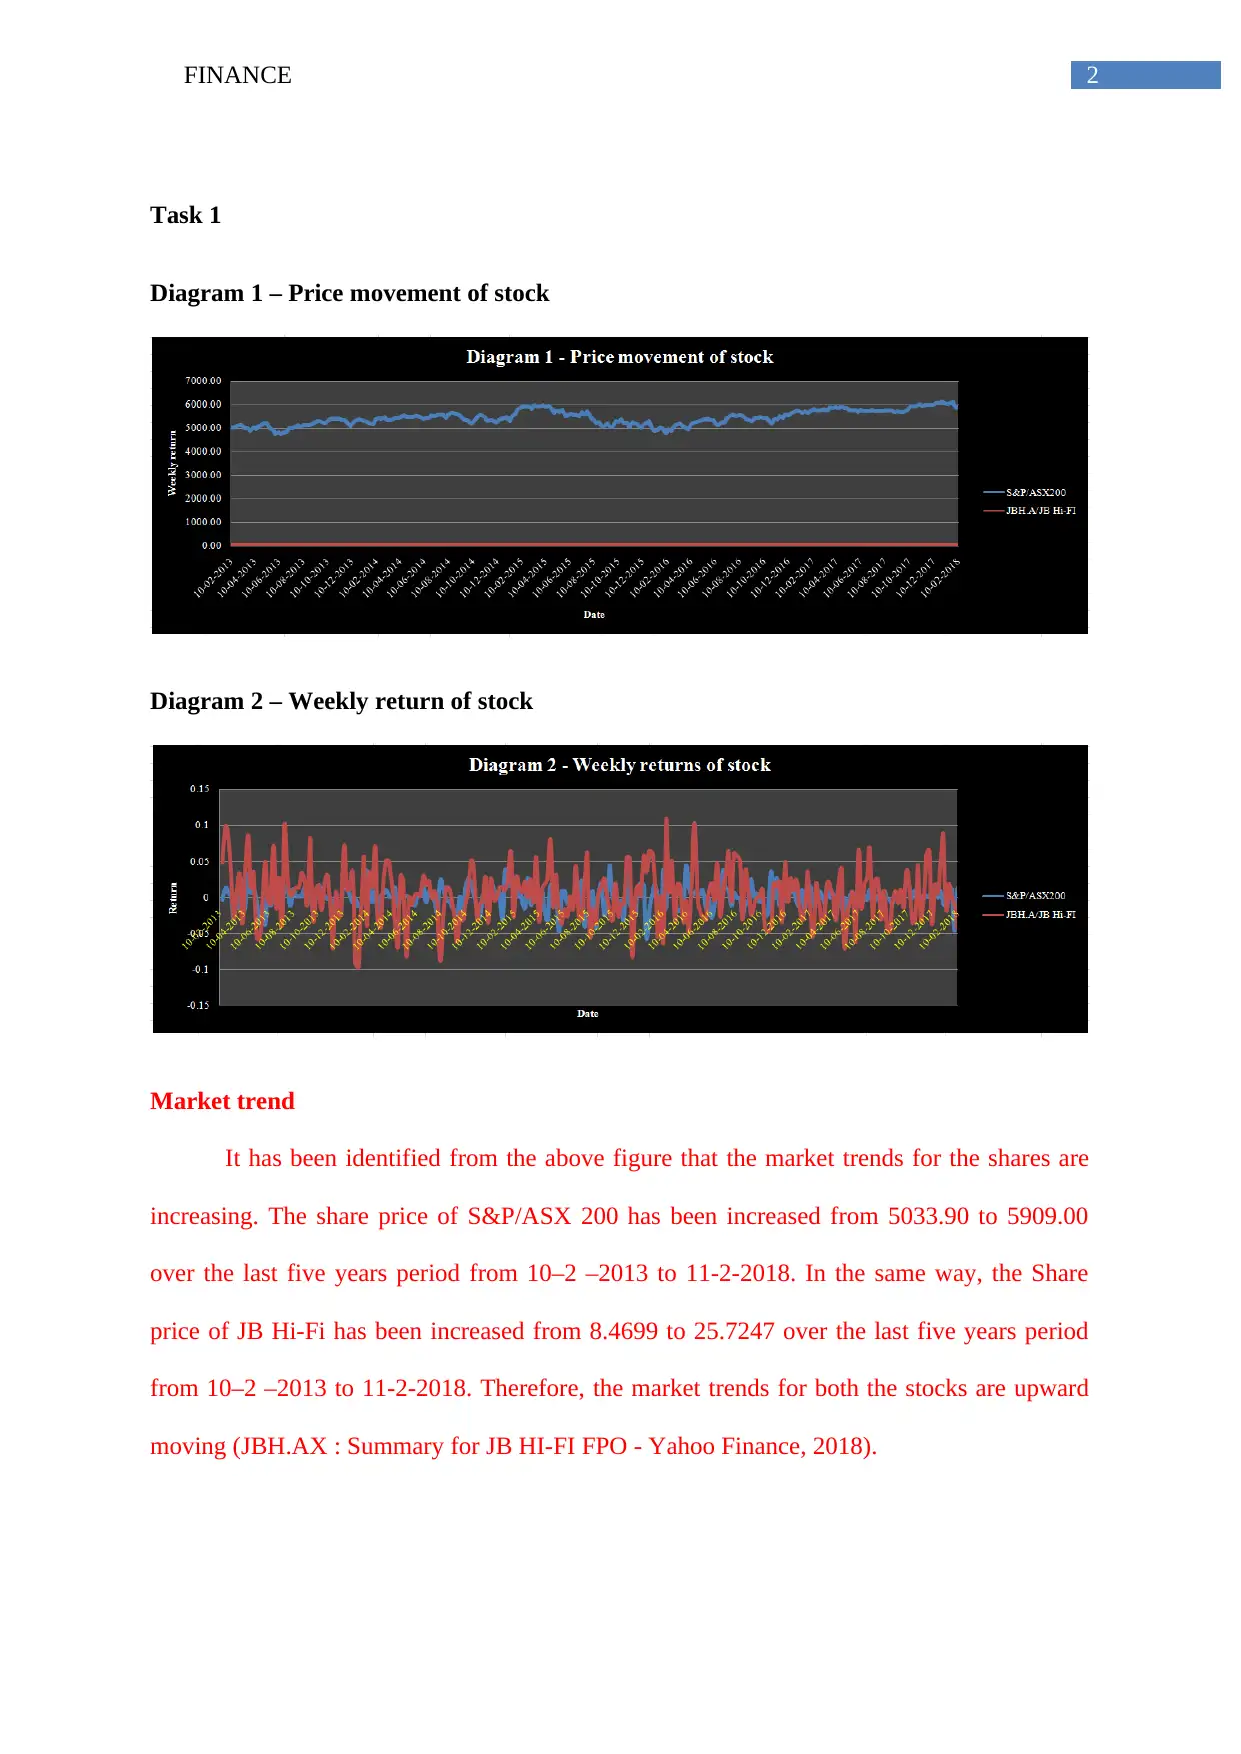
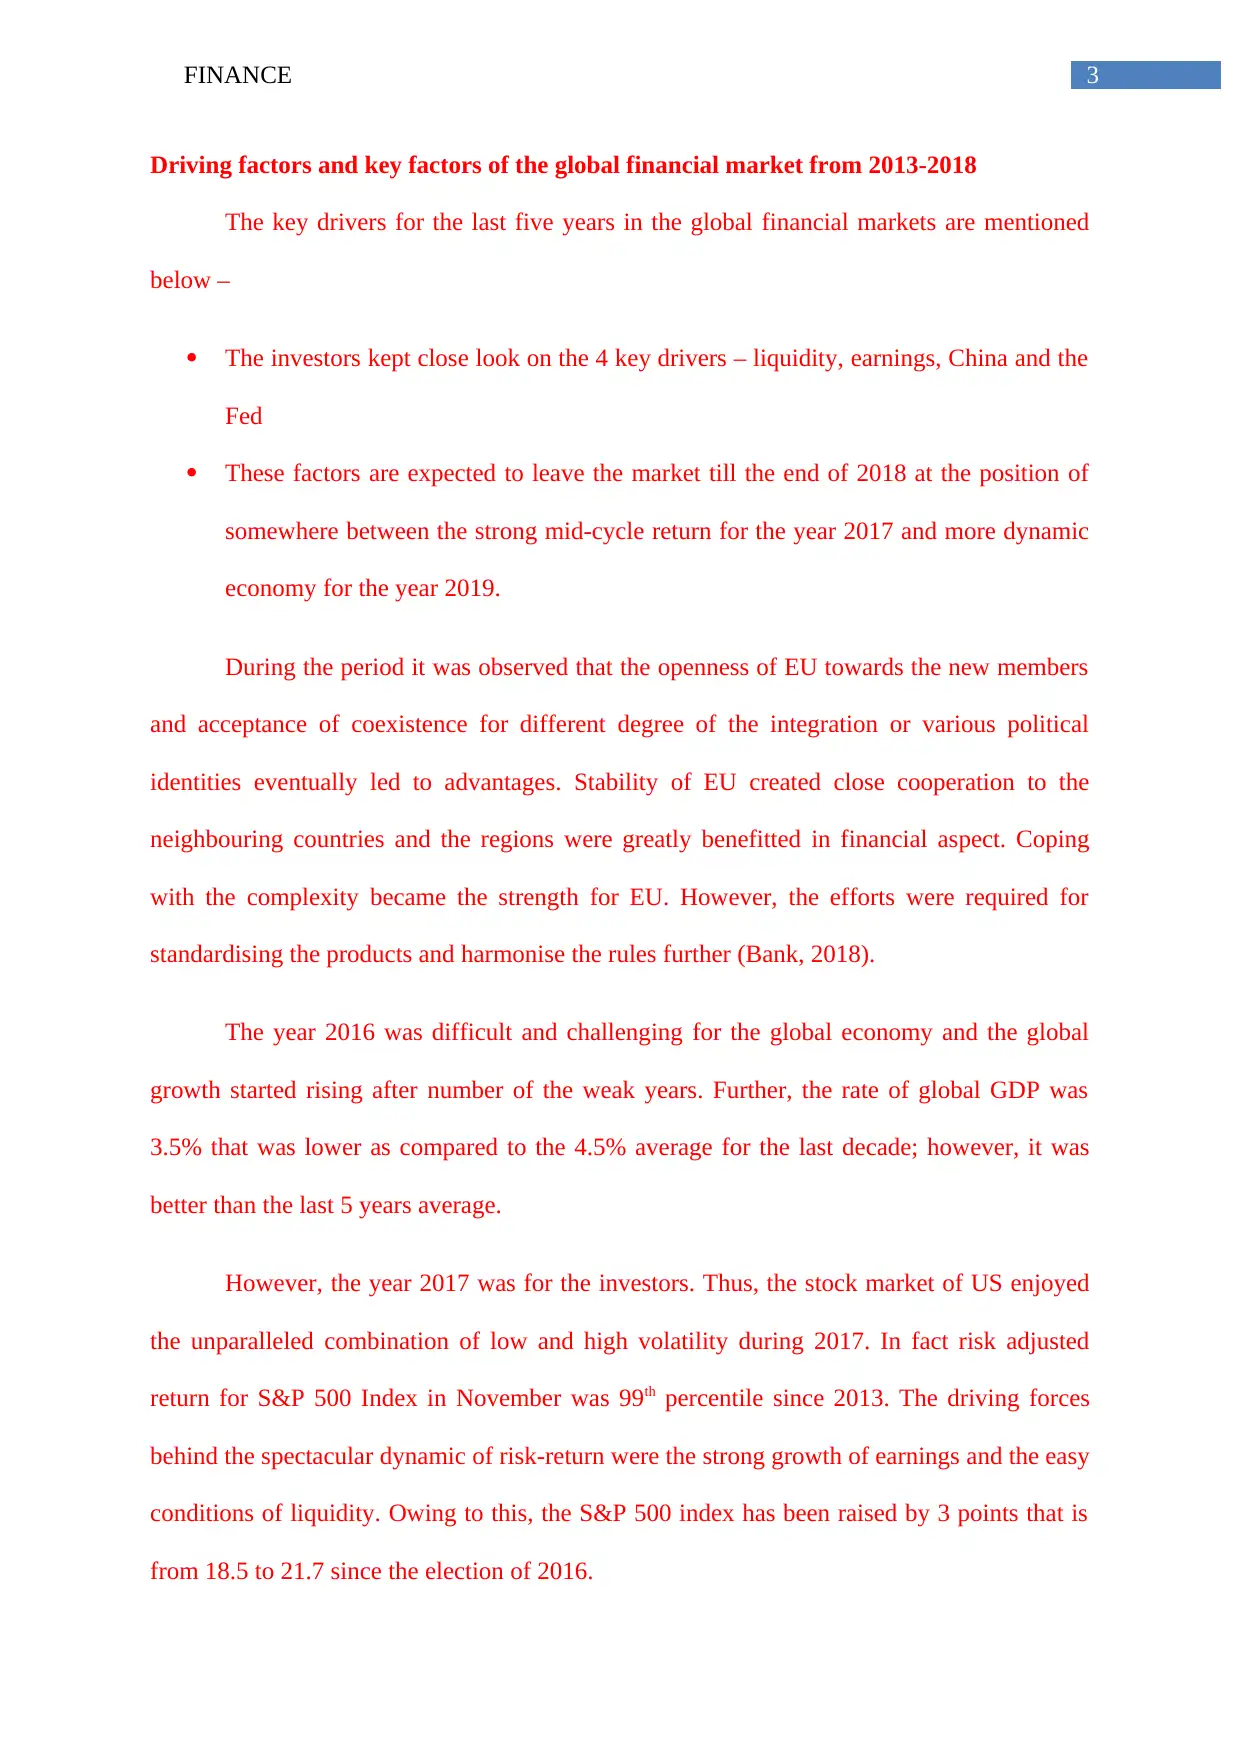
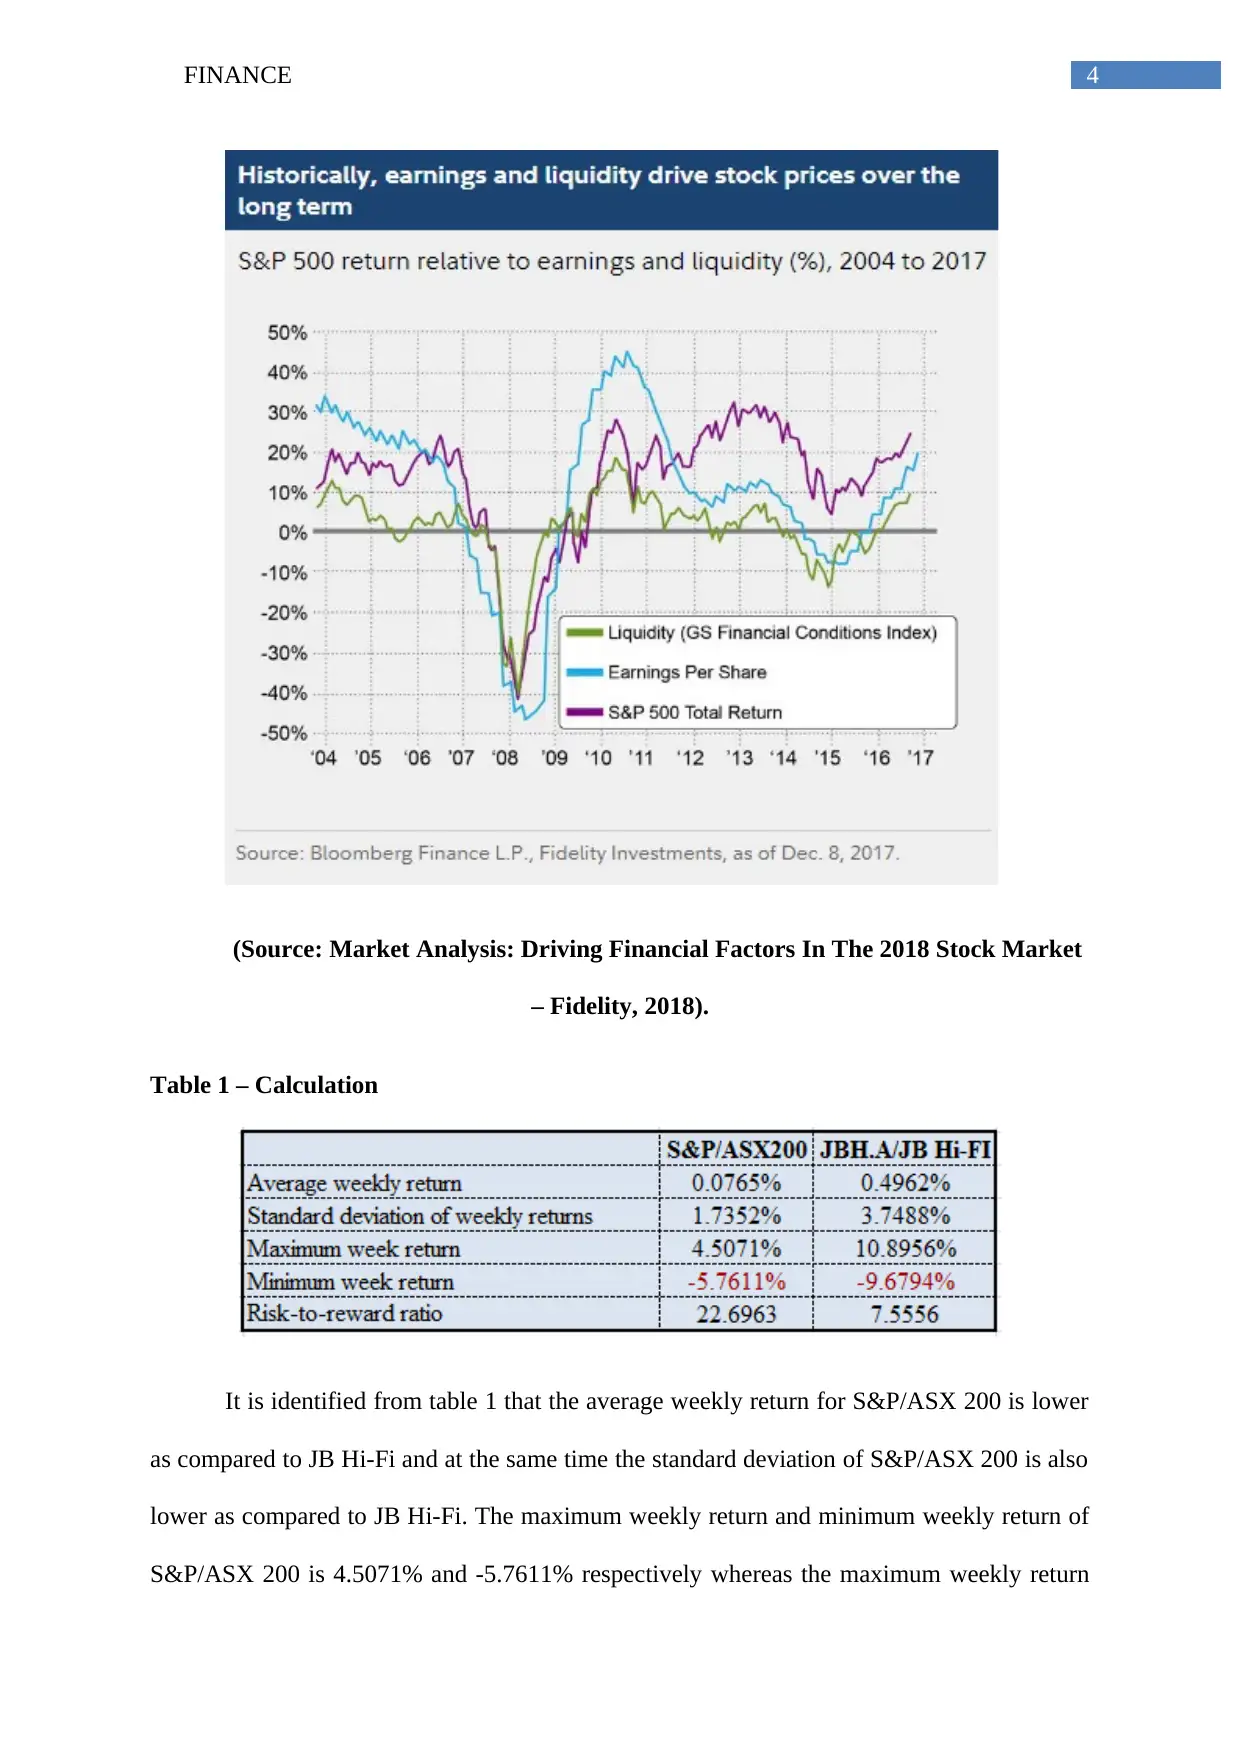
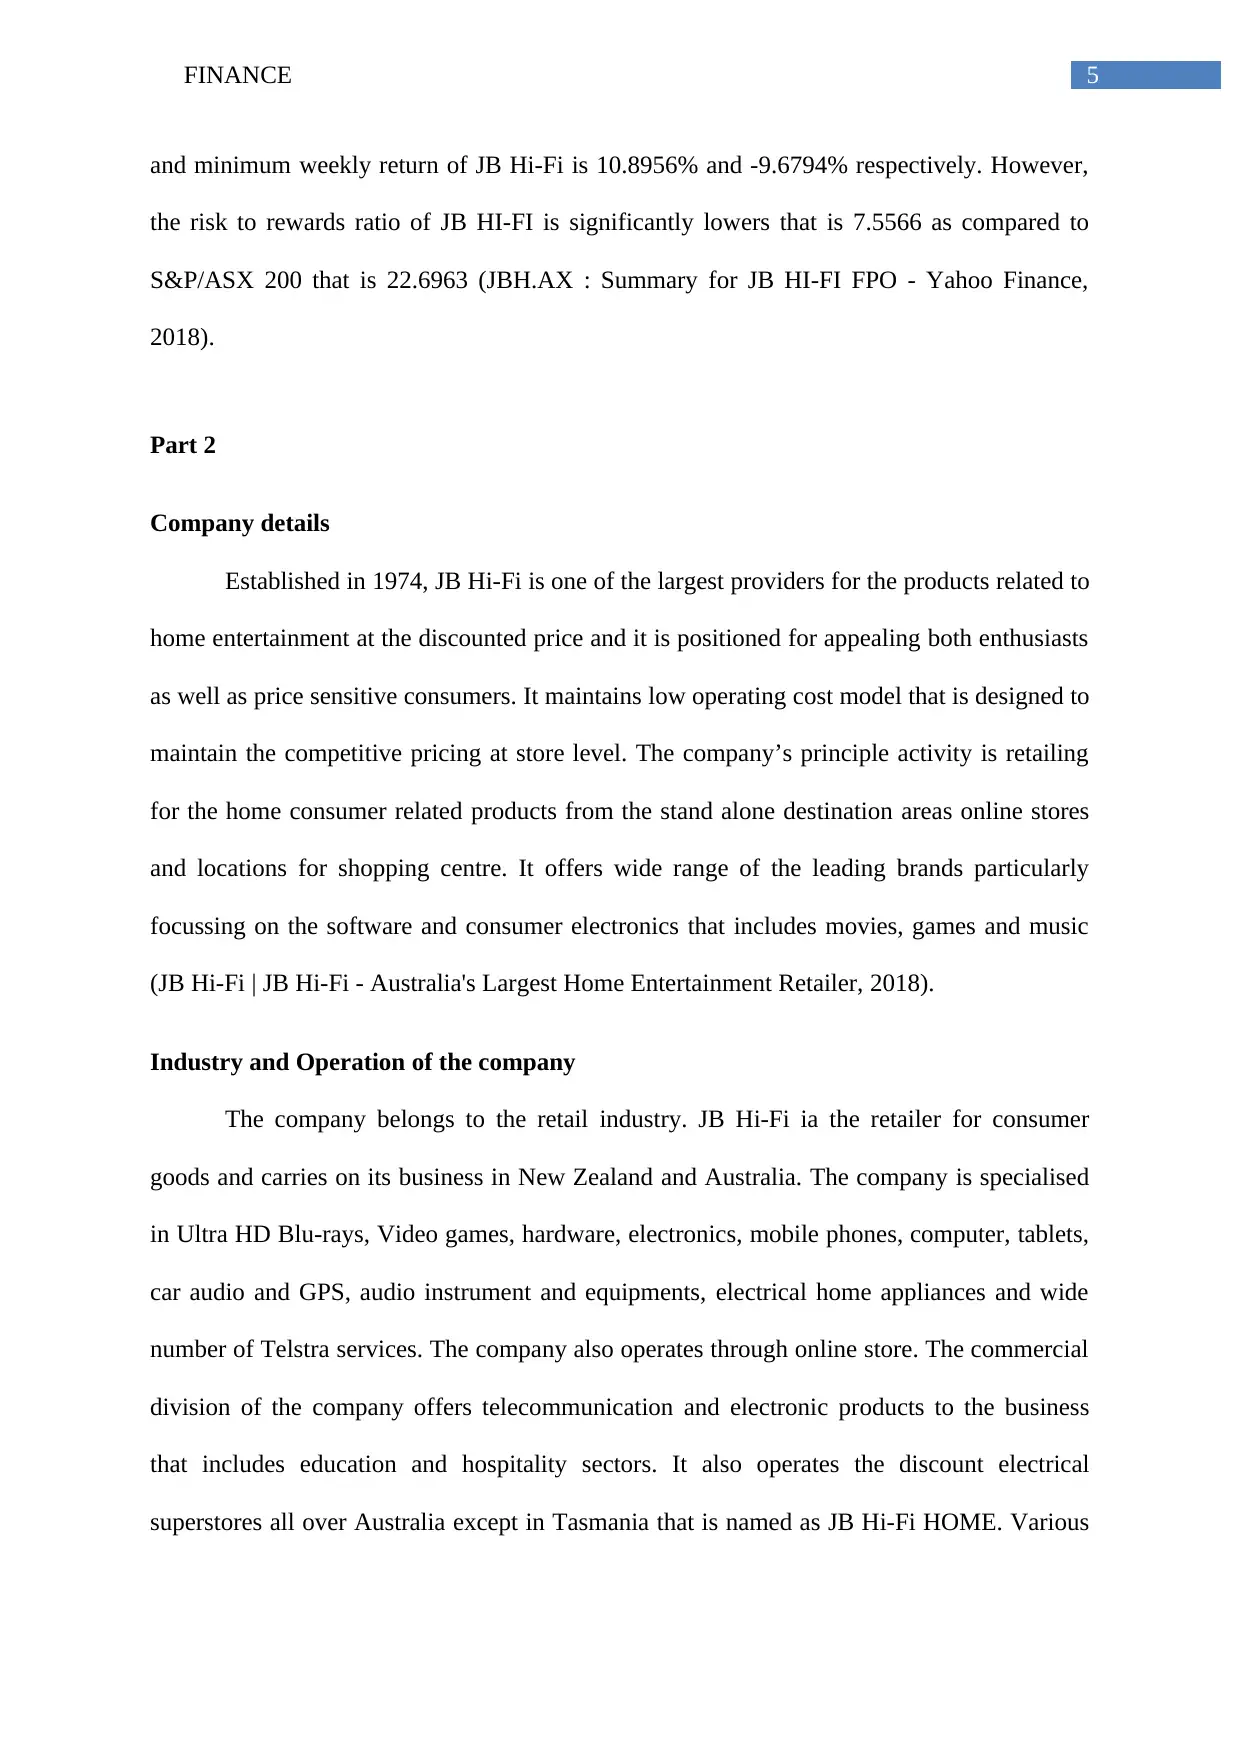
This finance report provides an analysis of market trends and the performance of two stocks, S&P/ASX 200 and JB Hi-Fi, from 2013 to 2018. It examines the upward market trends for both stocks, supported by diagrams and data on price movements and weekly returns. The report identifies key drivers in the global financial market during the period, including liquidity, earnings, China, and the Federal Reserve. It further presents a comparative analysis of the two stocks, including calculations of average weekly returns, standard deviations, and risk-reward ratios. The second part of the report offers a detailed overview of JB Hi-Fi, including its company details, industry, and operational activities, highlighting its position as a major retailer in the home entertainment and consumer electronics sectors. The report concludes with a reference list.

Running head: FINANCE
Finance
Name of the student
Name of the university
Student ID
Author note
Finance
Name of the student
Name of the university
Student ID
Author note
Paraphrase This Document
Need a fresh take? Get an instant paraphrase of this document with our AI Paraphraser

1FINANCE
Table of Contents
Task 1.........................................................................................................................................2
Diagram 1 – Price movement of stock...................................................................................2
Diagram 2 – Weekly return of stock......................................................................................2
Market trend...........................................................................................................................2
Driving factors and key factors of the global financial market from 2013-2018...................2
Table 1 – Calculation.............................................................................................................4
Part 2..........................................................................................................................................5
Company details.....................................................................................................................5
Industry and Operation of the company.................................................................................5
Reference....................................................................................................................................7

2FINANCE
Task 1
Diagram 1 – Price movement of stock
Diagram 2 – Weekly return of stock
Market trend
It has been identified from the above figure that the market trends for the shares are
increasing. The share price of S&P/ASX 200 has been increased from 5033.90 to 5909.00
over the last five years period from 10–2 –2013 to 11-2-2018. In the same way, the Share
price of JB Hi-Fi has been increased from 8.4699 to 25.7247 over the last five years period
from 10–2 –2013 to 11-2-2018. Therefore, the market trends for both the stocks are upward
moving (JBH.AX : Summary for JB HI-FI FPO - Yahoo Finance, 2018).
⊘ This is a preview!⊘
Do you want full access?
Subscribe today to unlock all pages.

Trusted by 1+ million students worldwide

3FINANCE
Driving factors and key factors of the global financial market from 2013-2018
The key drivers for the last five years in the global financial markets are mentioned
below –
The investors kept close look on the 4 key drivers – liquidity, earnings, China and the
Fed
These factors are expected to leave the market till the end of 2018 at the position of
somewhere between the strong mid-cycle return for the year 2017 and more dynamic
economy for the year 2019.
During the period it was observed that the openness of EU towards the new members
and acceptance of coexistence for different degree of the integration or various political
identities eventually led to advantages. Stability of EU created close cooperation to the
neighbouring countries and the regions were greatly benefitted in financial aspect. Coping
with the complexity became the strength for EU. However, the efforts were required for
standardising the products and harmonise the rules further (Bank, 2018).
The year 2016 was difficult and challenging for the global economy and the global
growth started rising after number of the weak years. Further, the rate of global GDP was
3.5% that was lower as compared to the 4.5% average for the last decade; however, it was
better than the last 5 years average.
However, the year 2017 was for the investors. Thus, the stock market of US enjoyed
the unparalleled combination of low and high volatility during 2017. In fact risk adjusted
return for S&P 500 Index in November was 99th percentile since 2013. The driving forces
behind the spectacular dynamic of risk-return were the strong growth of earnings and the easy
conditions of liquidity. Owing to this, the S&P 500 index has been raised by 3 points that is
from 18.5 to 21.7 since the election of 2016.
Paraphrase This Document
Need a fresh take? Get an instant paraphrase of this document with our AI Paraphraser

4FINANCE
(Source: Market Analysis: Driving Financial Factors In The 2018 Stock Market
– Fidelity, 2018).
Table 1 – Calculation
It is identified from table 1 that the average weekly return for S&P/ASX 200 is lower
as compared to JB Hi-Fi and at the same time the standard deviation of S&P/ASX 200 is also
lower as compared to JB Hi-Fi. The maximum weekly return and minimum weekly return of
S&P/ASX 200 is 4.5071% and -5.7611% respectively whereas the maximum weekly return

5FINANCE
and minimum weekly return of JB Hi-Fi is 10.8956% and -9.6794% respectively. However,
the risk to rewards ratio of JB HI-FI is significantly lowers that is 7.5566 as compared to
S&P/ASX 200 that is 22.6963 (JBH.AX : Summary for JB HI-FI FPO - Yahoo Finance,
2018).
Part 2
Company details
Established in 1974, JB Hi-Fi is one of the largest providers for the products related to
home entertainment at the discounted price and it is positioned for appealing both enthusiasts
as well as price sensitive consumers. It maintains low operating cost model that is designed to
maintain the competitive pricing at store level. The company’s principle activity is retailing
for the home consumer related products from the stand alone destination areas online stores
and locations for shopping centre. It offers wide range of the leading brands particularly
focussing on the software and consumer electronics that includes movies, games and music
(JB Hi-Fi | JB Hi-Fi - Australia's Largest Home Entertainment Retailer, 2018).
Industry and Operation of the company
The company belongs to the retail industry. JB Hi-Fi ia the retailer for consumer
goods and carries on its business in New Zealand and Australia. The company is specialised
in Ultra HD Blu-rays, Video games, hardware, electronics, mobile phones, computer, tablets,
car audio and GPS, audio instrument and equipments, electrical home appliances and wide
number of Telstra services. The company also operates through online store. The commercial
division of the company offers telecommunication and electronic products to the business
that includes education and hospitality sectors. It also operates the discount electrical
superstores all over Australia except in Tasmania that is named as JB Hi-Fi HOME. Various
⊘ This is a preview!⊘
Do you want full access?
Subscribe today to unlock all pages.

Trusted by 1+ million students worldwide

6FINANCE
goods sold are Whitegoods, consumer electronics, air conditioning and cooking appliances
(JB Hi-Fi | JB Hi-Fi - Australia's Largest Home Entertainment Retailer, 2018).
goods sold are Whitegoods, consumer electronics, air conditioning and cooking appliances
(JB Hi-Fi | JB Hi-Fi - Australia's Largest Home Entertainment Retailer, 2018).
Paraphrase This Document
Need a fresh take? Get an instant paraphrase of this document with our AI Paraphraser

7FINANCE
Reference
Bank, E. (2018). Global Financial Markets 2015: looking ahead - Ten theses - Liechtenstein
Dialogue, Liechtenstein. European Central Bank. Retrieved 5 May 2018, from
https://www.ecb.europa.eu/press/key/date/2005/html/sp051028_1.en.html
JB Hi-Fi | JB Hi-Fi - Australia's Largest Home Entertainment Retailer. (2018). Jbhifi.com.au.
Retrieved 3 May 2018, from https://www.jbhifi.com.au/
JBH.AX : Summary for JB HI-FI FPO - Yahoo Finance. (2018). Finance.yahoo.com.
Retrieved 3 May 2018, from https://finance.yahoo.com/quote/jbh.ax?ltr=1
Market Analysis: Driving Financial Factors In The 2018 Stock Market - Fidelity. (2018).
Fidelity.com. Retrieved 5 May 2018, from
https://www.fidelity.com/viewpoints/market-and-economic-insights/2018-stock-
market-analysis
1 out of 8
Related Documents

Your All-in-One AI-Powered Toolkit for Academic Success.
+13062052269
info@desklib.com
Available 24*7 on WhatsApp / Email
Unlock your academic potential
Copyright © 2020–2025 A2Z Services. All Rights Reserved. Developed and managed by ZUCOL.