Indian Markets: Bond Valuation, Investment, and PNB Scam Analysis
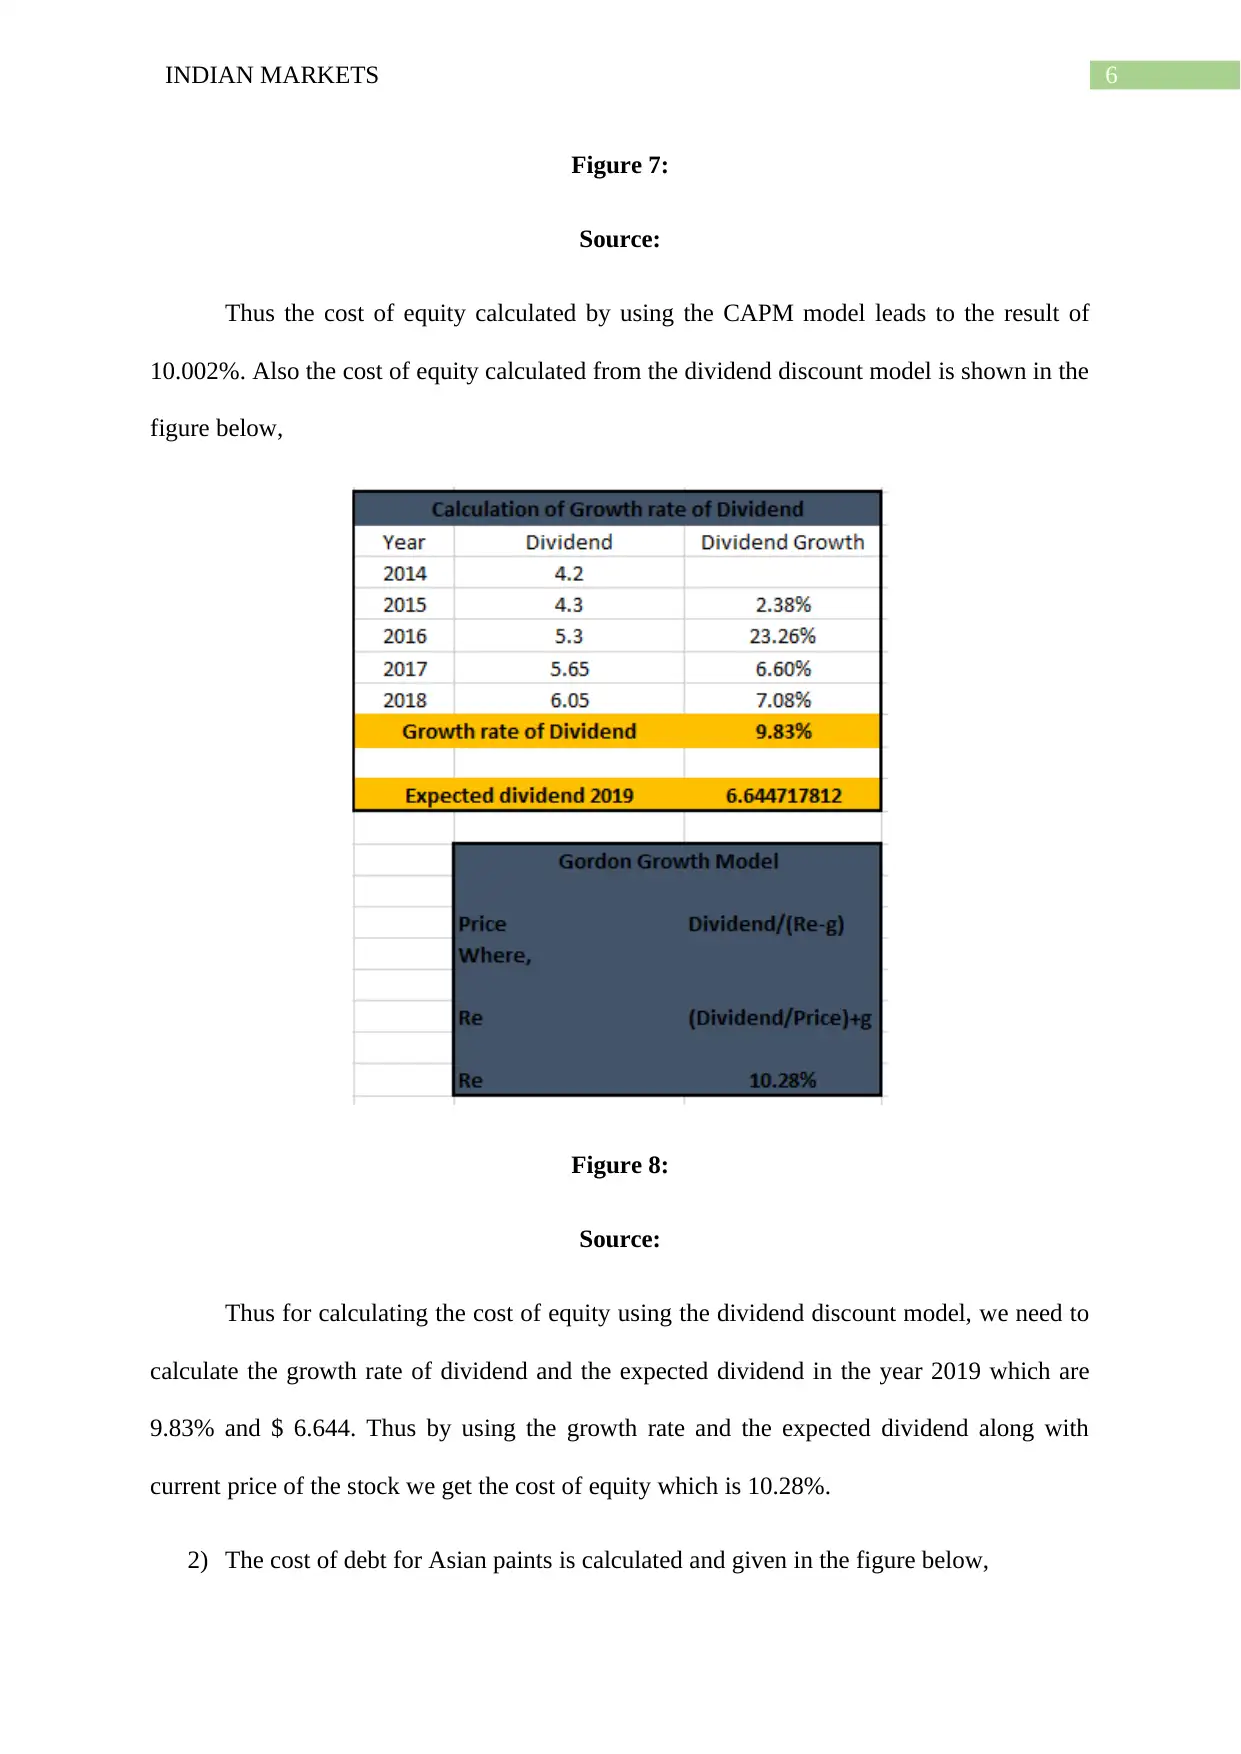
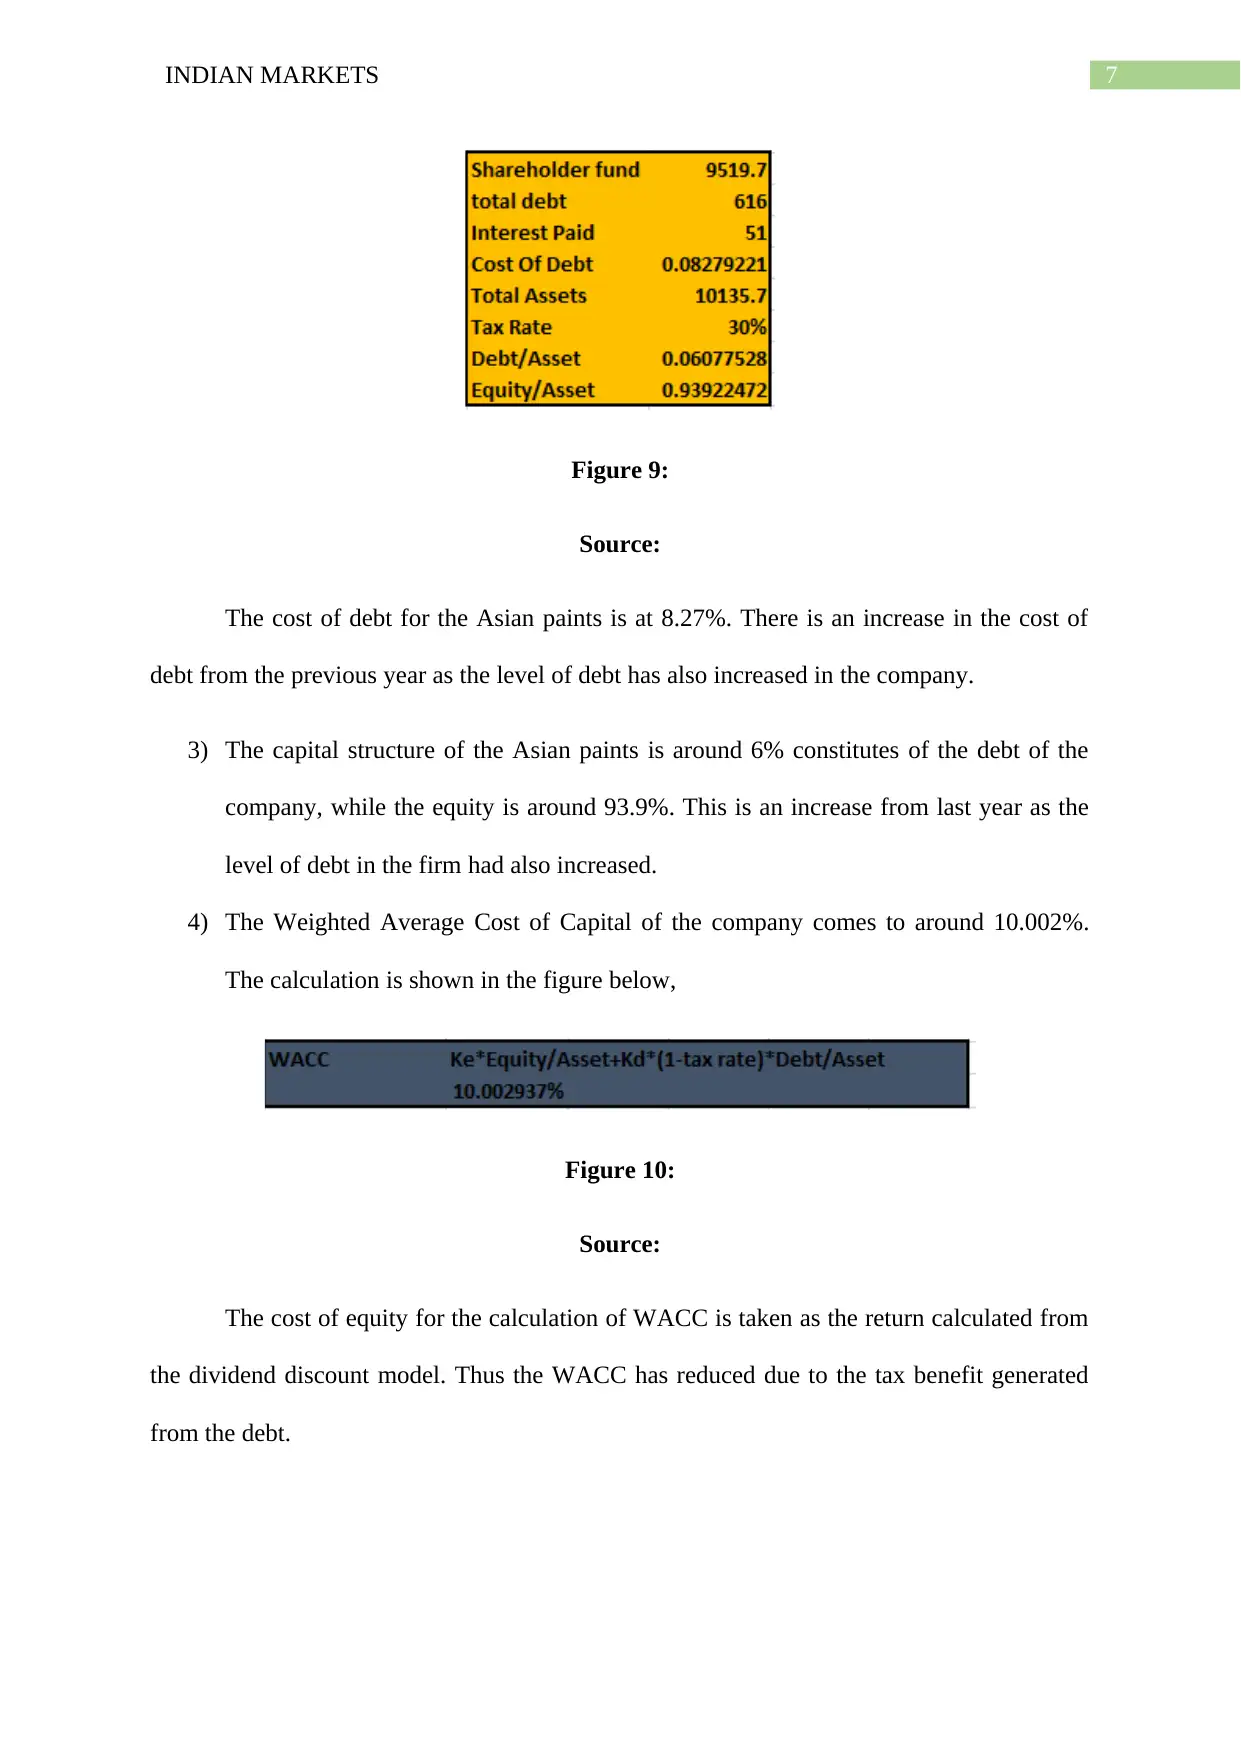
Verified

Added on  2022/10/13

|11
|1589
|439
Homework Assignment
AI Summary
This assignment analyzes the Indian markets, focusing on bond valuation, investment analysis, and the PNB scam. It begins with calculations of bond prices and yield to maturity, considering both annual and semi-annual coupon payments. The analysis then evaluates investment options, including expected rates of return and standard deviations, recommending investment strategies based on risk tolerance. The assignment further delves into the cost of equity using the CAPM and dividend discount models, and calculates the cost of debt and WACC for Asian Paints. Finally, it examines the PNB scam, discussing its causes, implications, and failures in corporate governance, along with recommendations for preventing similar financial frauds. The assignment uses figures and sources to support its calculations and arguments, providing a comprehensive overview of the topics covered.
tabler-icon-diamond-filled.svg

Contribute Materials

Your contribution can guide someone’s learning journey. Share your documents today.
Document Page
Running head: INDIAN MARKETS
Indian Markets
Name of the University:
Name of the Student:
Author Note:
tabler-icon-diamond-filled.svg

Secure Best Marks with AI Grader

Need help grading? Try our AI Grader for instant feedback on your assignments.
Document Page
1INDIAN MARKETS
Table of Contents
Answer to Question 1:................................................................................................................2
Part a:.....................................................................................................................................2
Part b:.....................................................................................................................................3
Answer to Question 2:................................................................................................................5
Answer to Question 3:................................................................................................................8
References and Bibliographies:................................................................................................10
Document Page
2INDIAN MARKETS
Answer to Question 1:
Part a:
i) The bond price for the bond ABC and YTM of bond XYZ is calculated in the
figure below,
Figure 1:
Source:
Figure 2:
Source:
Thus the price of the bond ABC is $ 1042.7 while the yield to maturity of bond XYZ
is 8%.
ii) The above calculation for bond ABC highlights the price of the bond when the
coupon payments are paid annually. The following calculation highlights the price
of the bond when the coupon payments are made semi-annually.
Document Page
3INDIAN MARKETS
Figure 3:
Source:
Thus the price of the bond with semi-annual coupon payments comes to around
$830.4.
Part b:
i) The Expected rate of return and the standard deviation for each of the investment
available to the company is provided in the figure below,
Figure 4:
Source:
Thus the return and the standard deviation for the investment R is 11.08% and the
standard deviation is 0.7724%.
tabler-icon-diamond-filled.svg

Secure Best Marks with AI Grader

Need help grading? Try our AI Grader for instant feedback on your assignments.
Document Page
4INDIAN MARKETS
Figure 5:
Source:
The return generated by investment S is 16.920% while the standard deviation is
6.528%.
ii) The return on the Investment R is at around 11.08% with a very less volatility
which is represented by the standard deviation of 0.7724%. The return on
Investment S is at around 16.92% but has a high volatility of 6.528%. Thus the
company should invest in Investment R because of lower volatility.
However, the company can increase its return by investing equally in both the
investment. Thus this would increase the volatility but it would be less than
Investment S but the return would be greater than Investment R. The calculation
are presented in the figure below,
Figure 6:
Document Page
5INDIAN MARKETS
Source:
The return generated by investing equally in the two investment is at 14% while the
volatility is reduced to 4.63%. Thus if the company is willing to bear more risk it can invest
equally. The reason for the rising return and the falling standard deviation is the
diversification of benefits.
Answer to Question 2:
1) For the calculation of the cost of equity using the CAPM we first need to calculate the
Beta of the company which is calculated using the data of Asian Paints and the
relevant index.
Figure 6:
Source:
Thus the Beta of the Company is close to 1 around 1.000497. Thus if the market index
rises the stock of Asian paints also rises by almost the same amount in the same direction.
The calculation of CAPM is highlighted in the figure below,
Document Page
6INDIAN MARKETS
Figure 7:
Source:
Thus the cost of equity calculated by using the CAPM model leads to the result of
10.002%. Also the cost of equity calculated from the dividend discount model is shown in the
figure below,
Figure 8:
Source:
Thus for calculating the cost of equity using the dividend discount model, we need to
calculate the growth rate of dividend and the expected dividend in the year 2019 which are
9.83% and $ 6.644. Thus by using the growth rate and the expected dividend along with
current price of the stock we get the cost of equity which is 10.28%.
2) The cost of debt for Asian paints is calculated and given in the figure below,
tabler-icon-diamond-filled.svg

Paraphrase This Document

Need a fresh take? Get an instant paraphrase of this document with our AI Paraphraser
Document Page
7INDIAN MARKETS
Figure 9:
Source:
The cost of debt for the Asian paints is at 8.27%. There is an increase in the cost of
debt from the previous year as the level of debt has also increased in the company.
3) The capital structure of the Asian paints is around 6% constitutes of the debt of the
company, while the equity is around 93.9%. This is an increase from last year as the
level of debt in the firm had also increased.
4) The Weighted Average Cost of Capital of the company comes to around 10.002%.
The calculation is shown in the figure below,
Figure 10:
Source:
The cost of equity for the calculation of WACC is taken as the return calculated from
the dividend discount model. Thus the WACC has reduced due to the tax benefit generated
from the debt.
Document Page
8INDIAN MARKETS
Answer to Question 3:
The PNB Scam is one of the biggest scam which occurred in the financial history of
India. This scam was conducted by Mr. Nirav Modi and his uncle Mehul Choksi. The scam
wiped out the profits of the bank which was already in a distressed situation. The scam
conducted with the help of an official of the bank which generated LOU without checking the
necessary files and paper. The past LOU taken by the accused was not also checked and new
LOU were issued. Thus at first a small amount of around 200cr was discovered but on further
investigation it led to around 11400cr. This was carried out over a period of 7 years, thus
highlighting the problem of corporate governance and agency problem in the bank (Singh and
Gupta 2018).
The agency problem is the problem faced by the management and the stock holders of
the company. As the management focuses on to take business decision which are beneficial
for them and not for the general shareholders. This was evident in the PNB scam as the
management in the hopes of increasing business and personal benefits issued LOU at the cost
of the stakeholders of the company. Thus this also highlights the problem of corporate
governance in the company. The company lacked the implementation of proper policy and
procedure to keep a check on the employee of the company. The failure of corporate
governance in the company is shown by the occurrence of the scam over 7 years. The failure
of respective authorities responsible for internal audit of the bank also led to the scam. Thus
the corporate governance rules and regulation of the bank were ineffective to keep a check on
the bank operation. However if the corporate governance policy of the bank were effective it
would have disclosed the Scam at the early stage. If stringent codes and policy would had
been in place the occurrence of such a big scam would not have been possible (Pandya 2018).
Document Page
9INDIAN MARKETS
The Scam took place when employee of the bank used corrupt practice to issue LOU
to the accused, and this was generated for foreign branch of other Indian banks. The scam
was detected by an employee of the bank and thus the CBI- investigation team was involved
and disclosed that the scam was around 11400cr and not only 200cr. The management was
responsible as it failed to keep a check on the system SWIFT which is used to pay foreign
banks. The employee misused this system and generated LOU for the accused for 7 years.
Thus the failure of the management led to this scam (Gayathri 2018).
After the scam the PNB had stopped providing offshore credits and had a thorough
audit of its operation which led to the disclosure of few smaller scams taking place in the
bank. The Reserve Bank of India had issued notices to stop the issuance of LOU and letter of
credit by all the banks. The government of India passed a bill in which the assets of the loan
defaulters and other fraudulent acts against the economy would lead to the confiscation of
their assets.
Thus the PNB scam is a lesson for all the banks and financial institution to have a
strong internal control and regular checking of the loans and credits provided by the banks.
Thus all the banks of India should carry an internal audit and that too frequently before any
such scams occur in the banks (Dora and Umesh 2018).
tabler-icon-diamond-filled.svg

Secure Best Marks with AI Grader

Need help grading? Try our AI Grader for instant feedback on your assignments.
Document Page
10INDIAN MARKETS
References and Bibliographies:
Dora, H.K. and Umesh, W.V., 2018. Examining the impact of political relations in corporate
world: the case of PNB.
Gayathri, S., 2018. A Critical Analysis of the Punjab National Bank Scam and Its
Implications. International Journal of Pure and Applied Mathematics, 119(12), pp.14853-
14866.
Pandya, P., 2018. Public Sector Banks in India: revisiting regulatory and corporate
governance in the light of the PNB scam. South Asia@ LSE.
Singh, A.K. and Gupta, R., 2018. Gem of a scam: Nirav Modi. Delhi Business Review, 19(1),
p.119.
Singh, G., Goyal, R., Patel, R. and Warrier, A., 2018. The Dominion Effect of Bank Crisis &
Exchange Rate. IJRAR-International Journal of Research and Analytical Reviews
(IJRAR), 5(4), pp.251-257.
chevron_up_icon
1 out of 11
circle_padding
hide_on_mobile
zoom_out_icon
logo.png

Your All-in-One AI-Powered Toolkit for Academic Success.

Available 24*7 on WhatsApp / Email

[object Object]