Financial Markets: Analysis of Australian Mineral Industry Companies
VerifiedAdded on 2020/02/24
|24
|4983
|36
Report
AI Summary
This report presents a fundamental analysis of the Australian mineral industry, focusing on Azure Minerals and Oz Minerals. It employs both top-down and bottom-up approaches to evaluate the companies' performance within the context of the Australian economy. The top-down analysis considers macroeconomic factors such as GDP growth, unemployment rates, inflation, and exchange rates, supported by statistical data and graphs. The bottom-up analysis utilizes ratio analysis to assess the financial health and performance of Azure Minerals and Oz Minerals, providing a basis for investment decisions and company comparisons. The report concludes with recommendations for investors, offering guidance on effective investment strategies in the mineral sector.
Running head: PRINCIPLES OF FINANCIAL MARKETS
Principles of Financial Markets
Name of the Student:
Name of the University:
Author’s Note:
Principles of Financial Markets
Name of the Student:
Name of the University:
Author’s Note:
Paraphrase This Document
Need a fresh take? Get an instant paraphrase of this document with our AI Paraphraser
1
PRINCIPLES OF FINANCIAL MARKETS
Executive Summary
This paper has been established in order to disclose the top up and the bottom down
evaluation of the mineral industry in Australia that has led to fundamental analysis. The
companies that have been chosen for the completion of the paper with the help of
fundamental analysis is Azure Minerals and Oz Minerals that are renowned manufacturers of
mineral in the mineral sector of Australia. The fundamental analysis is assessed by
undertaking the bottom up and the top down analysis of the Australian mineral industry. The
history and the backdrop of the mineral sector of Australia has even been explained the
construction of the top down analysis is completed by considering the numerous macro-
economic factors that are inclusive of the rate of unemployment, rate of GDP, inflation rate
and the rate of exchange of the economy of Australia. The paper has even disclosed
numerous graphs and figures that explain the representation of performance of the Australian
economy statistically. The bottom up assessment of the companies has been undertaken with
the help of ratio analytical tools by the researcher. The analysis of the ratio is regarded as one
of the significant mechanism for the investors for undertaking decisions with respect to
investment. Additionally, it even assists in undertaking the performance comparison of the
chosen companies of the mineral sector. The last part of the paper explains in a detailed
manner the synopsis of the paper and gives out suggestions and advices for the investors so
that it would enable them to undertake effective investment decisions.
2
PRINCIPLES OF FINANCIAL MARKETS
Table of Contents
Introduction................................................................................................................................3
Background of the Mineral Industry of Australia......................................................................3
Mission statement and Overview of the companies...................................................................4
Top Down analysis.....................................................................................................................6
Bottom up Analysis..................................................................................................................10
Recommendations and Summary.............................................................................................19
Reference List..........................................................................................................................20
⊘ This is a preview!⊘
Do you want full access?
Subscribe today to unlock all pages.
Trusted by 1+ million students worldwide
3
PRINCIPLES OF FINANCIAL MARKETS
Introduction
It is significant for the shareholders and the investors to undertake effective evaluation
of the companies within which they are looking for undertaking investments. These sorts of
assessments are undertaken with the assistance of bottom up and top down analysis of the
industry of the company where investments would be undertaken. The investor receives a
disclosure about the macro-economic atmosphere of the business sector with the assistance of
the top down analysis (Sarsby et al. 2014). However, bottom up assessment explains the
micro-economic image of any specific company on which the investor wants to take an
analysis on. In the present paper, the fundamental evaluation of the two organizations that are
listed in ASX and are functioning in the mineral industry has been taken into consideration.
The two companies are inclusive of the Azure Mineral Limited and Oz Minerals Limited.
Background of the Mineral Industry of Australia
The mineral sector of Australia has been a strong and a comprehensive one in spite of
various stumbles like the reduction in the price and it has been observed that the industry is
the biggest contributor towards the trade associated with export of Australia. Australia has
been one of the leading and developing manufacturer and exporter of mineral resources. The
country is the largest manufacturer of initial aluminium and the largest bauxite refiner. The
country has been going through a firm and strong economy that has been primarily due to
reduction in the rate of unemployment and growth rate of the economy of the country that has
been sustainable in nature (Liu et al. 2017). It has been viewed that as the commodity prices
fall, the mineral industry is shifting itself from making investments in the manufacturing
phase along with sustainable growth in the volume of export. Furthermore, the mineral
industry has been observed and assessed by the investors as the industry is inclusive of a high
degree of risk and small mining companies are affected adversely by the scarcity of the
Paraphrase This Document
Need a fresh take? Get an instant paraphrase of this document with our AI Paraphraser
4
PRINCIPLES OF FINANCIAL MARKETS
resources and the capital required for a venture. According to Mineral Council of Australia
and the Centre for International economics, around 60-70% of the mining minerals are
exported globally. A greater degree of interest is generated in the mining boundaries due to
the development of new and improved technologies and swift rise in the extraction of
petroleum. This has increased the drilling of the wells, discovering the data required for
petroleum extraction and the options of enhancement of diversified petroleum production that
are of a variety of range (Linkov et al. 2014). It has been observed that 50% of the demands
of Australia is given by the mineral sector and they are regarded as significant for the
economic development of the country.
Mission statement and Overview of the companies
Oz Minerals is one of the leading mineral explorers in Australia with their focus
primarily on copper. The organization has sufficient amount of capital and financial strength
and has been one of the renowned ASX listed companies. The aim of the organization has
been to make sure that effective utilisation of the capital and establishing firm financial
condition for raising the earnings for the shareholders. Oz Minerals has committed to
function sustainably. It has been an intrinsic part of their strategy and has been the essential
factor for the development and success. The company has concentrated on the creation of
value for their stakeholders that this has laid the establishment of the process towards health,
safety, environment, social performance and well being (Ozminerals.com. 2017). The
company has been presently exploring in Carapateena and Prominent Hills and they are
remaining to emerge as manufacturers. Azure Minerals is an Australian company who are
engaged in the discovery and the extraction of the minerals. The main operations of the
company have been to extract gold, copper, zinc and silver from the mining belts of the
country (Azureminerals.com.au. 2017). The organization has established in the year 2003 and
5
PRINCIPLES OF FINANCIAL MARKETS
has been headquartered in West Perth Australia. The venture reliable operations of the
company have evolved with the partnership with two key mining industries that is inclusive
of the Promontorio and Alacrnran project. They have the intention of undertaking certain
other developmental ventures that are inclusive of environmental, mining, hydrological, and
infrastructural along with the environmental and social components.
Australia has sufficient and diverse mineral and energy resources and the essential
factor to the economic development (Nicholls et al. 2015). Performance and success is the
enhancement of the mineral resource sector and they are a key contributor to the earnings
gained from the exports. The mineral industry is the foundation stone of the Australian
economy with the export value being accounted for $157 million that forms 51% of the
export of goods and services. The mining industry has influenced an overall investment of
$76 billion during the accounting year 2015-16. The overall of $26 billion has been paid as
salaries and wages to the employees and the labours of this sector in the accounting year
2015-16. There are around 2280000 individuals who are employed directly in the mineral
sector and ever since the year 2000, the rate of employment has been increased by double.
The export market of resources and energy of Australia consists of China, Japan, South
Korea, India, EU 28 and other nations of Asia. The nation has more than 260 mineral
manufacturing and gas operational factories.
One of the greatest industrial contributors towards the growth of the economy of the
nation is the mineral industry and strength and relentlessness of the mineral sector was
highlighted in the year 2016. Conversely, regardless of the lower cost or decreasing costs of
the items, a recorded development in resource export was conveyed by the Australian mineral
sector (Zhang et al. 2014). Over the current year, there was a blend of persevering quest for
gains in the productivity and the idea for long term investment. Such changes have been an
evidence of the matter that extended mineral sector is proceeding to have an immense effect
⊘ This is a preview!⊘
Do you want full access?
Subscribe today to unlock all pages.
Trusted by 1+ million students worldwide
6
PRINCIPLES OF FINANCIAL MARKETS
in the economy of nation. The development of mineral resources with respect to the mineral
sector assures payment of dividend to the nation for a long term. The citizens of Australia
would have an increased living standard and the net social welfare that is determined by
income from exports, work, billions of dollars as royalties and regional societies and taxes.
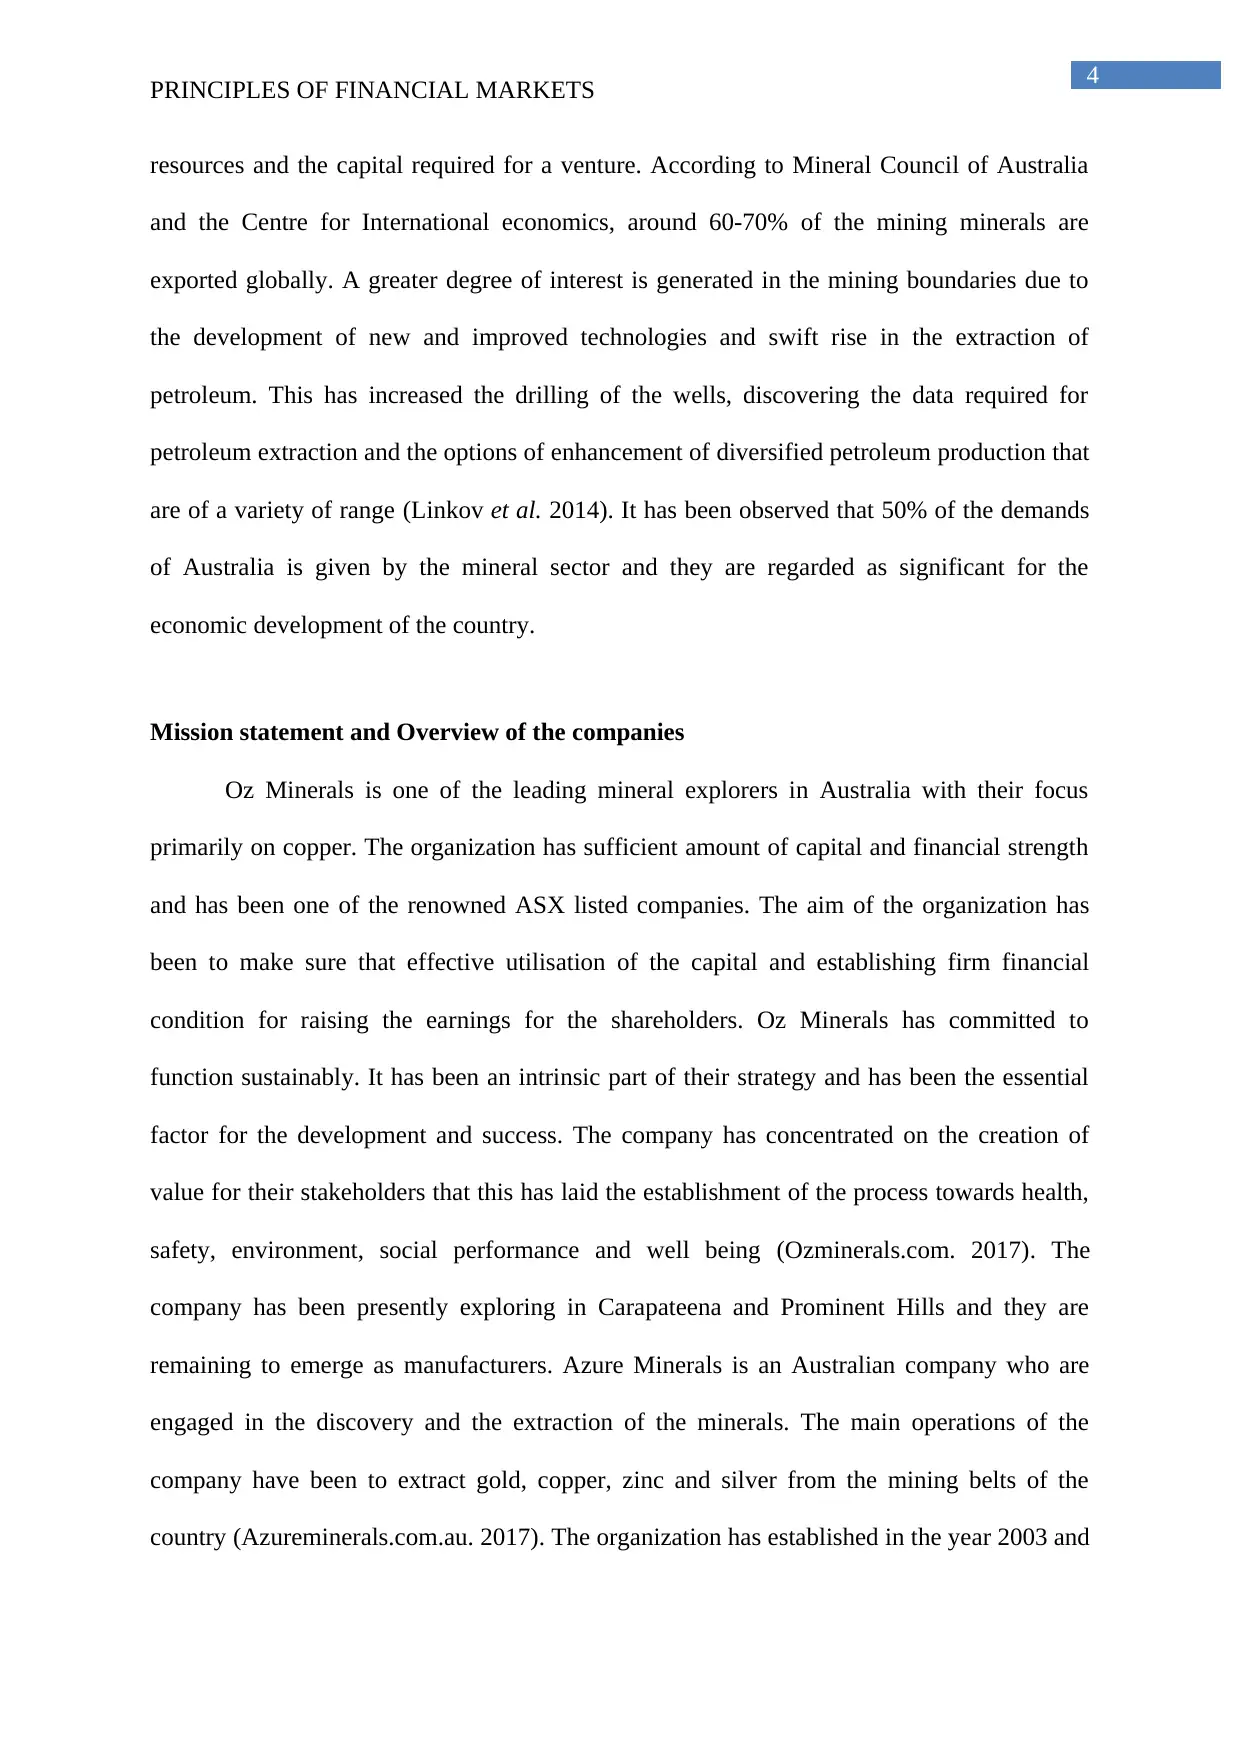
Top Down analysis
Australian economy overview
The top down evaluation of the mineral sector is undertaken by assessing numerous
macro-economic parameters like the GDP, rate of inflation, manufacturing rate and rate of
employment (Dekker et al. 2014). The economy of the country is regarded as a developing
economy and there has been a significant growth of the economy at a rate of 4.40%.
(Source: The Conversation. 2017)
By observing the table above, it can be cited that the rate of growth of Australia has
been more and the unemployment rate has fallen significantly. Additionally, there has been a
rise in the deficit of the current account with the escalation in the inflation simultaneously
PRINCIPLES OF FINANCIAL MARKETS
in the economy of nation. The development of mineral resources with respect to the mineral
sector assures payment of dividend to the nation for a long term. The citizens of Australia
would have an increased living standard and the net social welfare that is determined by
income from exports, work, billions of dollars as royalties and regional societies and taxes.
Top Down analysis
Australian economy overview
The top down evaluation of the mineral sector is undertaken by assessing numerous
macro-economic parameters like the GDP, rate of inflation, manufacturing rate and rate of
employment (Dekker et al. 2014). The economy of the country is regarded as a developing
economy and there has been a significant growth of the economy at a rate of 4.40%.
(Source: The Conversation. 2017)
By observing the table above, it can be cited that the rate of growth of Australia has
been more and the unemployment rate has fallen significantly. Additionally, there has been a
rise in the deficit of the current account with the escalation in the inflation simultaneously
Paraphrase This Document
Need a fresh take? Get an instant paraphrase of this document with our AI Paraphraser
7
PRINCIPLES OF FINANCIAL MARKETS
(Koontz and Newig 2014). The rise in the inflation rate is not observed a positive sign as this
decreases the purchasing power of the individuals and in this respect the government has to
take certain initiatives for lowering the inflation rate in the Australian economy.
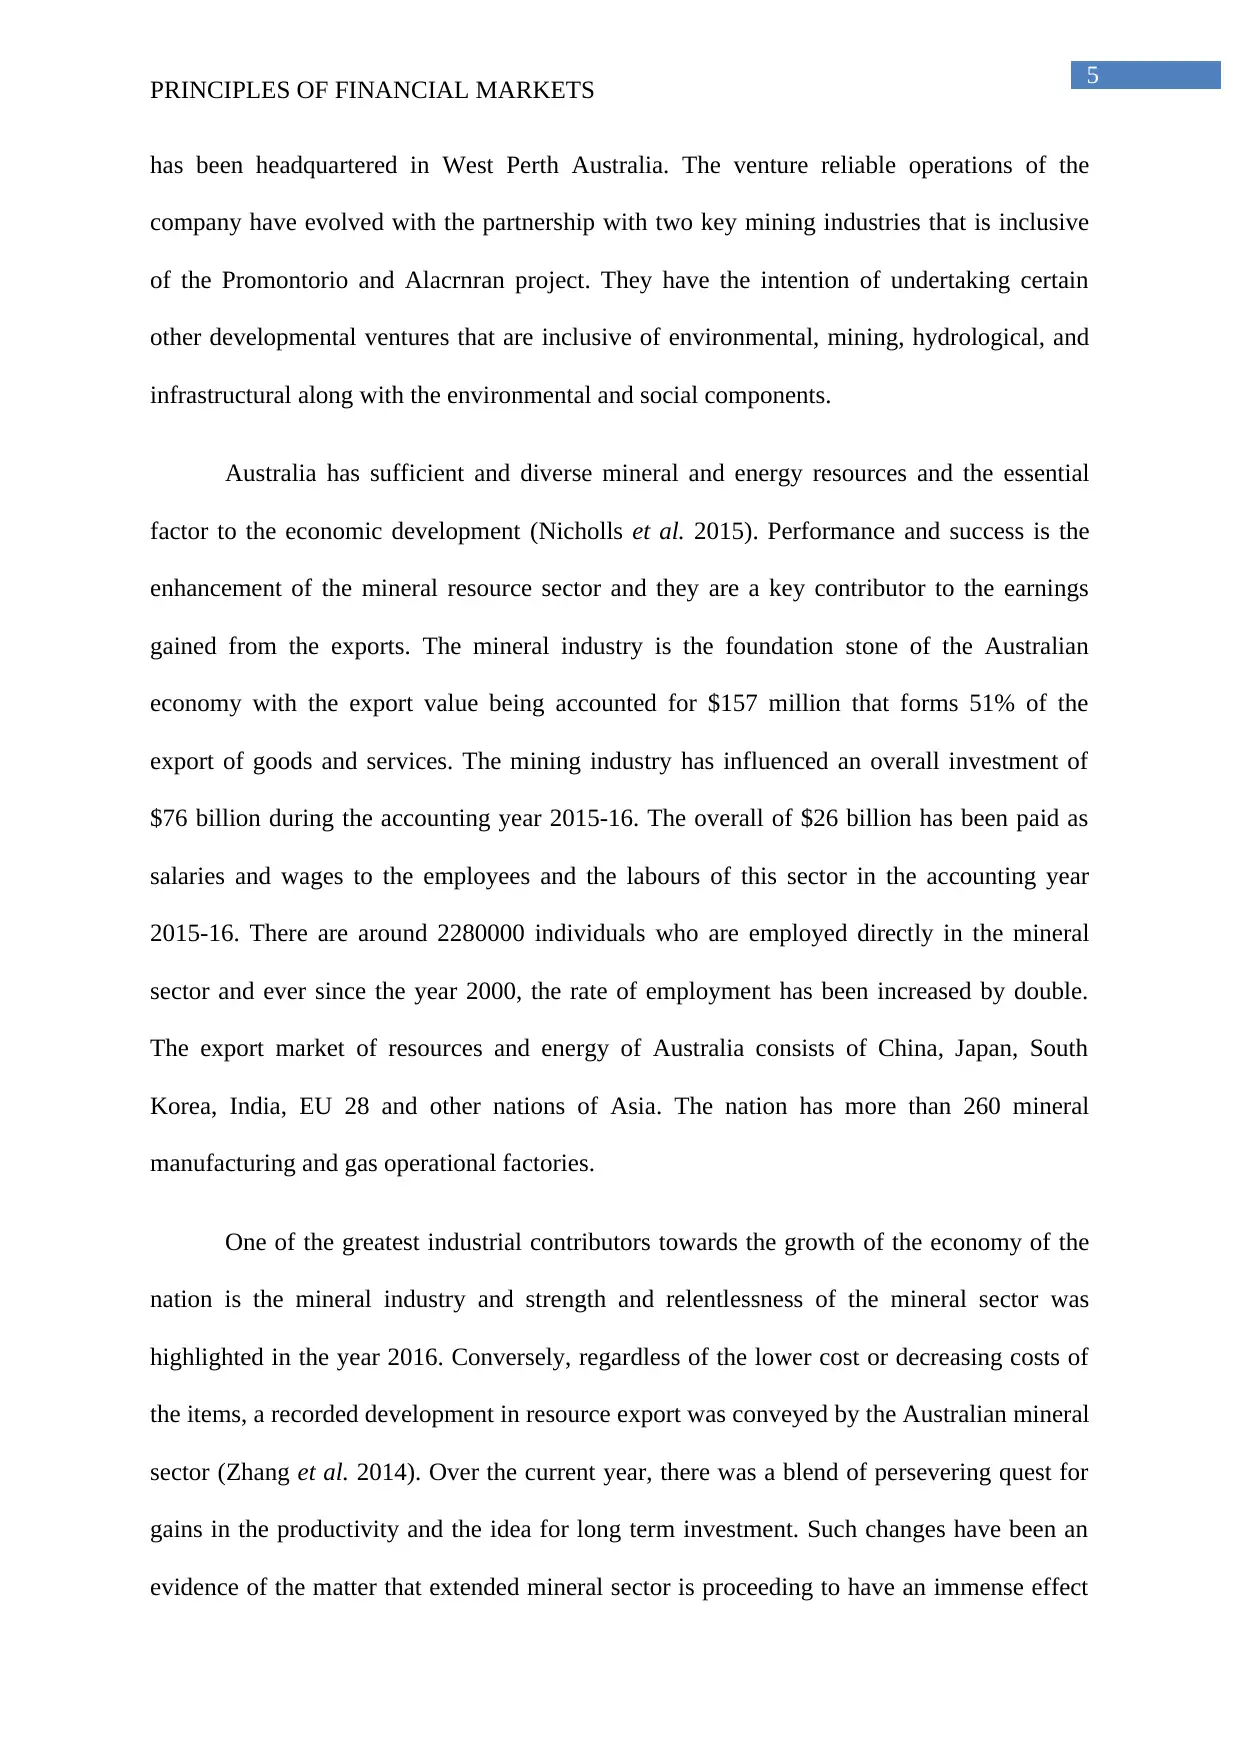
The boom of the resources in the mineral industry has changed the sector from being
investment to manufacturing phase and the sector has been able to manufacture record
volume of the product in the year 2016. The higher level of mineral production and the
amount of iron ore has been increasingly more and the rate has been 66.3% in 2016 in
comparison to 2012. In the time of boom during investment in mineral, there was a fall in the
value of dollar in Australia that resulted to lower level of international demand and rise in the
volume amount of the product (Itti and Borji 2015). The Australian dollar decreased to $0.76
USD in 2016 in comparison to $1.08 USD in 2011. The trading terms of Australia has been
the main factor for the fall in the exchange rate in the country.
(Source: Li, Wu and Zang 2014)
The GDP growth has been observed from the rise in the net exports along with the
household consumption and an optimistic contribution that developed from the governmental
expenditure. The growth in the GDP was detracted from the investment in the business. the
mineral industry was the factor behind the sustainable decline in the investment in the
business. The investment in the business during the year 2014-15 came to $74.8 in
PRINCIPLES OF FINANCIAL MARKETS
(Koontz and Newig 2014). The rise in the inflation rate is not observed a positive sign as this
decreases the purchasing power of the individuals and in this respect the government has to
take certain initiatives for lowering the inflation rate in the Australian economy.
The boom of the resources in the mineral industry has changed the sector from being
investment to manufacturing phase and the sector has been able to manufacture record
volume of the product in the year 2016. The higher level of mineral production and the
amount of iron ore has been increasingly more and the rate has been 66.3% in 2016 in
comparison to 2012. In the time of boom during investment in mineral, there was a fall in the
value of dollar in Australia that resulted to lower level of international demand and rise in the
volume amount of the product (Itti and Borji 2015). The Australian dollar decreased to $0.76
USD in 2016 in comparison to $1.08 USD in 2011. The trading terms of Australia has been
the main factor for the fall in the exchange rate in the country.
(Source: Li, Wu and Zang 2014)
The GDP growth has been observed from the rise in the net exports along with the
household consumption and an optimistic contribution that developed from the governmental
expenditure. The growth in the GDP was detracted from the investment in the business. the
mineral industry was the factor behind the sustainable decline in the investment in the
business. The investment in the business during the year 2014-15 came to $74.8 in
8
PRINCIPLES OF FINANCIAL MARKETS
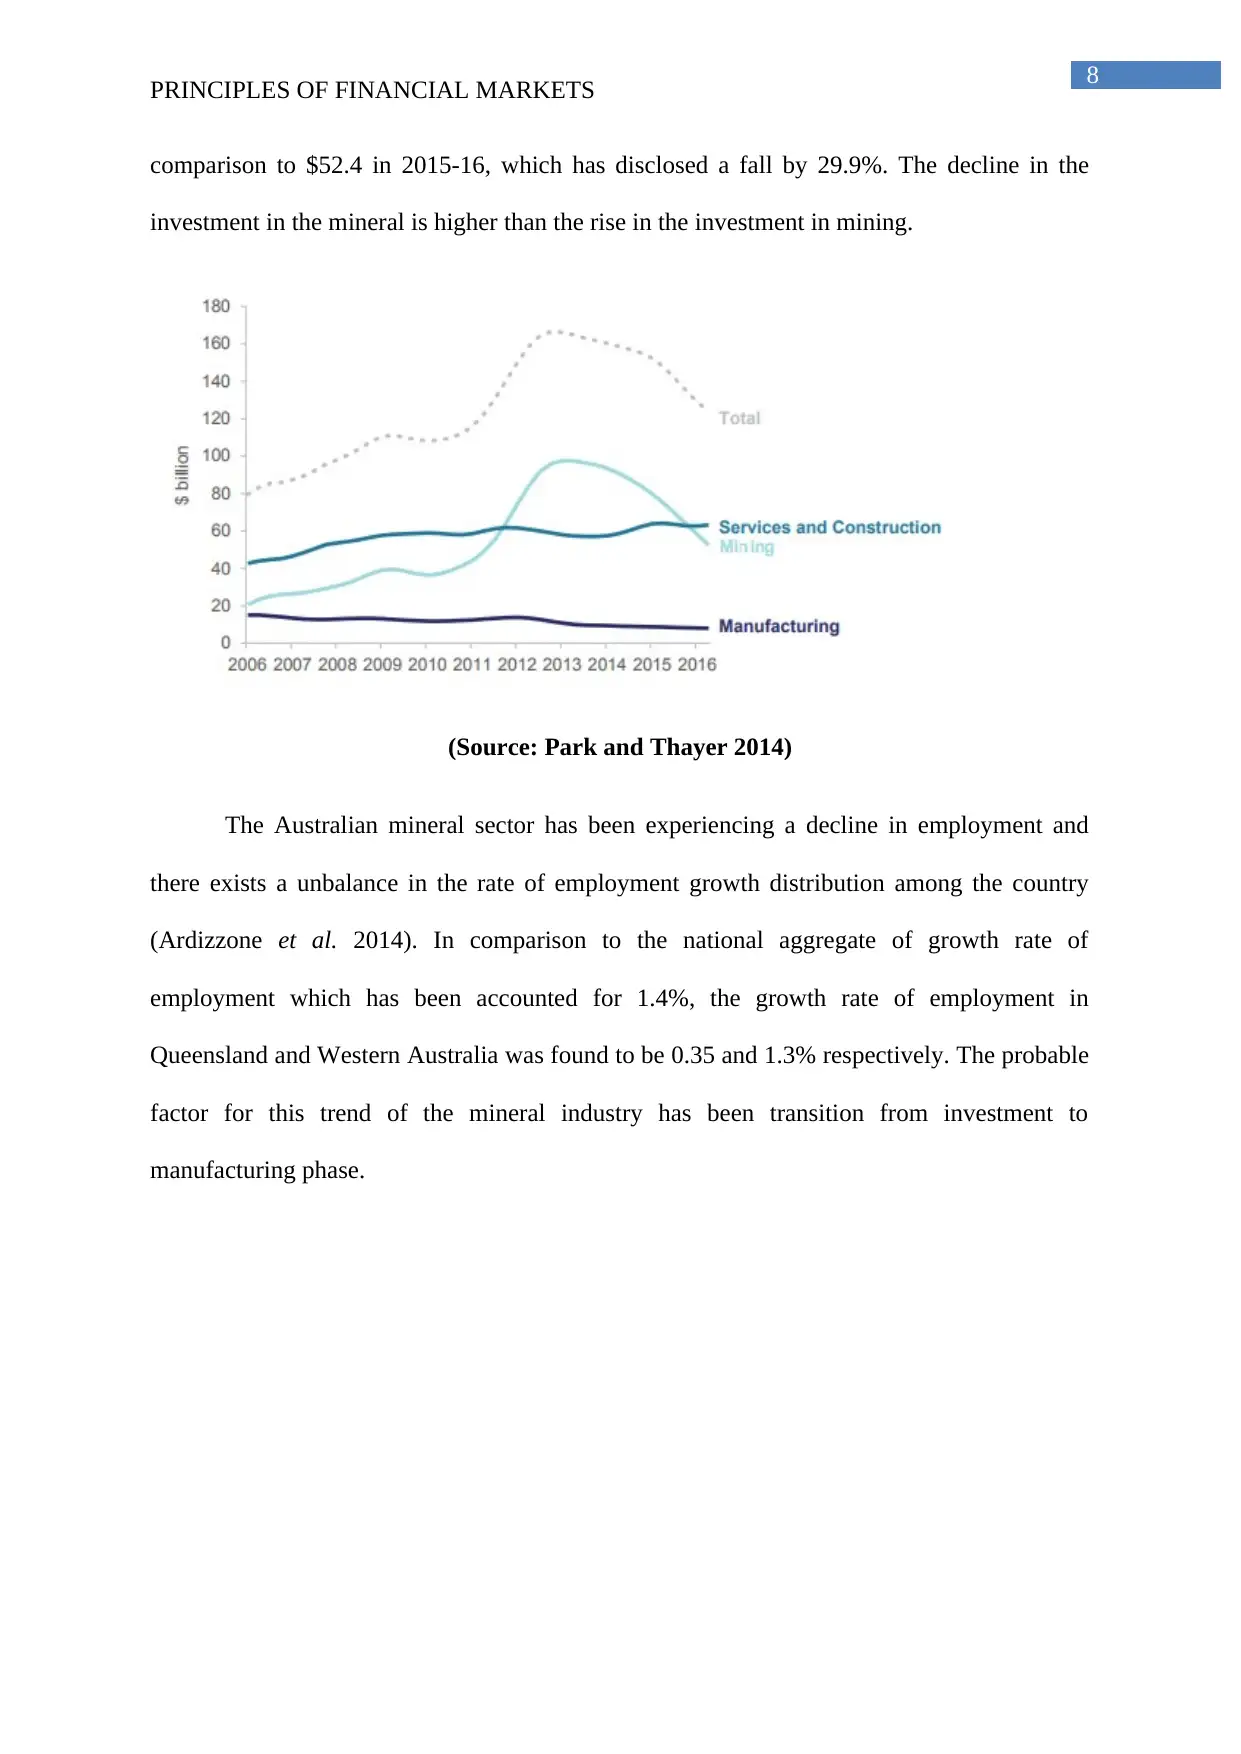
comparison to $52.4 in 2015-16, which has disclosed a fall by 29.9%. The decline in the
investment in the mineral is higher than the rise in the investment in mining.
(Source: Park and Thayer 2014)
The Australian mineral sector has been experiencing a decline in employment and
there exists a unbalance in the rate of employment growth distribution among the country
(Ardizzone et al. 2014). In comparison to the national aggregate of growth rate of
employment which has been accounted for 1.4%, the growth rate of employment in
Queensland and Western Australia was found to be 0.35 and 1.3% respectively. The probable
factor for this trend of the mineral industry has been transition from investment to
manufacturing phase.
PRINCIPLES OF FINANCIAL MARKETS
comparison to $52.4 in 2015-16, which has disclosed a fall by 29.9%. The decline in the
investment in the mineral is higher than the rise in the investment in mining.
(Source: Park and Thayer 2014)
The Australian mineral sector has been experiencing a decline in employment and
there exists a unbalance in the rate of employment growth distribution among the country
(Ardizzone et al. 2014). In comparison to the national aggregate of growth rate of
employment which has been accounted for 1.4%, the growth rate of employment in
Queensland and Western Australia was found to be 0.35 and 1.3% respectively. The probable
factor for this trend of the mineral industry has been transition from investment to
manufacturing phase.
⊘ This is a preview!⊘
Do you want full access?
Subscribe today to unlock all pages.
Trusted by 1+ million students worldwide
9
PRINCIPLES OF FINANCIAL MARKETS
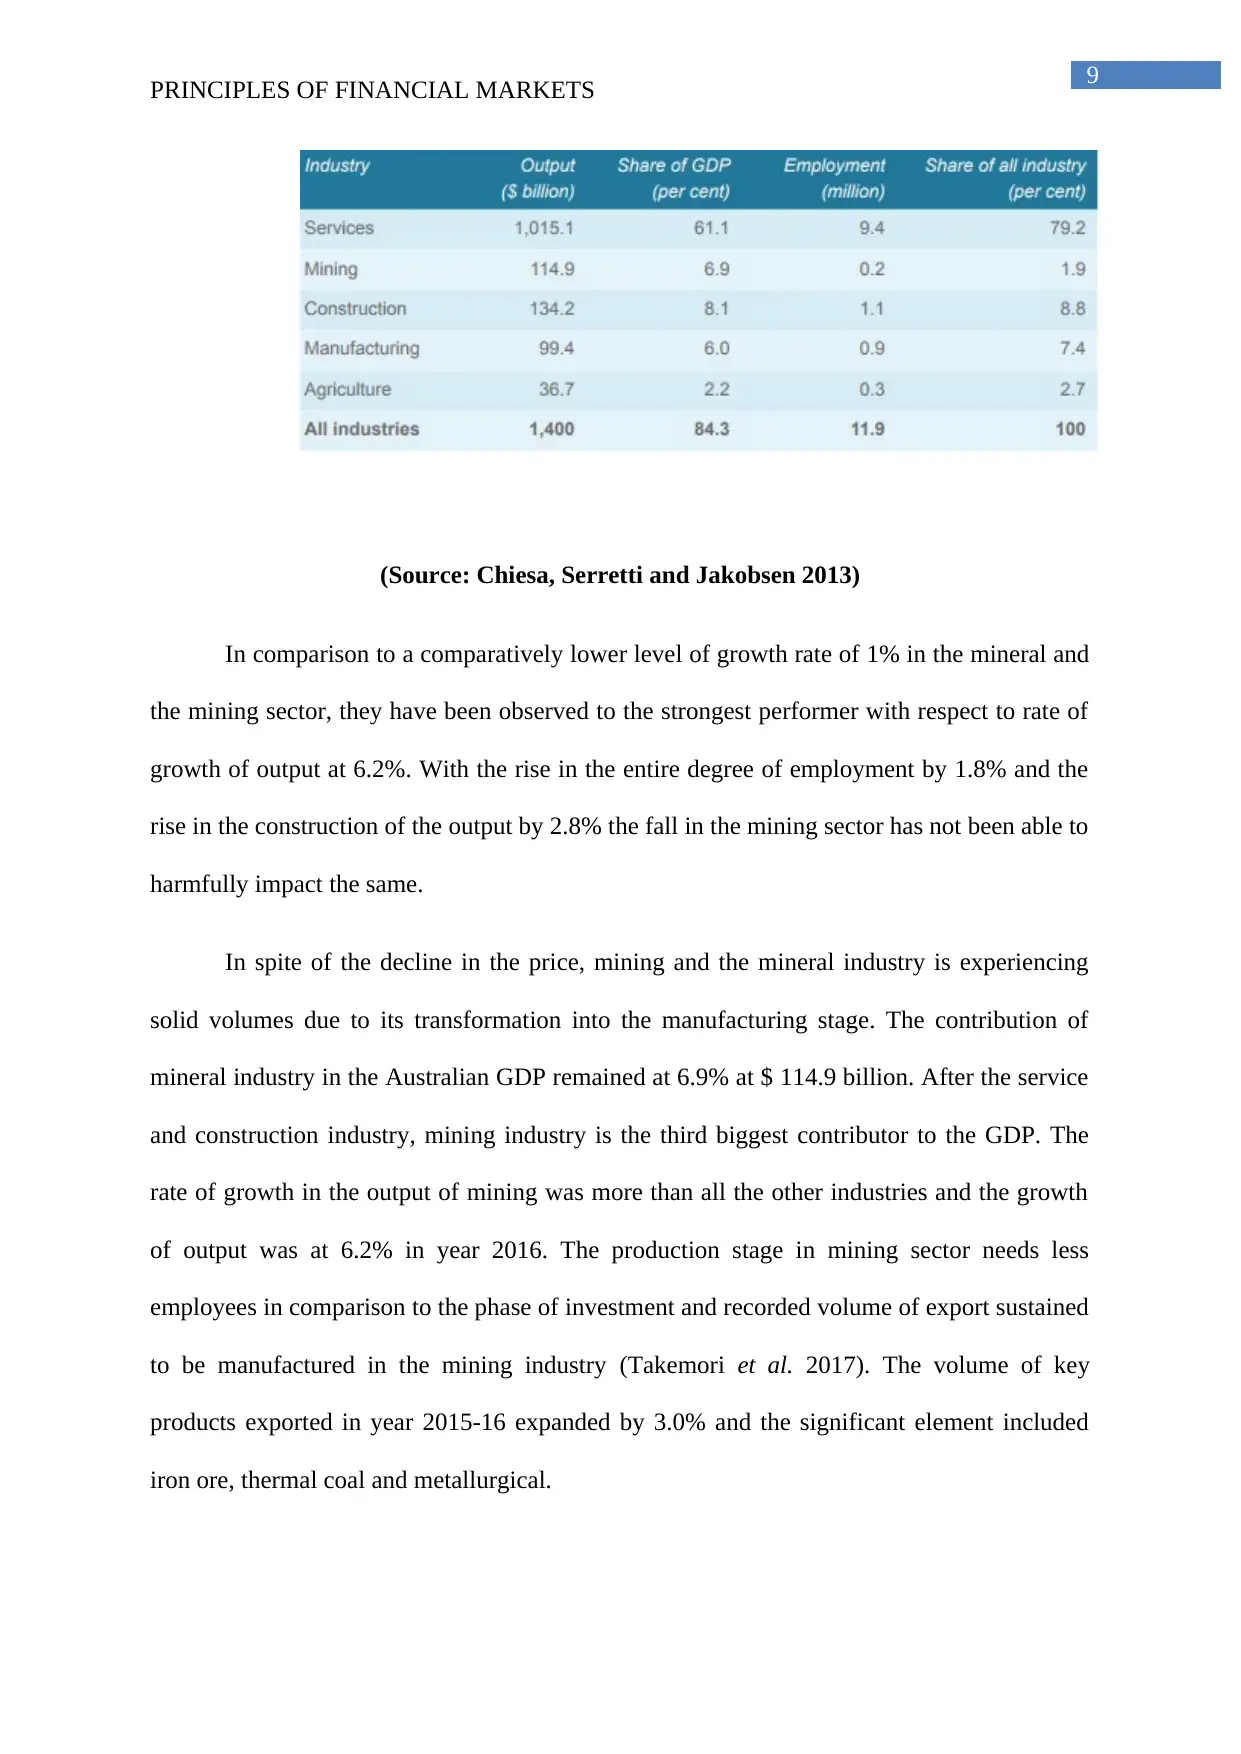
(Source: Chiesa, Serretti and Jakobsen 2013)
In comparison to a comparatively lower level of growth rate of 1% in the mineral and
the mining sector, they have been observed to the strongest performer with respect to rate of
growth of output at 6.2%. With the rise in the entire degree of employment by 1.8% and the
rise in the construction of the output by 2.8% the fall in the mining sector has not been able to
harmfully impact the same.
In spite of the decline in the price, mining and the mineral industry is experiencing
solid volumes due to its transformation into the manufacturing stage. The contribution of
mineral industry in the Australian GDP remained at 6.9% at $ 114.9 billion. After the service
and construction industry, mining industry is the third biggest contributor to the GDP. The
rate of growth in the output of mining was more than all the other industries and the growth
of output was at 6.2% in year 2016. The production stage in mining sector needs less
employees in comparison to the phase of investment and recorded volume of export sustained
to be manufactured in the mining industry (Takemori et al. 2017). The volume of key
products exported in year 2015-16 expanded by 3.0% and the significant element included
iron ore, thermal coal and metallurgical.
PRINCIPLES OF FINANCIAL MARKETS
(Source: Chiesa, Serretti and Jakobsen 2013)
In comparison to a comparatively lower level of growth rate of 1% in the mineral and
the mining sector, they have been observed to the strongest performer with respect to rate of
growth of output at 6.2%. With the rise in the entire degree of employment by 1.8% and the
rise in the construction of the output by 2.8% the fall in the mining sector has not been able to
harmfully impact the same.
In spite of the decline in the price, mining and the mineral industry is experiencing
solid volumes due to its transformation into the manufacturing stage. The contribution of
mineral industry in the Australian GDP remained at 6.9% at $ 114.9 billion. After the service
and construction industry, mining industry is the third biggest contributor to the GDP. The
rate of growth in the output of mining was more than all the other industries and the growth
of output was at 6.2% in year 2016. The production stage in mining sector needs less
employees in comparison to the phase of investment and recorded volume of export sustained
to be manufactured in the mining industry (Takemori et al. 2017). The volume of key
products exported in year 2015-16 expanded by 3.0% and the significant element included
iron ore, thermal coal and metallurgical.
Paraphrase This Document
Need a fresh take? Get an instant paraphrase of this document with our AI Paraphraser
10
PRINCIPLES OF FINANCIAL MARKETS
With respect to the top down analysis, the assessment of the specific companies has
been the final step. With the rise in the level of GDP of Australia, it has been perceived that
there exists a positive effect on the performance level of Oz Mineral and Azure Mineral. The
companies would be able to raise their capitalization of the market of there is a fall in the rate
of unemployment and rise in the GDP of the economy (Wigman et al. 2015). Azure Minerals
has sustains to reveal a fair share of their budget for the extraction and the future performance
of the company is reliant upon the project enhancement, successful mining and sustainable
investment. The base of the asset of the company would be toughened by the strategy
undertaken by the firm and they have been seen to be the second highest extraction of the
deposit of copper globally.
Bottom up Analysis
The bottom up assessment is a mechanism that is utilised by the investors for the
evaluation of the selected companies. The incorporation of the bottom up analysis of the
companies is done by implementing the method of Industry, Economy and Company
(Laundré et al. 2014). In order to undertake the evaluation, the investors who are looking for
investments in any company include the evaluation of the operations of the company and the
sector in which they are functioning and the economy where they function. Hence, for
undertaking the bottom up analysis, the investors need to assess the performance of the
companies chosen in the mineral industry, which is Oz Mineral and Azure Mineral who are
ASX listed organizations.
The application of the equipments would aid the investors in explaining the financial
requirement of the companies. For the assessment of the performance with respect to finance,
numerous ratios that are computed include liquidity, profitability, growth and efficiency
ratios (Menniti et al. 2017). Additionally, the use of this mechanism would even assist in
11
PRINCIPLES OF FINANCIAL MARKETS
undertaking a comparison of the performance of the selected companies and undertaking the
comparison with respect to the standard of the industry.
Evaluation of the profitability condition of the chosen organization
The profitability situation of firms can be assessed by computing ratio of profitability
and explains the capacity of company to create revenue. This specific ratio is utilized by
financial investors of the firm for judging the earnings that will be created on their
investments. Some of the key profitability ratio that has been computed are gross profit ratio,
operating margin ratio and the dividend payout ratio.
The change of percentage in the operating income over the revenue of sales is
replicated by operating ratio. It is the value of profit that is created by the organization after
paying out all the primary expenditures.
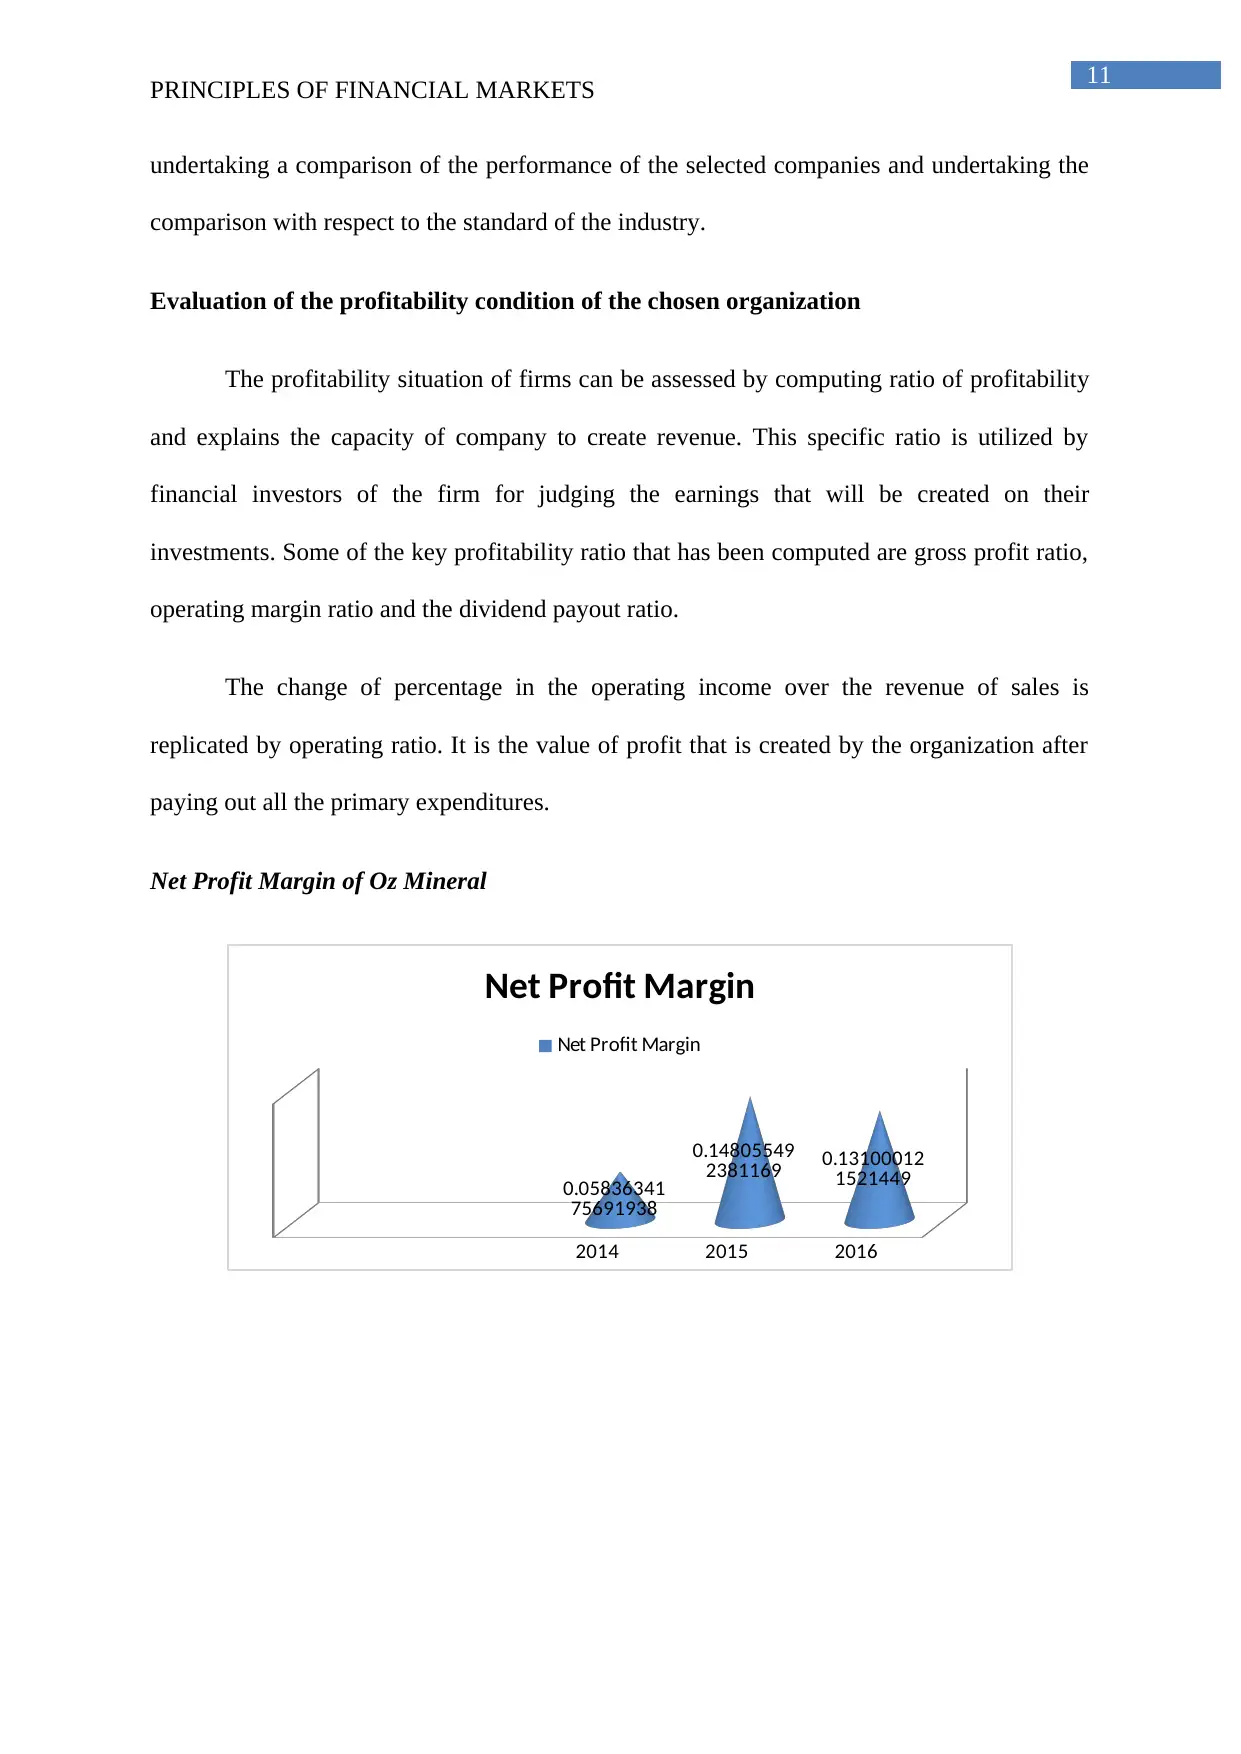
Net Profit Margin of Oz Mineral
2014 2015 2016
0.05836341
75691938
0.14805549
2381169 0.13100012
1521449
Net Profit Margin
Net Profit Margin
PRINCIPLES OF FINANCIAL MARKETS
undertaking a comparison of the performance of the selected companies and undertaking the
comparison with respect to the standard of the industry.
Evaluation of the profitability condition of the chosen organization
The profitability situation of firms can be assessed by computing ratio of profitability
and explains the capacity of company to create revenue. This specific ratio is utilized by
financial investors of the firm for judging the earnings that will be created on their
investments. Some of the key profitability ratio that has been computed are gross profit ratio,
operating margin ratio and the dividend payout ratio.
The change of percentage in the operating income over the revenue of sales is
replicated by operating ratio. It is the value of profit that is created by the organization after
paying out all the primary expenditures.
Net Profit Margin of Oz Mineral
2014 2015 2016
0.05836341
75691938
0.14805549
2381169 0.13100012
1521449
Net Profit Margin
Net Profit Margin
⊘ This is a preview!⊘
Do you want full access?
Subscribe today to unlock all pages.
Trusted by 1+ million students worldwide
1 out of 24
Related Documents


Your All-in-One AI-Powered Toolkit for Academic Success.
+13062052269
info@desklib.com
Available 24*7 on WhatsApp / Email
![[object Object]](/_next/static/media/star-bottom.7253800d.svg)
Unlock your academic potential
Copyright © 2020–2026 A2Z Services. All Rights Reserved. Developed and managed by ZUCOL.