FM&BS Coursework: Business Studies Analysis and Report
VerifiedAdded on 2023/06/10
|17
|3606
|182
Report
AI Summary
This report presents a comprehensive analysis of a business studies assignment, addressing various financial and statistical concepts. The report begins with calculations related to loan repayments, considering different interest rate scenarios and monthly payment constraints. It then delves into linear programming using Excel Solver to optimize production and maximize profit for a microwave manufacturing company, exploring the impact of demand and machine hour limitations. The analysis further extends to statistical modeling, including regression analysis of exam grades based on study hours, evaluating the significance of different factors and constructing models for different study hour ranges. Finally, the report examines Economic Order Quantity (EOQ) calculations, assessing the impact of changes in various factors like annual demand, carrying costs, and ordering costs. The report provides detailed calculations, interpretations, and recommendations throughout, demonstrating a strong understanding of financial mathematics and business statistics principles.
Running head: BUSINESS STUDIES
Business Studies
Name of Student:
Name of University:
Author’s Note:
Business Studies
Name of Student:
Name of University:
Author’s Note:
Paraphrase This Document
Need a fresh take? Get an instant paraphrase of this document with our AI Paraphraser
1BUSINESS STUDIES
Table of Contents
Question 1........................................................................................................................................2
Question 2........................................................................................................................................3
Question 3........................................................................................................................................4
Question 4........................................................................................................................................7
Question 5......................................................................................................................................10
Reference.......................................................................................................................................14
2BUSINESS STUDIES
Question 1
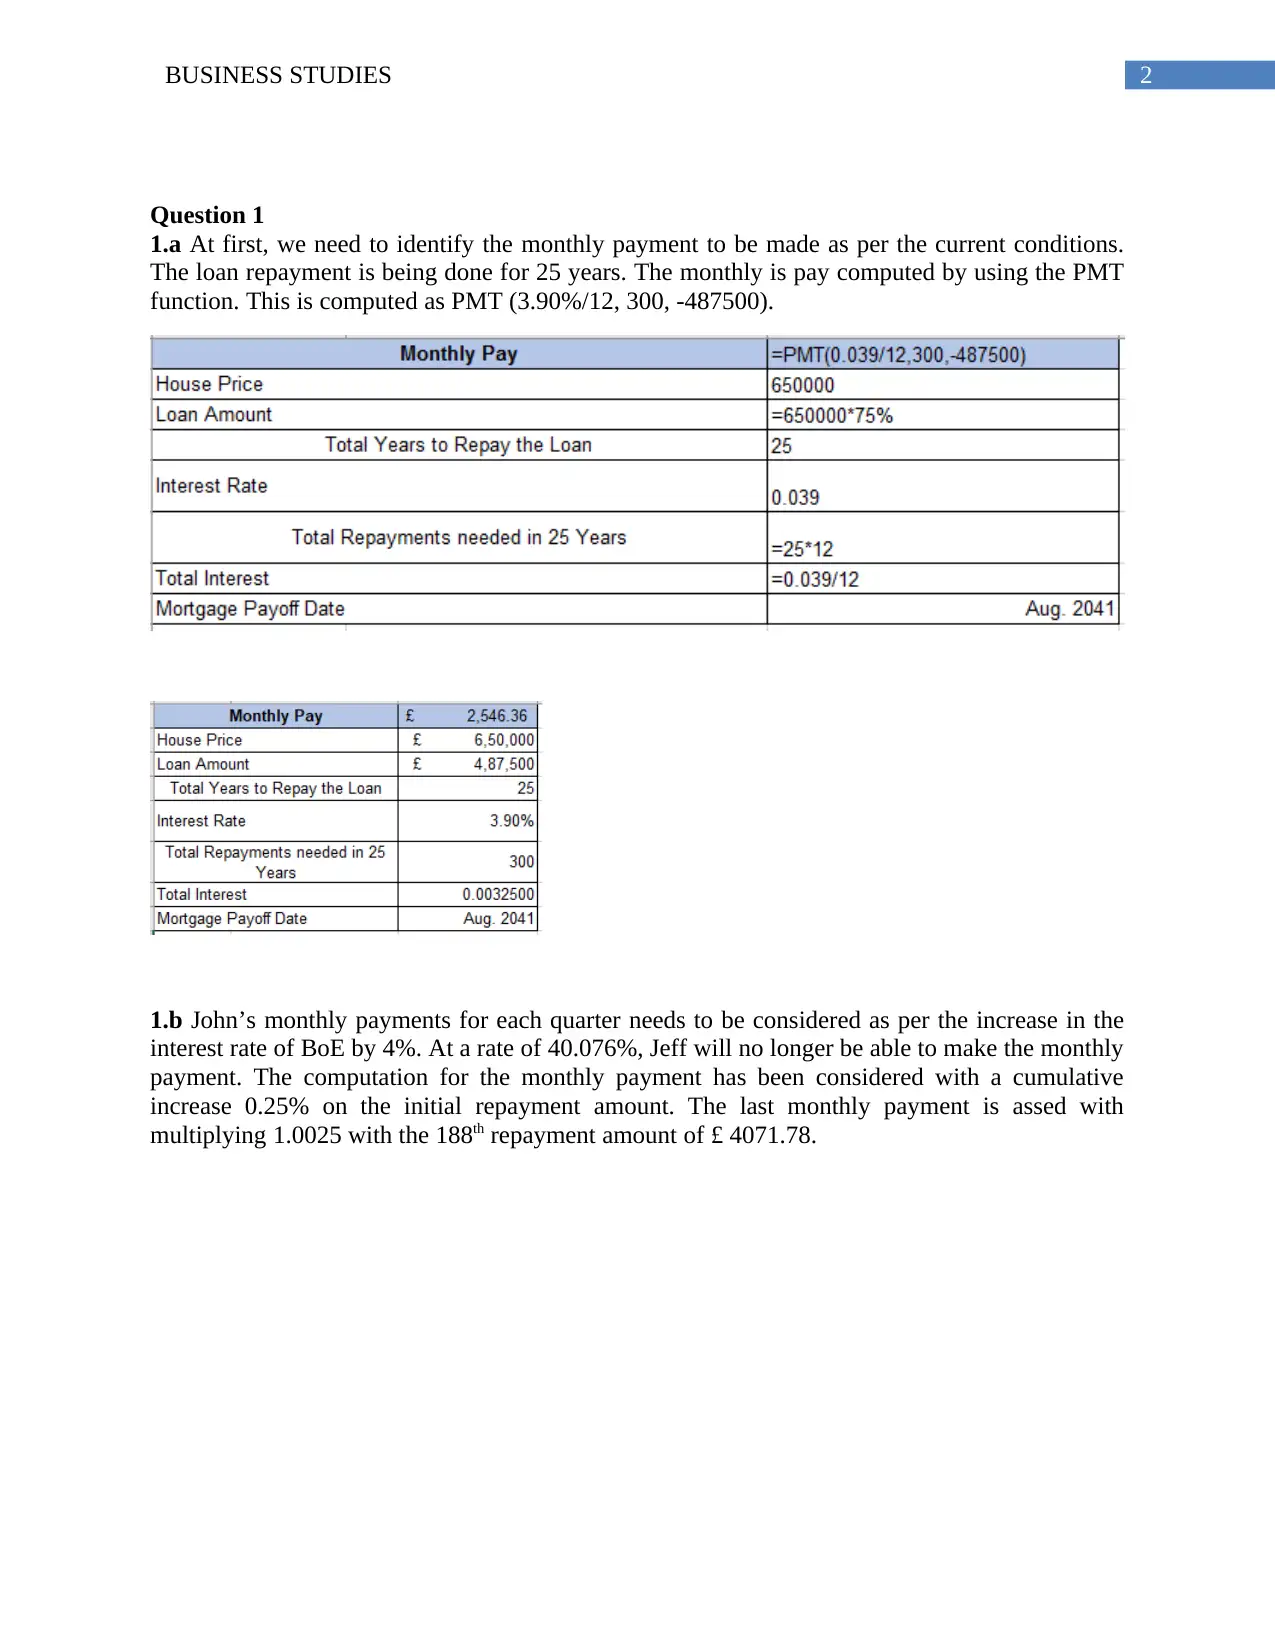
1.a At first, we need to identify the monthly payment to be made as per the current conditions.
The loan repayment is being done for 25 years. The monthly is pay computed by using the PMT
function. This is computed as PMT (3.90%/12, 300, -487500).
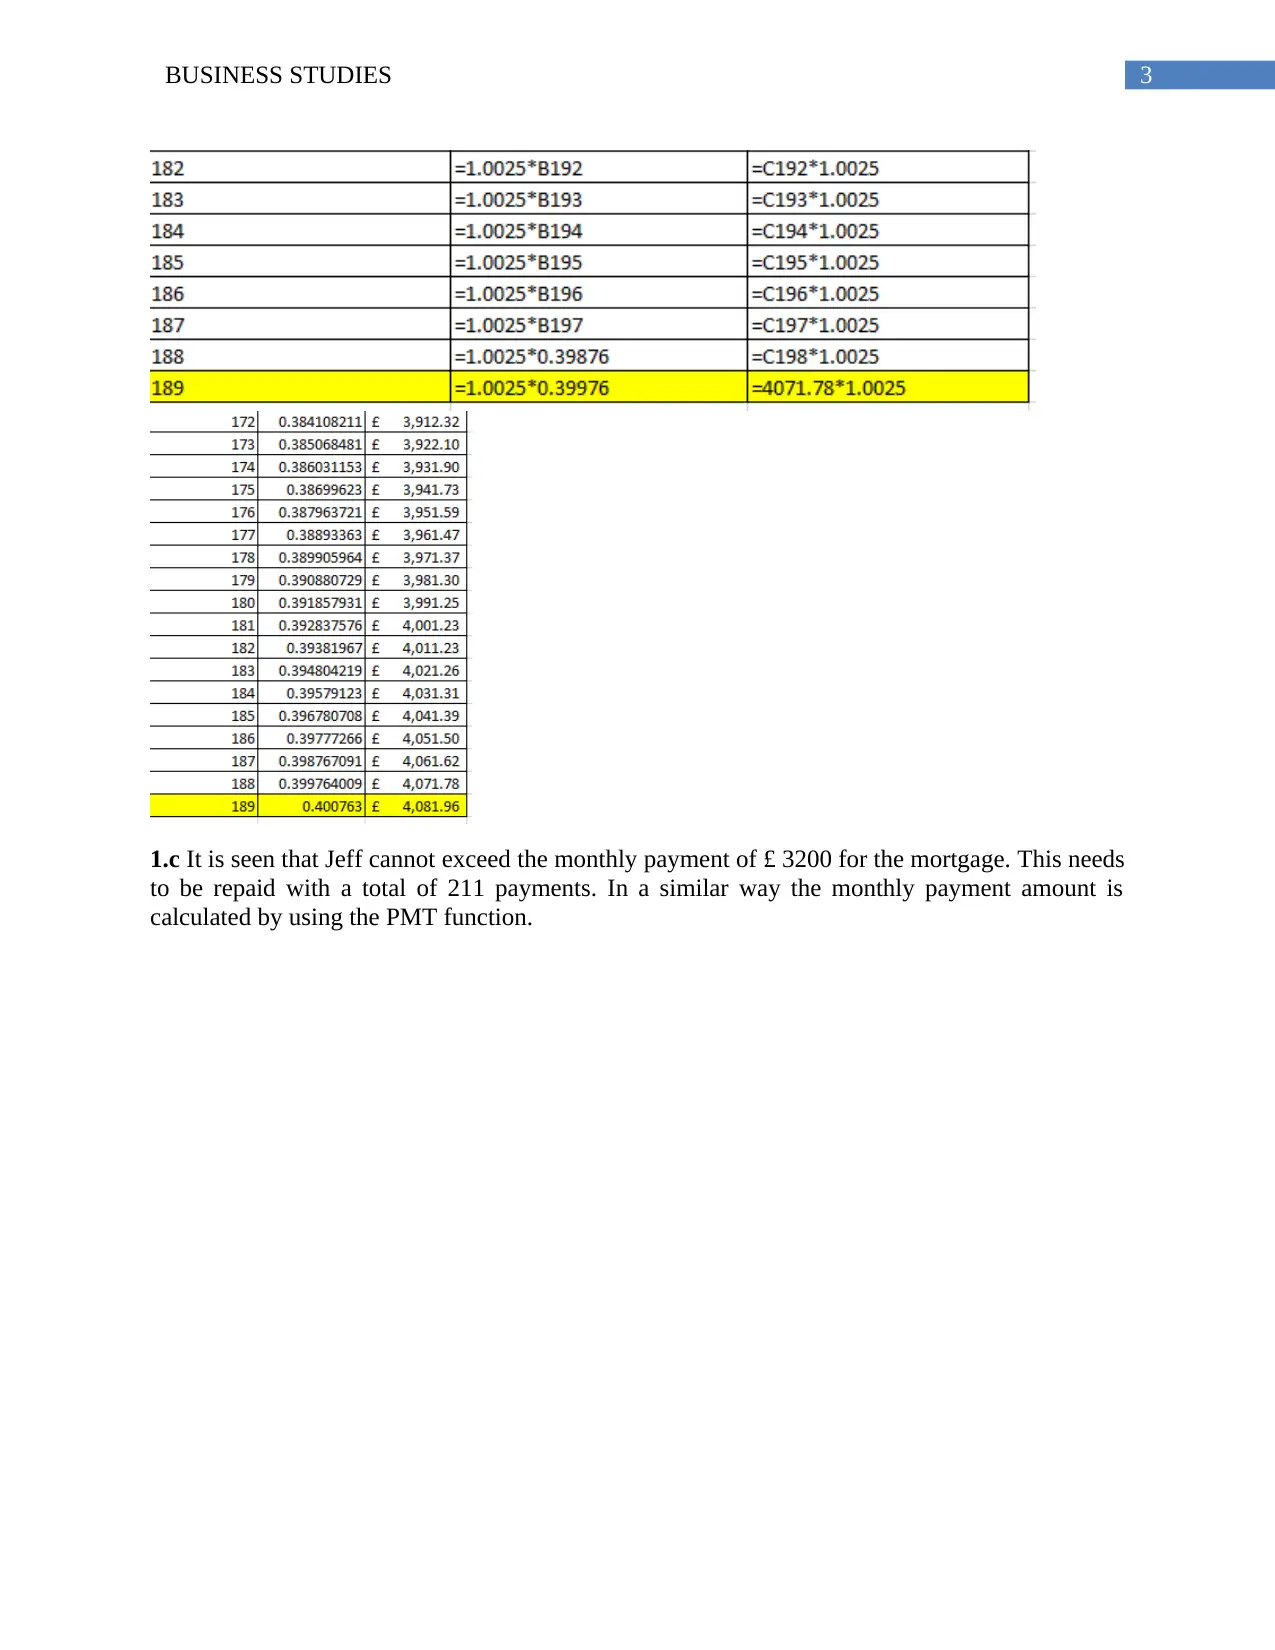
1.b John’s monthly payments for each quarter needs to be considered as per the increase in the
interest rate of BoE by 4%. At a rate of 40.076%, Jeff will no longer be able to make the monthly
payment. The computation for the monthly payment has been considered with a cumulative
increase 0.25% on the initial repayment amount. The last monthly payment is assed with
multiplying 1.0025 with the 188th repayment amount of £ 4071.78.
Question 1
1.a At first, we need to identify the monthly payment to be made as per the current conditions.
The loan repayment is being done for 25 years. The monthly is pay computed by using the PMT
function. This is computed as PMT (3.90%/12, 300, -487500).
1.b John’s monthly payments for each quarter needs to be considered as per the increase in the
interest rate of BoE by 4%. At a rate of 40.076%, Jeff will no longer be able to make the monthly
payment. The computation for the monthly payment has been considered with a cumulative
increase 0.25% on the initial repayment amount. The last monthly payment is assed with
multiplying 1.0025 with the 188th repayment amount of £ 4071.78.
⊘ This is a preview!⊘
Do you want full access?
Subscribe today to unlock all pages.
Trusted by 1+ million students worldwide
3BUSINESS STUDIES
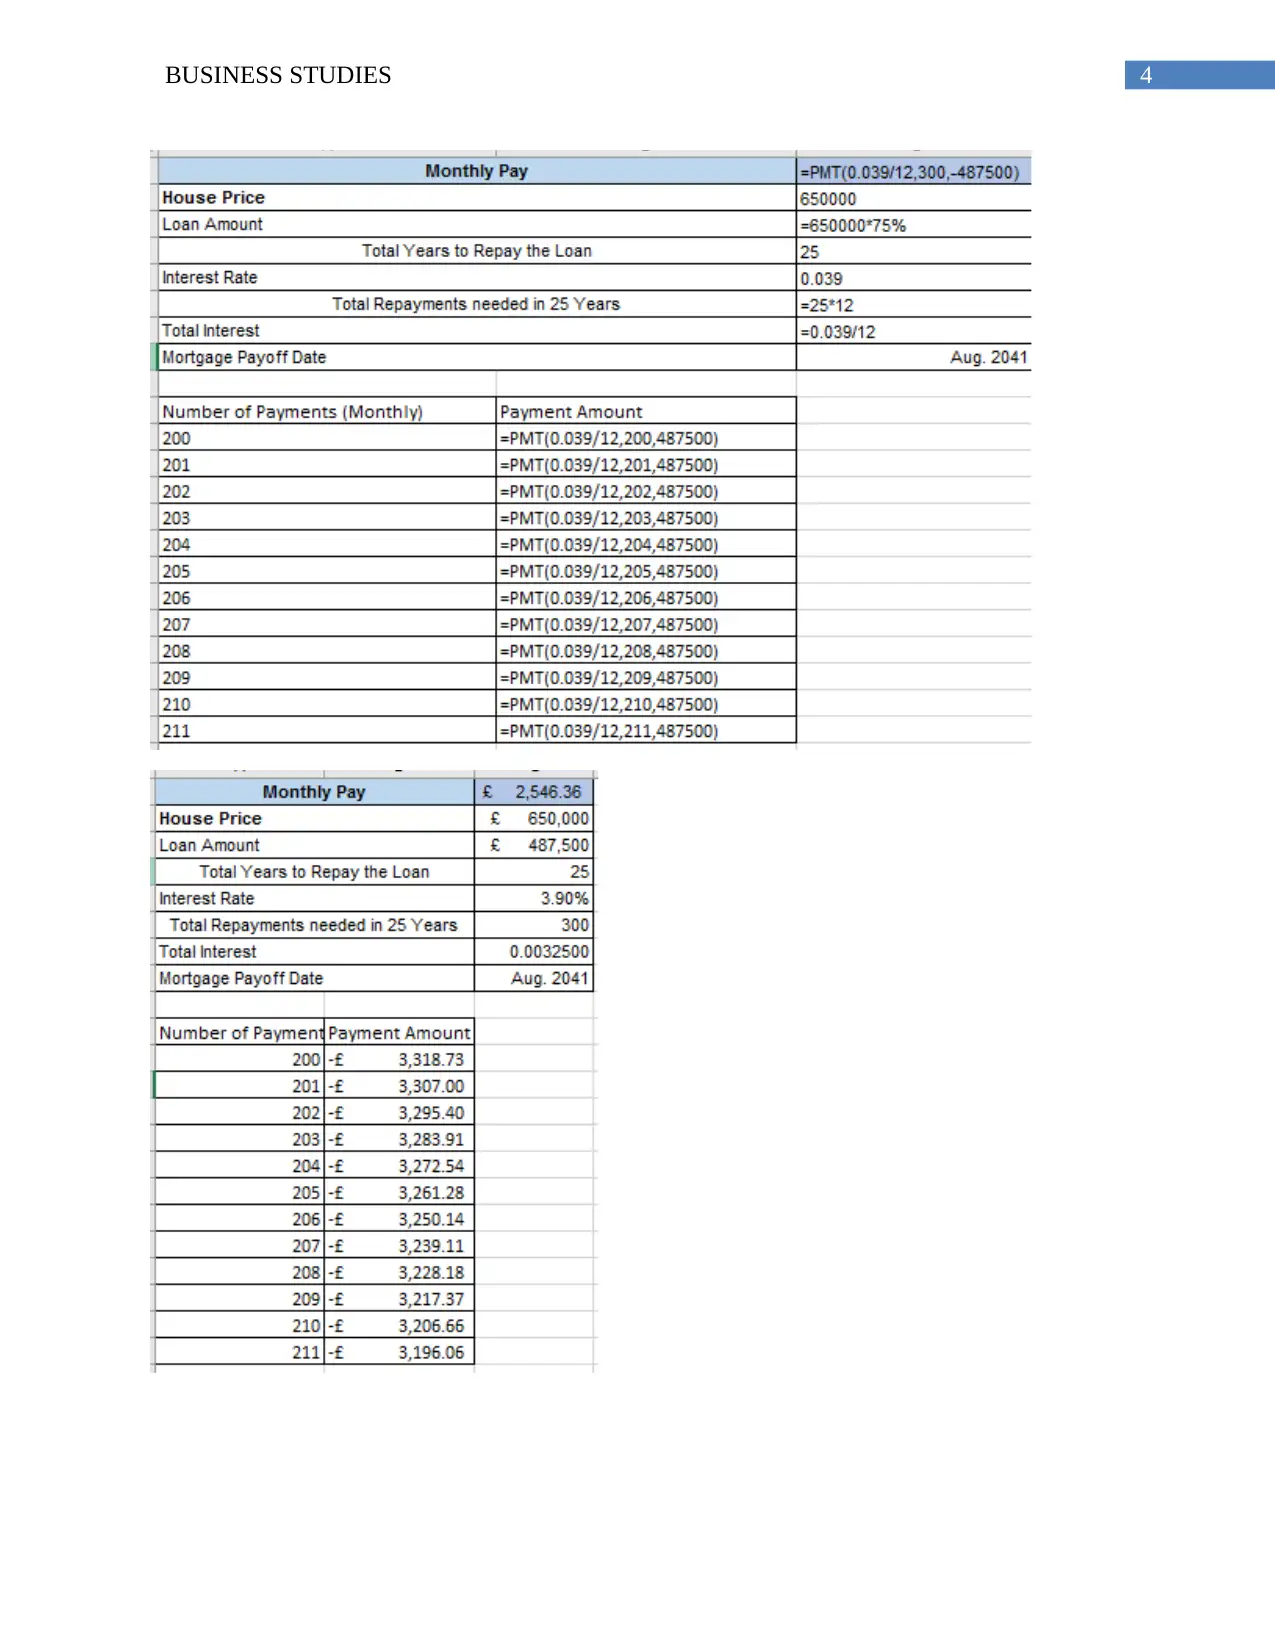
1.c It is seen that Jeff cannot exceed the monthly payment of £ 3200 for the mortgage. This needs
to be repaid with a total of 211 payments. In a similar way the monthly payment amount is
calculated by using the PMT function.
1.c It is seen that Jeff cannot exceed the monthly payment of £ 3200 for the mortgage. This needs
to be repaid with a total of 211 payments. In a similar way the monthly payment amount is
calculated by using the PMT function.
Paraphrase This Document
Need a fresh take? Get an instant paraphrase of this document with our AI Paraphraser
4BUSINESS STUDIES
5BUSINESS STUDIES
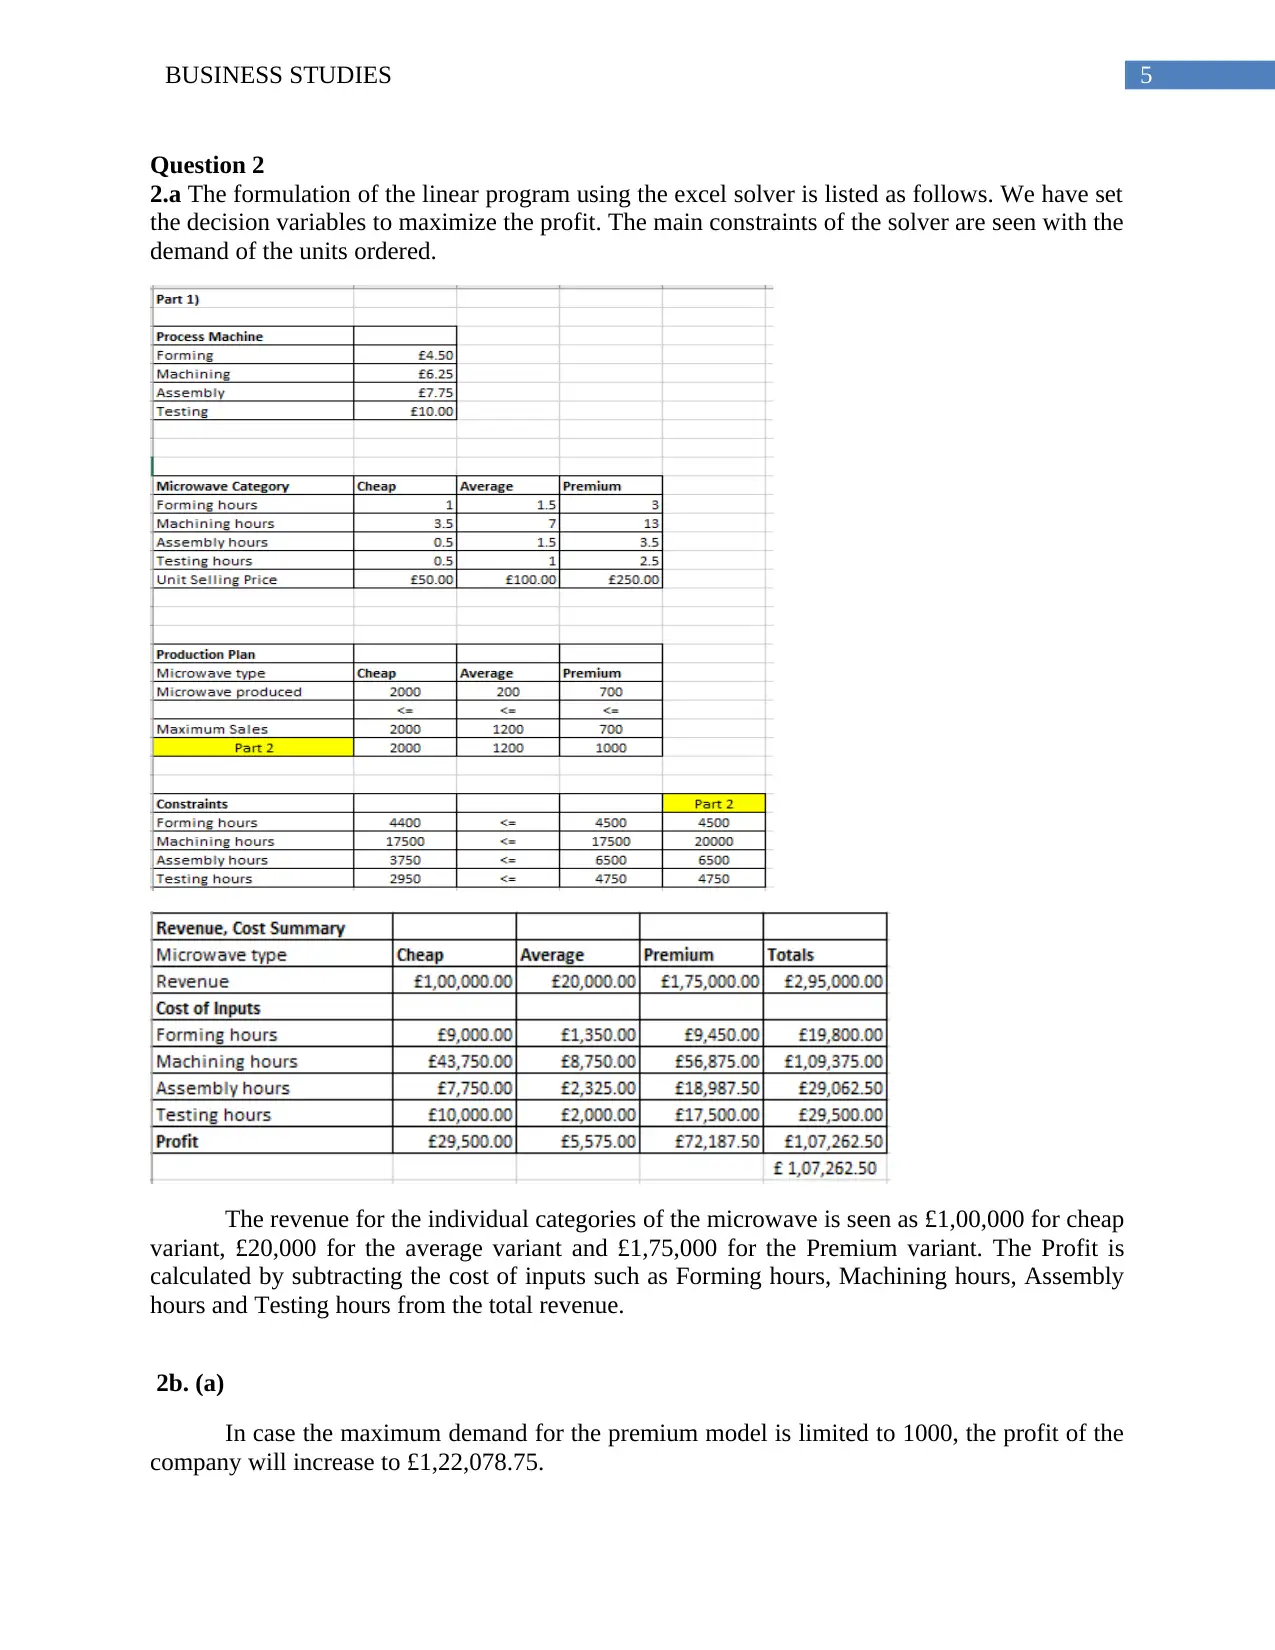
Question 2
2.a The formulation of the linear program using the excel solver is listed as follows. We have set
the decision variables to maximize the profit. The main constraints of the solver are seen with the
demand of the units ordered.
The revenue for the individual categories of the microwave is seen as £1,00,000 for cheap
variant, £20,000 for the average variant and £1,75,000 for the Premium variant. The Profit is
calculated by subtracting the cost of inputs such as Forming hours, Machining hours, Assembly
hours and Testing hours from the total revenue.
2b. (a)
In case the maximum demand for the premium model is limited to 1000, the profit of the
company will increase to £1,22,078.75.
⊘ This is a preview!⊘
Do you want full access?
Subscribe today to unlock all pages.
Trusted by 1+ million students worldwide
6BUSINESS STUDIES
2b. (b)
In case the maximum available machine hours is 20000, the production hours will reduce.
However, this will have a positive impact on the profit. The profit will increase from
£1,07,262.50 to £1,14,487.50 in this case.
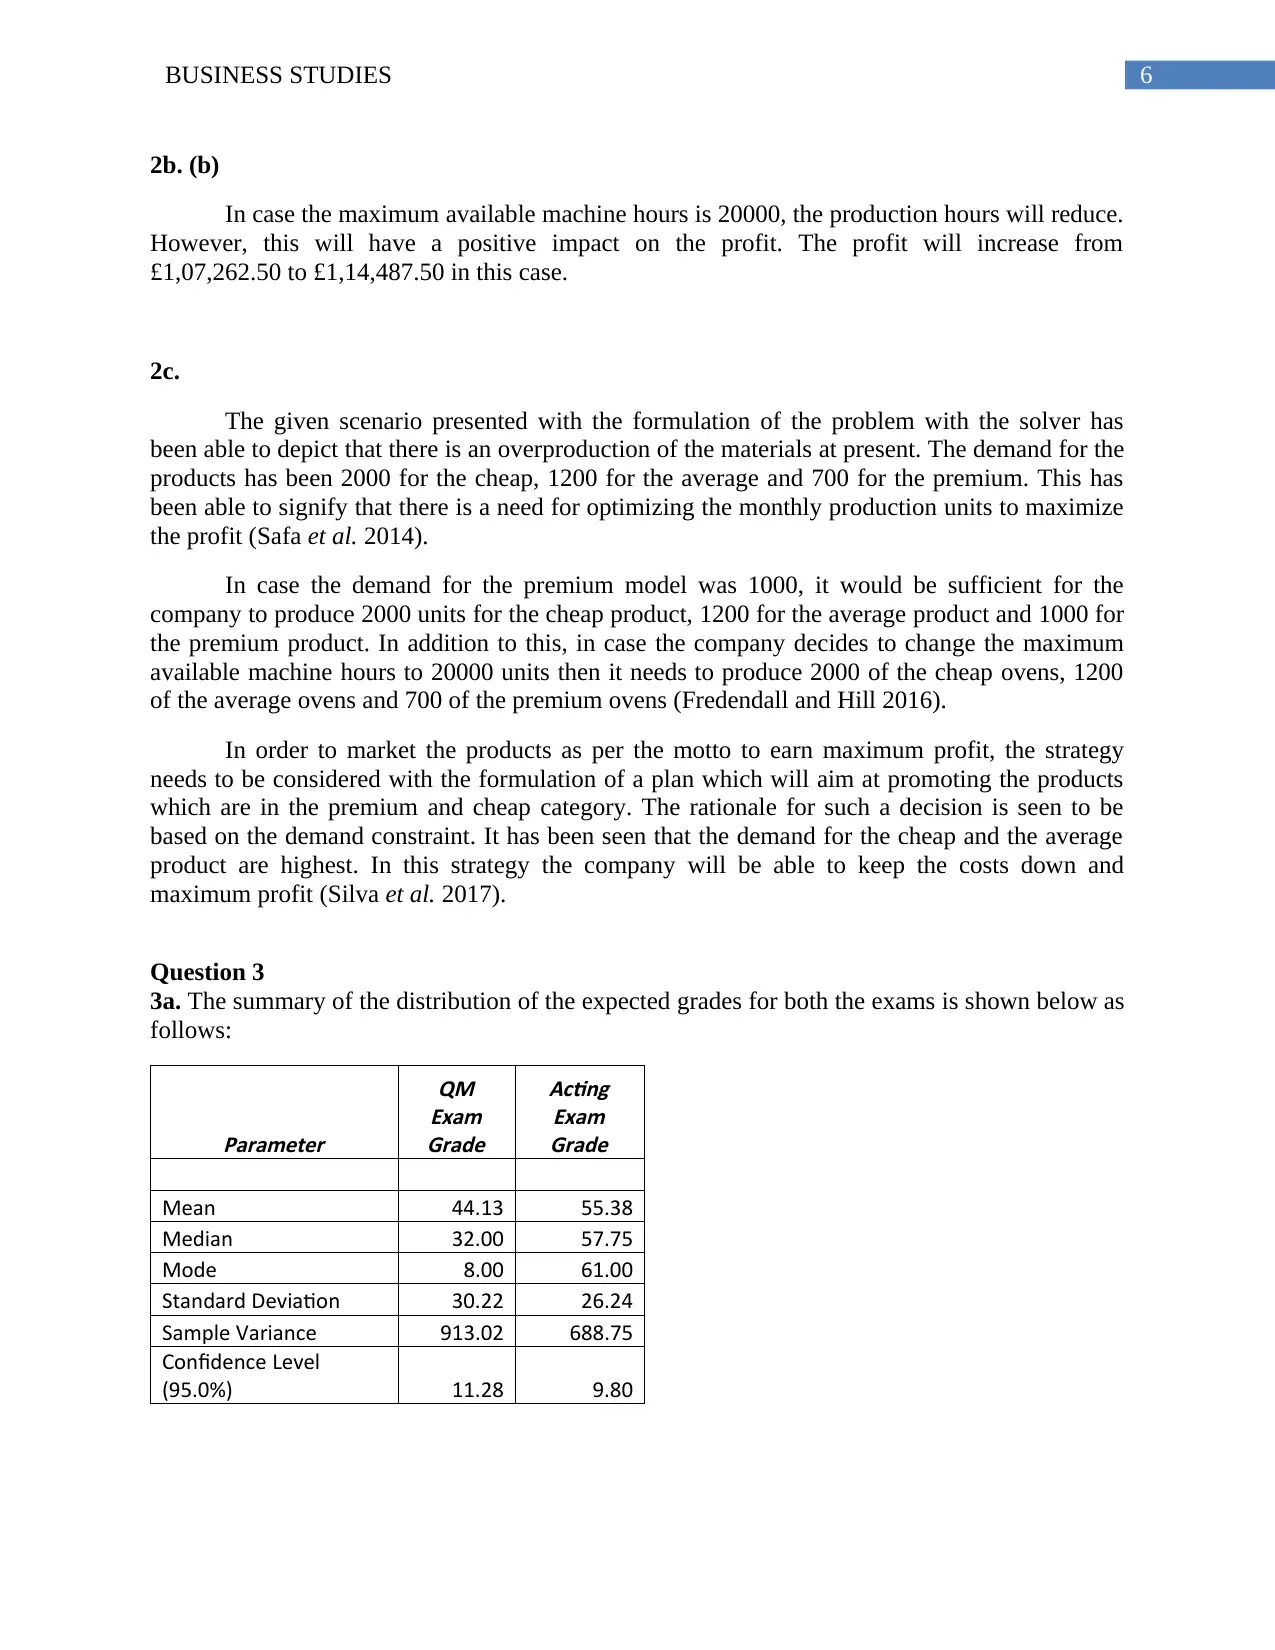
2c.
The given scenario presented with the formulation of the problem with the solver has
been able to depict that there is an overproduction of the materials at present. The demand for the
products has been 2000 for the cheap, 1200 for the average and 700 for the premium. This has
been able to signify that there is a need for optimizing the monthly production units to maximize
the profit (Safa et al. 2014).
In case the demand for the premium model was 1000, it would be sufficient for the
company to produce 2000 units for the cheap product, 1200 for the average product and 1000 for
the premium product. In addition to this, in case the company decides to change the maximum
available machine hours to 20000 units then it needs to produce 2000 of the cheap ovens, 1200
of the average ovens and 700 of the premium ovens (Fredendall and Hill 2016).
In order to market the products as per the motto to earn maximum profit, the strategy
needs to be considered with the formulation of a plan which will aim at promoting the products
which are in the premium and cheap category. The rationale for such a decision is seen to be
based on the demand constraint. It has been seen that the demand for the cheap and the average
product are highest. In this strategy the company will be able to keep the costs down and
maximum profit (Silva et al. 2017).
Question 3
3a. The summary of the distribution of the expected grades for both the exams is shown below as
follows:
Parameter
QM
Exam
Grade
Acting
Exam
Grade
Mean 44.13 55.38
Median 32.00 57.75
Mode 8.00 61.00
Standard Deviation 30.22 26.24
Sample Variance 913.02 688.75
Confidence Level
(95.0%) 11.28 9.80
2b. (b)
In case the maximum available machine hours is 20000, the production hours will reduce.
However, this will have a positive impact on the profit. The profit will increase from
£1,07,262.50 to £1,14,487.50 in this case.
2c.
The given scenario presented with the formulation of the problem with the solver has
been able to depict that there is an overproduction of the materials at present. The demand for the
products has been 2000 for the cheap, 1200 for the average and 700 for the premium. This has
been able to signify that there is a need for optimizing the monthly production units to maximize
the profit (Safa et al. 2014).
In case the demand for the premium model was 1000, it would be sufficient for the
company to produce 2000 units for the cheap product, 1200 for the average product and 1000 for
the premium product. In addition to this, in case the company decides to change the maximum
available machine hours to 20000 units then it needs to produce 2000 of the cheap ovens, 1200
of the average ovens and 700 of the premium ovens (Fredendall and Hill 2016).
In order to market the products as per the motto to earn maximum profit, the strategy
needs to be considered with the formulation of a plan which will aim at promoting the products
which are in the premium and cheap category. The rationale for such a decision is seen to be
based on the demand constraint. It has been seen that the demand for the cheap and the average
product are highest. In this strategy the company will be able to keep the costs down and
maximum profit (Silva et al. 2017).
Question 3
3a. The summary of the distribution of the expected grades for both the exams is shown below as
follows:
Parameter
QM
Exam
Grade
Acting
Exam
Grade
Mean 44.13 55.38
Median 32.00 57.75
Mode 8.00 61.00
Standard Deviation 30.22 26.24
Sample Variance 913.02 688.75
Confidence Level
(95.0%) 11.28 9.80
Paraphrase This Document
Need a fresh take? Get an instant paraphrase of this document with our AI Paraphraser
7BUSINESS STUDIES
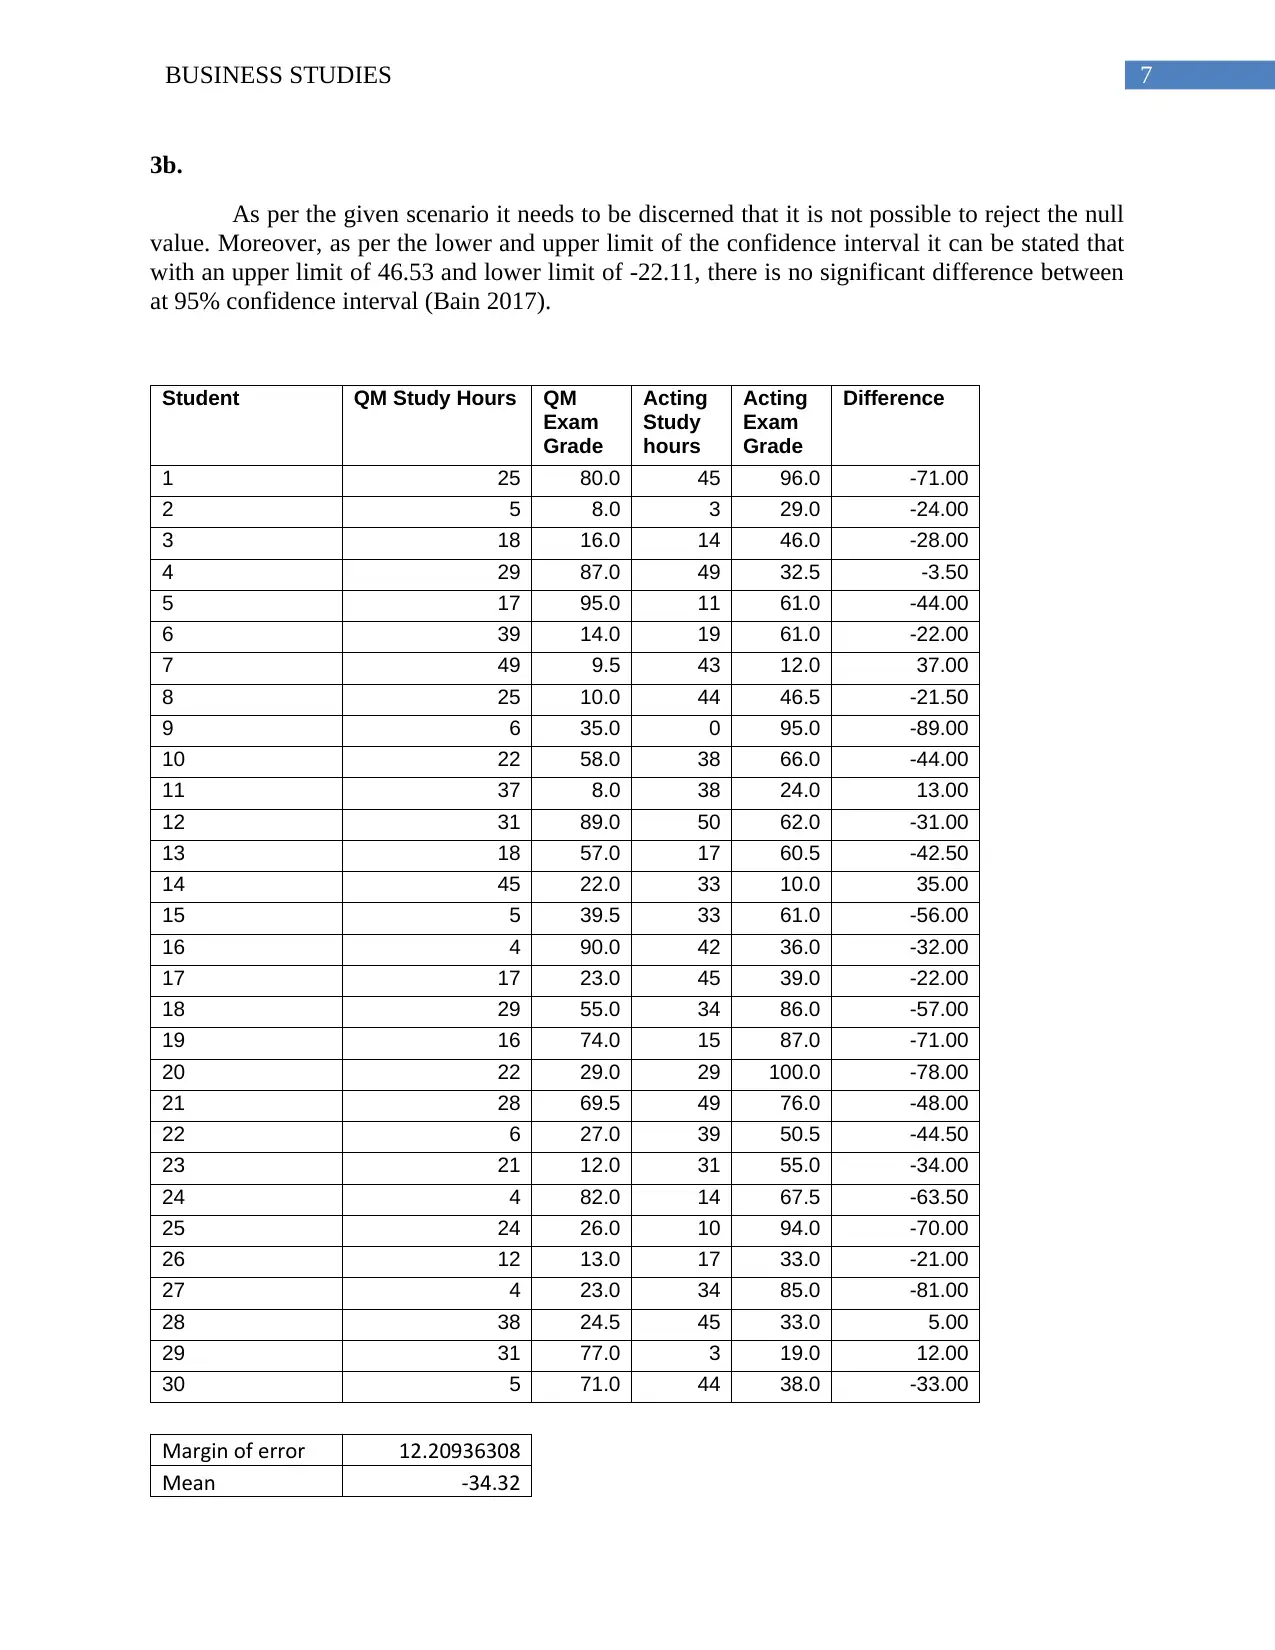
3b.
As per the given scenario it needs to be discerned that it is not possible to reject the null
value. Moreover, as per the lower and upper limit of the confidence interval it can be stated that
with an upper limit of 46.53 and lower limit of -22.11, there is no significant difference between
at 95% confidence interval (Bain 2017).
Student QM Study Hours QM
Exam
Grade
Acting
Study
hours
Acting
Exam
Grade
Difference
1 25 80.0 45 96.0 -71.00
2 5 8.0 3 29.0 -24.00
3 18 16.0 14 46.0 -28.00
4 29 87.0 49 32.5 -3.50
5 17 95.0 11 61.0 -44.00
6 39 14.0 19 61.0 -22.00
7 49 9.5 43 12.0 37.00
8 25 10.0 44 46.5 -21.50
9 6 35.0 0 95.0 -89.00
10 22 58.0 38 66.0 -44.00
11 37 8.0 38 24.0 13.00
12 31 89.0 50 62.0 -31.00
13 18 57.0 17 60.5 -42.50
14 45 22.0 33 10.0 35.00
15 5 39.5 33 61.0 -56.00
16 4 90.0 42 36.0 -32.00
17 17 23.0 45 39.0 -22.00
18 29 55.0 34 86.0 -57.00
19 16 74.0 15 87.0 -71.00
20 22 29.0 29 100.0 -78.00
21 28 69.5 49 76.0 -48.00
22 6 27.0 39 50.5 -44.50
23 21 12.0 31 55.0 -34.00
24 4 82.0 14 67.5 -63.50
25 24 26.0 10 94.0 -70.00
26 12 13.0 17 33.0 -21.00
27 4 23.0 34 85.0 -81.00
28 38 24.5 45 33.0 5.00
29 31 77.0 3 19.0 12.00
30 5 71.0 44 38.0 -33.00
Margin of error 12.20936308
Mean -34.32
8BUSINESS STUDIES
Lower Bound -22.11
Upper Bound 46.53
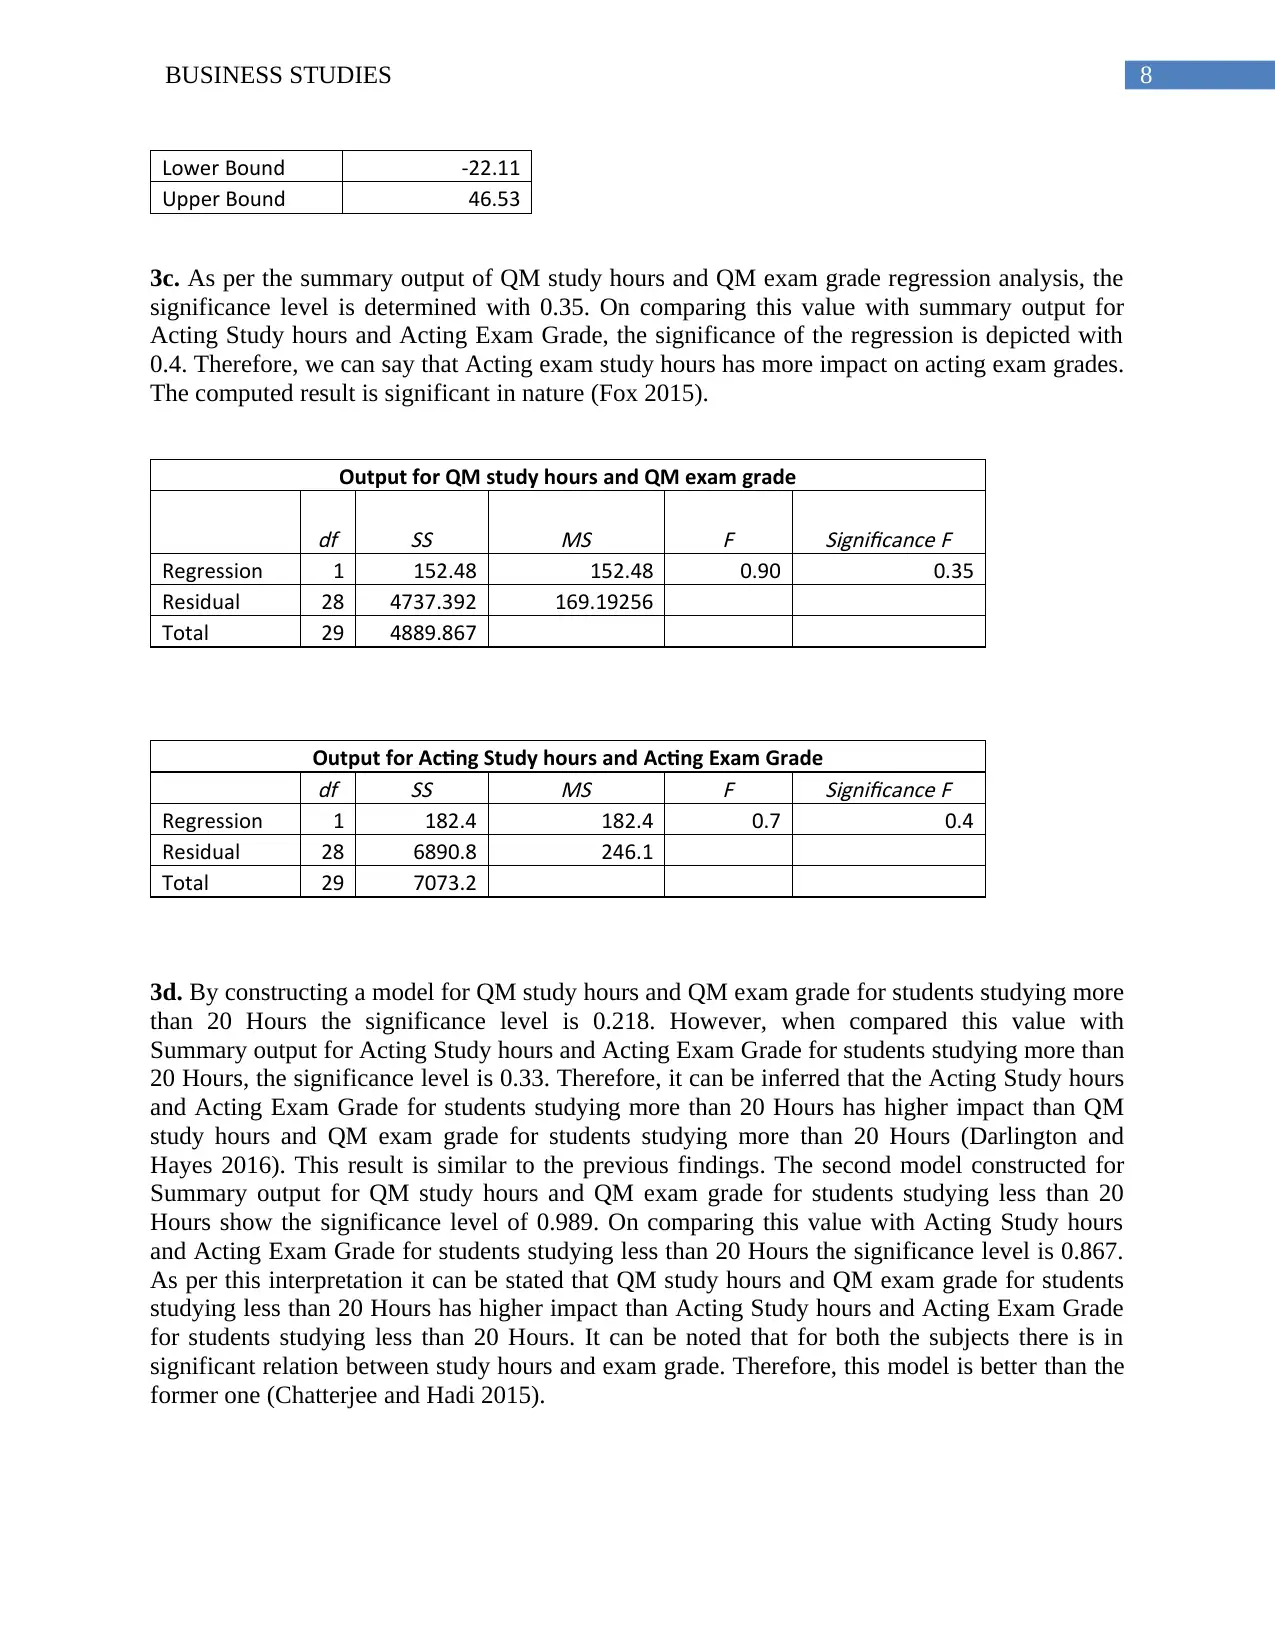
3c. As per the summary output of QM study hours and QM exam grade regression analysis, the
significance level is determined with 0.35. On comparing this value with summary output for
Acting Study hours and Acting Exam Grade, the significance of the regression is depicted with
0.4. Therefore, we can say that Acting exam study hours has more impact on acting exam grades.
The computed result is significant in nature (Fox 2015).
Output for QM study hours and QM exam grade
df SS
MS
F
Significance F
Regression 1 152.48 152.48 0.90 0.35
Residual 28 4737.392 169.19256
Total 29 4889.867
Output for Acting Study hours and Acting Exam Grade
df SS
MS
F
Significance F
Regression 1 182.4 182.4 0.7 0.4
Residual 28 6890.8 246.1
Total 29 7073.2
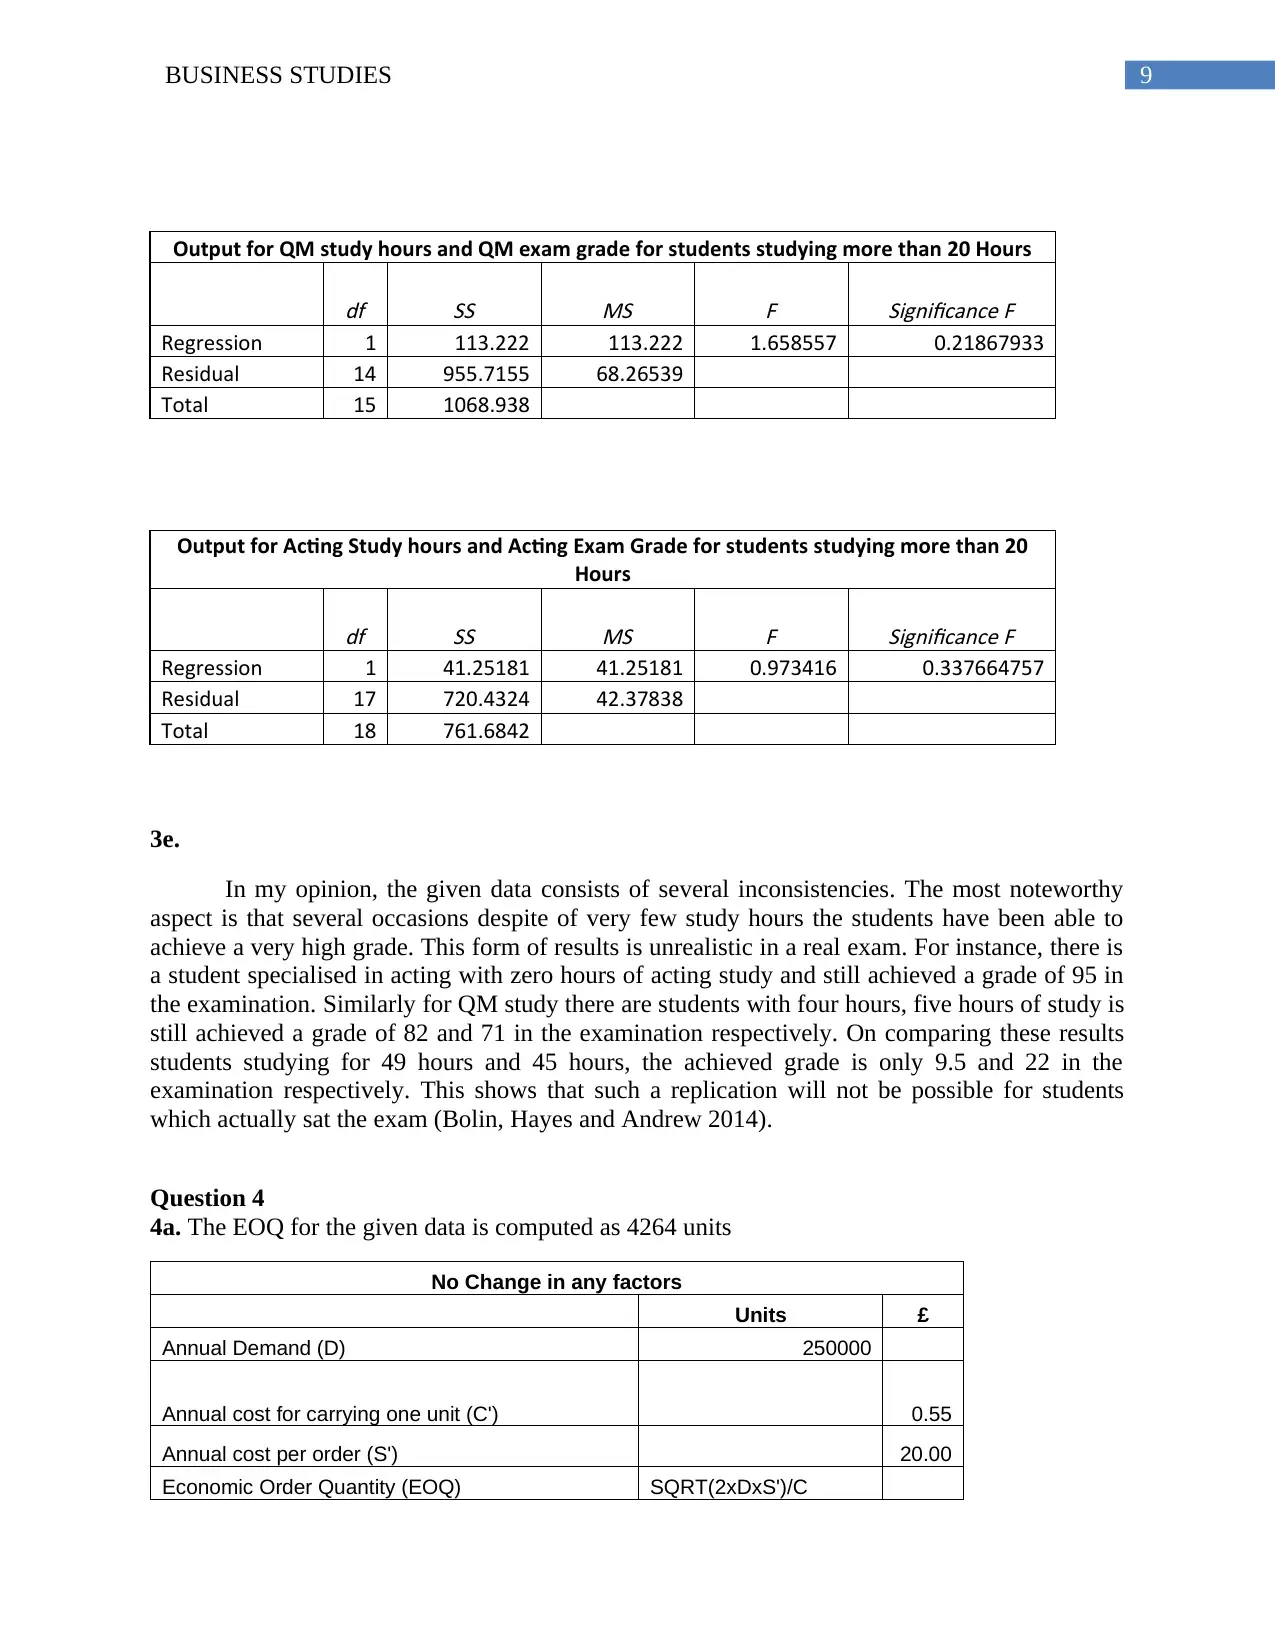
3d. By constructing a model for QM study hours and QM exam grade for students studying more
than 20 Hours the significance level is 0.218. However, when compared this value with
Summary output for Acting Study hours and Acting Exam Grade for students studying more than
20 Hours, the significance level is 0.33. Therefore, it can be inferred that the Acting Study hours
and Acting Exam Grade for students studying more than 20 Hours has higher impact than QM
study hours and QM exam grade for students studying more than 20 Hours (Darlington and
Hayes 2016). This result is similar to the previous findings. The second model constructed for
Summary output for QM study hours and QM exam grade for students studying less than 20
Hours show the significance level of 0.989. On comparing this value with Acting Study hours
and Acting Exam Grade for students studying less than 20 Hours the significance level is 0.867.
As per this interpretation it can be stated that QM study hours and QM exam grade for students
studying less than 20 Hours has higher impact than Acting Study hours and Acting Exam Grade
for students studying less than 20 Hours. It can be noted that for both the subjects there is in
significant relation between study hours and exam grade. Therefore, this model is better than the
former one (Chatterjee and Hadi 2015).
Lower Bound -22.11
Upper Bound 46.53
3c. As per the summary output of QM study hours and QM exam grade regression analysis, the
significance level is determined with 0.35. On comparing this value with summary output for
Acting Study hours and Acting Exam Grade, the significance of the regression is depicted with
0.4. Therefore, we can say that Acting exam study hours has more impact on acting exam grades.
The computed result is significant in nature (Fox 2015).
Output for QM study hours and QM exam grade
df SS
MS
F
Significance F
Regression 1 152.48 152.48 0.90 0.35
Residual 28 4737.392 169.19256
Total 29 4889.867
Output for Acting Study hours and Acting Exam Grade
df SS
MS
F
Significance F
Regression 1 182.4 182.4 0.7 0.4
Residual 28 6890.8 246.1
Total 29 7073.2
3d. By constructing a model for QM study hours and QM exam grade for students studying more
than 20 Hours the significance level is 0.218. However, when compared this value with
Summary output for Acting Study hours and Acting Exam Grade for students studying more than
20 Hours, the significance level is 0.33. Therefore, it can be inferred that the Acting Study hours
and Acting Exam Grade for students studying more than 20 Hours has higher impact than QM
study hours and QM exam grade for students studying more than 20 Hours (Darlington and
Hayes 2016). This result is similar to the previous findings. The second model constructed for
Summary output for QM study hours and QM exam grade for students studying less than 20
Hours show the significance level of 0.989. On comparing this value with Acting Study hours
and Acting Exam Grade for students studying less than 20 Hours the significance level is 0.867.
As per this interpretation it can be stated that QM study hours and QM exam grade for students
studying less than 20 Hours has higher impact than Acting Study hours and Acting Exam Grade
for students studying less than 20 Hours. It can be noted that for both the subjects there is in
significant relation between study hours and exam grade. Therefore, this model is better than the
former one (Chatterjee and Hadi 2015).
⊘ This is a preview!⊘
Do you want full access?
Subscribe today to unlock all pages.
Trusted by 1+ million students worldwide
9BUSINESS STUDIES
Output for QM study hours and QM exam grade for students studying more than 20 Hours
df
SS
MS
F
Significance F
Regression 1 113.222 113.222 1.658557 0.21867933
Residual 14 955.7155 68.26539
Total 15 1068.938
Output for Acting Study hours and Acting Exam Grade for students studying more than 20
Hours
df
SS
MS
F
Significance F
Regression 1 41.25181 41.25181 0.973416 0.337664757
Residual 17 720.4324 42.37838
Total 18 761.6842
3e.
In my opinion, the given data consists of several inconsistencies. The most noteworthy
aspect is that several occasions despite of very few study hours the students have been able to
achieve a very high grade. This form of results is unrealistic in a real exam. For instance, there is
a student specialised in acting with zero hours of acting study and still achieved a grade of 95 in
the examination. Similarly for QM study there are students with four hours, five hours of study is
still achieved a grade of 82 and 71 in the examination respectively. On comparing these results
students studying for 49 hours and 45 hours, the achieved grade is only 9.5 and 22 in the
examination respectively. This shows that such a replication will not be possible for students
which actually sat the exam (Bolin, Hayes and Andrew 2014).
Question 4
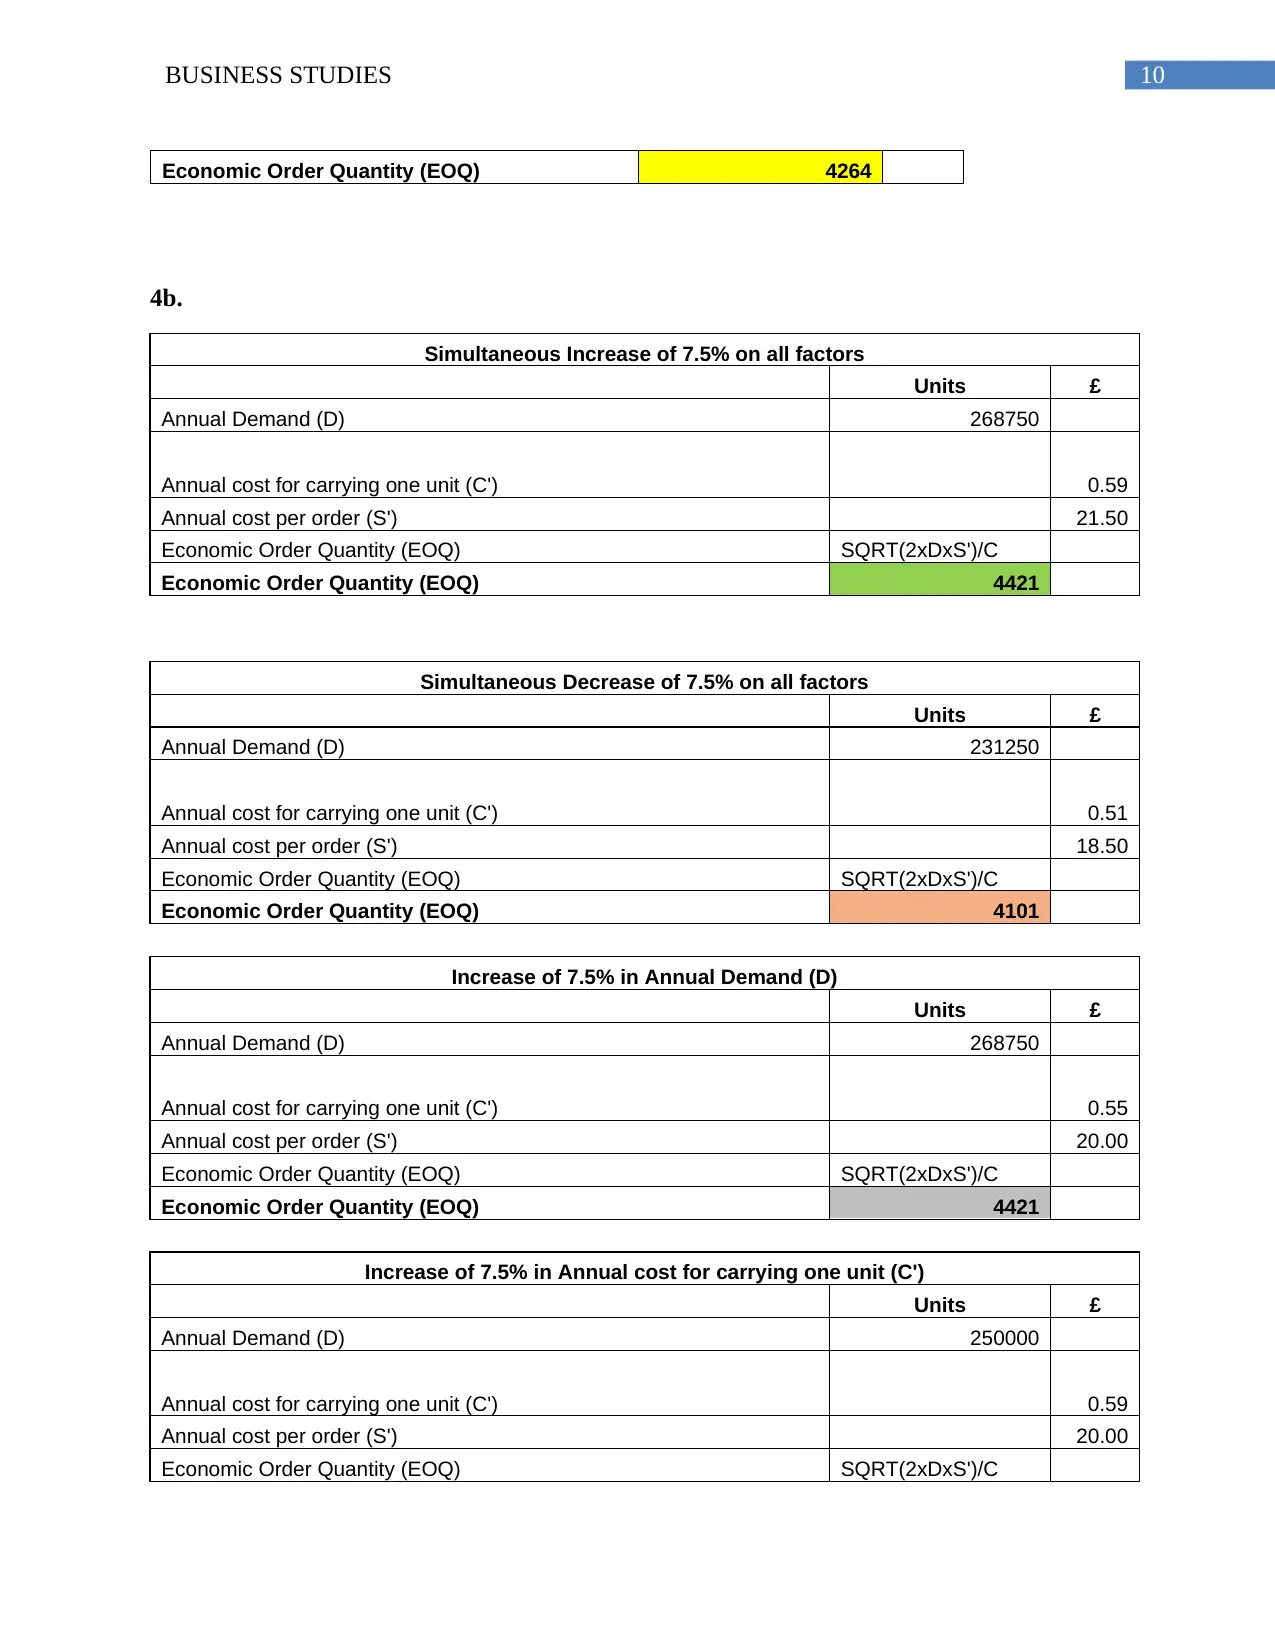
4a. The EOQ for the given data is computed as 4264 units
No Change in any factors
Units £
Annual Demand (D) 250000
Annual cost for carrying one unit (C') 0.55
Annual cost per order (S') 20.00
Economic Order Quantity (EOQ) SQRT(2xDxS')/C
Output for QM study hours and QM exam grade for students studying more than 20 Hours
df
SS
MS
F
Significance F
Regression 1 113.222 113.222 1.658557 0.21867933
Residual 14 955.7155 68.26539
Total 15 1068.938
Output for Acting Study hours and Acting Exam Grade for students studying more than 20
Hours
df
SS
MS
F
Significance F
Regression 1 41.25181 41.25181 0.973416 0.337664757
Residual 17 720.4324 42.37838
Total 18 761.6842
3e.
In my opinion, the given data consists of several inconsistencies. The most noteworthy
aspect is that several occasions despite of very few study hours the students have been able to
achieve a very high grade. This form of results is unrealistic in a real exam. For instance, there is
a student specialised in acting with zero hours of acting study and still achieved a grade of 95 in
the examination. Similarly for QM study there are students with four hours, five hours of study is
still achieved a grade of 82 and 71 in the examination respectively. On comparing these results
students studying for 49 hours and 45 hours, the achieved grade is only 9.5 and 22 in the
examination respectively. This shows that such a replication will not be possible for students
which actually sat the exam (Bolin, Hayes and Andrew 2014).
Question 4
4a. The EOQ for the given data is computed as 4264 units
No Change in any factors
Units £
Annual Demand (D) 250000
Annual cost for carrying one unit (C') 0.55
Annual cost per order (S') 20.00
Economic Order Quantity (EOQ) SQRT(2xDxS')/C
Paraphrase This Document
Need a fresh take? Get an instant paraphrase of this document with our AI Paraphraser
10BUSINESS STUDIES
Economic Order Quantity (EOQ) 4264
4b.
Simultaneous Increase of 7.5% on all factors
Units £
Annual Demand (D) 268750
Annual cost for carrying one unit (C') 0.59
Annual cost per order (S') 21.50
Economic Order Quantity (EOQ) SQRT(2xDxS')/C
Economic Order Quantity (EOQ) 4421
Simultaneous Decrease of 7.5% on all factors
Units £
Annual Demand (D) 231250
Annual cost for carrying one unit (C') 0.51
Annual cost per order (S') 18.50
Economic Order Quantity (EOQ) SQRT(2xDxS')/C
Economic Order Quantity (EOQ) 4101
Increase of 7.5% in Annual Demand (D)
Units £
Annual Demand (D) 268750
Annual cost for carrying one unit (C') 0.55
Annual cost per order (S') 20.00
Economic Order Quantity (EOQ) SQRT(2xDxS')/C
Economic Order Quantity (EOQ) 4421
Increase of 7.5% in Annual cost for carrying one unit (C')
Units £
Annual Demand (D) 250000
Annual cost for carrying one unit (C') 0.59
Annual cost per order (S') 20.00
Economic Order Quantity (EOQ) SQRT(2xDxS')/C
11BUSINESS STUDIES
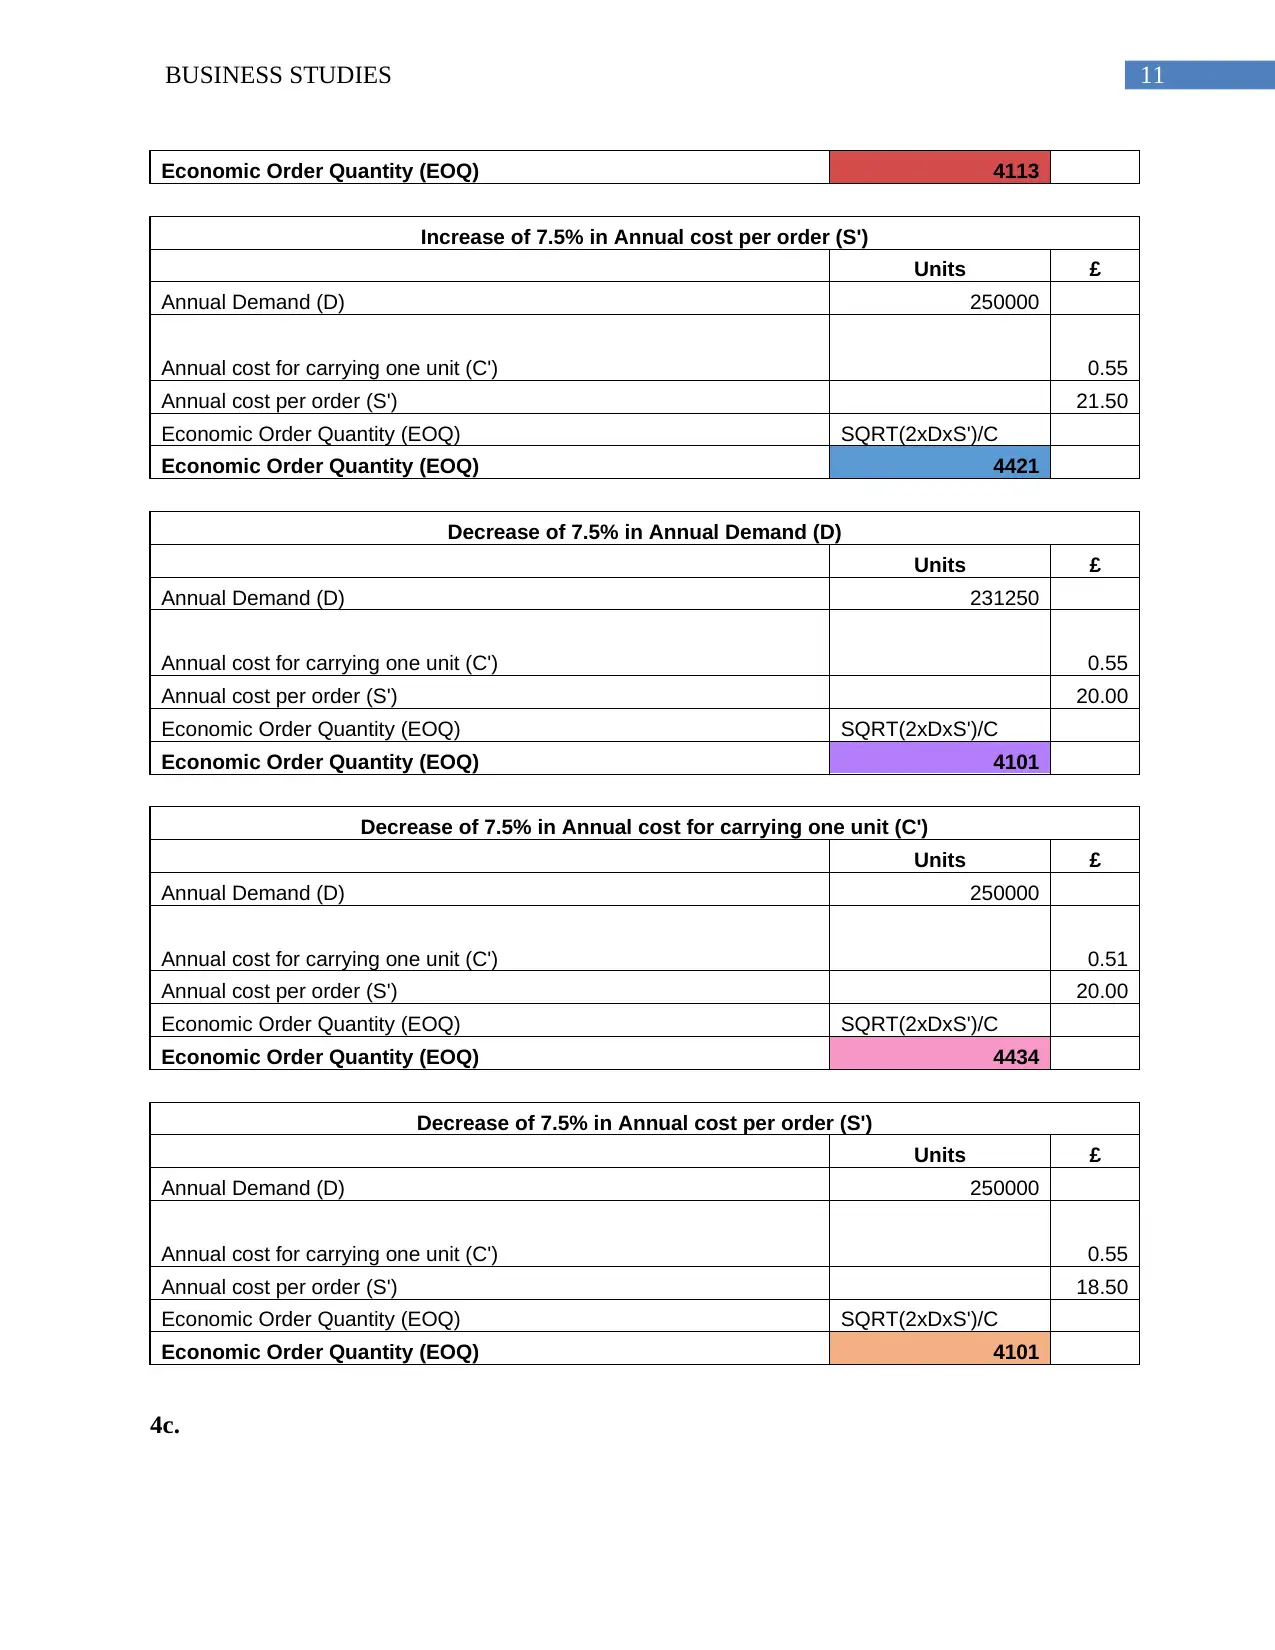
Economic Order Quantity (EOQ) 4113
Increase of 7.5% in Annual cost per order (S')
Units £
Annual Demand (D) 250000
Annual cost for carrying one unit (C') 0.55
Annual cost per order (S') 21.50
Economic Order Quantity (EOQ) SQRT(2xDxS')/C
Economic Order Quantity (EOQ) 4421
Decrease of 7.5% in Annual Demand (D)
Units £
Annual Demand (D) 231250
Annual cost for carrying one unit (C') 0.55
Annual cost per order (S') 20.00
Economic Order Quantity (EOQ) SQRT(2xDxS')/C
Economic Order Quantity (EOQ) 4101
Decrease of 7.5% in Annual cost for carrying one unit (C')
Units £
Annual Demand (D) 250000
Annual cost for carrying one unit (C') 0.51
Annual cost per order (S') 20.00
Economic Order Quantity (EOQ) SQRT(2xDxS')/C
Economic Order Quantity (EOQ) 4434
Decrease of 7.5% in Annual cost per order (S')
Units £
Annual Demand (D) 250000
Annual cost for carrying one unit (C') 0.55
Annual cost per order (S') 18.50
Economic Order Quantity (EOQ) SQRT(2xDxS')/C
Economic Order Quantity (EOQ) 4101
4c.
⊘ This is a preview!⊘
Do you want full access?
Subscribe today to unlock all pages.
Trusted by 1+ million students worldwide
1 out of 17


Your All-in-One AI-Powered Toolkit for Academic Success.
+13062052269
info@desklib.com
Available 24*7 on WhatsApp / Email
![[object Object]](/_next/static/media/star-bottom.7253800d.svg)
Unlock your academic potential
Copyright © 2020–2026 A2Z Services. All Rights Reserved. Developed and managed by ZUCOL.