Financial Analysis of Metro Inc.: Business and Competitor Review
VerifiedAdded on 2020/03/16
|30
|4882
|424
Report
AI Summary
This report offers a comprehensive financial analysis of Metro Inc., a major Canadian supermarket chain. It begins with an executive summary and an introduction to the report's objectives. The core of the report dissects Metro Inc.'s current business and financial health, utilizing ratio analysis to evaluate liquidity, solvency, and profitability. The analysis covers working capital, acid test ratio, current ratio, debt to total assets, times interest earned, and return on equity. Furthermore, the report critically analyzes the industrial sector and the financial performance of three key competitors: Loblaw Companies, Walmart, and Costco. A comparative assessment of Metro Inc.'s financial strengths and weaknesses against its competitors is provided. Finally, the report concludes with strategic recommendations for Metro Inc. aimed at improving its financial position, including suggestions for equity financing and debt management. The report references financial statements and data from 2015 and 2016 to support its analysis and findings.
Running head: FINANCIAL ANALYSIS OF METRO INC
Financial Analysis of Metro Inc
Name of the Student:
Name of the University:
Author’s Note:
Course ID:
Financial Analysis of Metro Inc
Name of the Student:
Name of the University:
Author’s Note:
Course ID:
Paraphrase This Document
Need a fresh take? Get an instant paraphrase of this document with our AI Paraphraser
1FINANCIAL ANALYSIS OF METRO INC
Executive Summary:
The current report aims to select and evaluate the financial performance of Metro Inc,
which is a popular supermarket in the province of Canada. It is one of the giant food retailers in
the provinces of Ontario and Quebec in Canada. The report focuses on dissecting the existing
business and financial health of Metro Inc. In addition, it concentrates on providing critical
evaluation of the overall industry and the financial appraisal of the three chosen competitors that
include Loblaw Companies, Wal-Mart and Costco.
It has been assessed that Metro Inc has stable financial position and the investors could
buy shares for earning higher returns in future. In addition, Metro Inc has increased demand in
the market, as it could release its inventory at a faster rate compared to its competitors. Thus, it
needs to issue new equity shares for raising funds through equity financing to minimise the
overall debt burden.
2FINANCIAL ANALYSIS OF METRO INC
Table of Contents
Introduction:....................................................................................................................................3
Analysis of the current business and financial health of Metro Inc:...............................................3
Critical analysis of the industrial sector and financial evaluation of three competitors:...............18
Critical appraisal of the financial strengths and weaknesses of Metro Inc in comparison to the
chosen competitors:.......................................................................................................................19
Recommendations for Metro Inc:..................................................................................................20
Conclusion:....................................................................................................................................20
References:....................................................................................................................................21
Appendices:...................................................................................................................................24
⊘ This is a preview!⊘
Do you want full access?
Subscribe today to unlock all pages.
Trusted by 1+ million students worldwide
3FINANCIAL ANALYSIS OF METRO INC
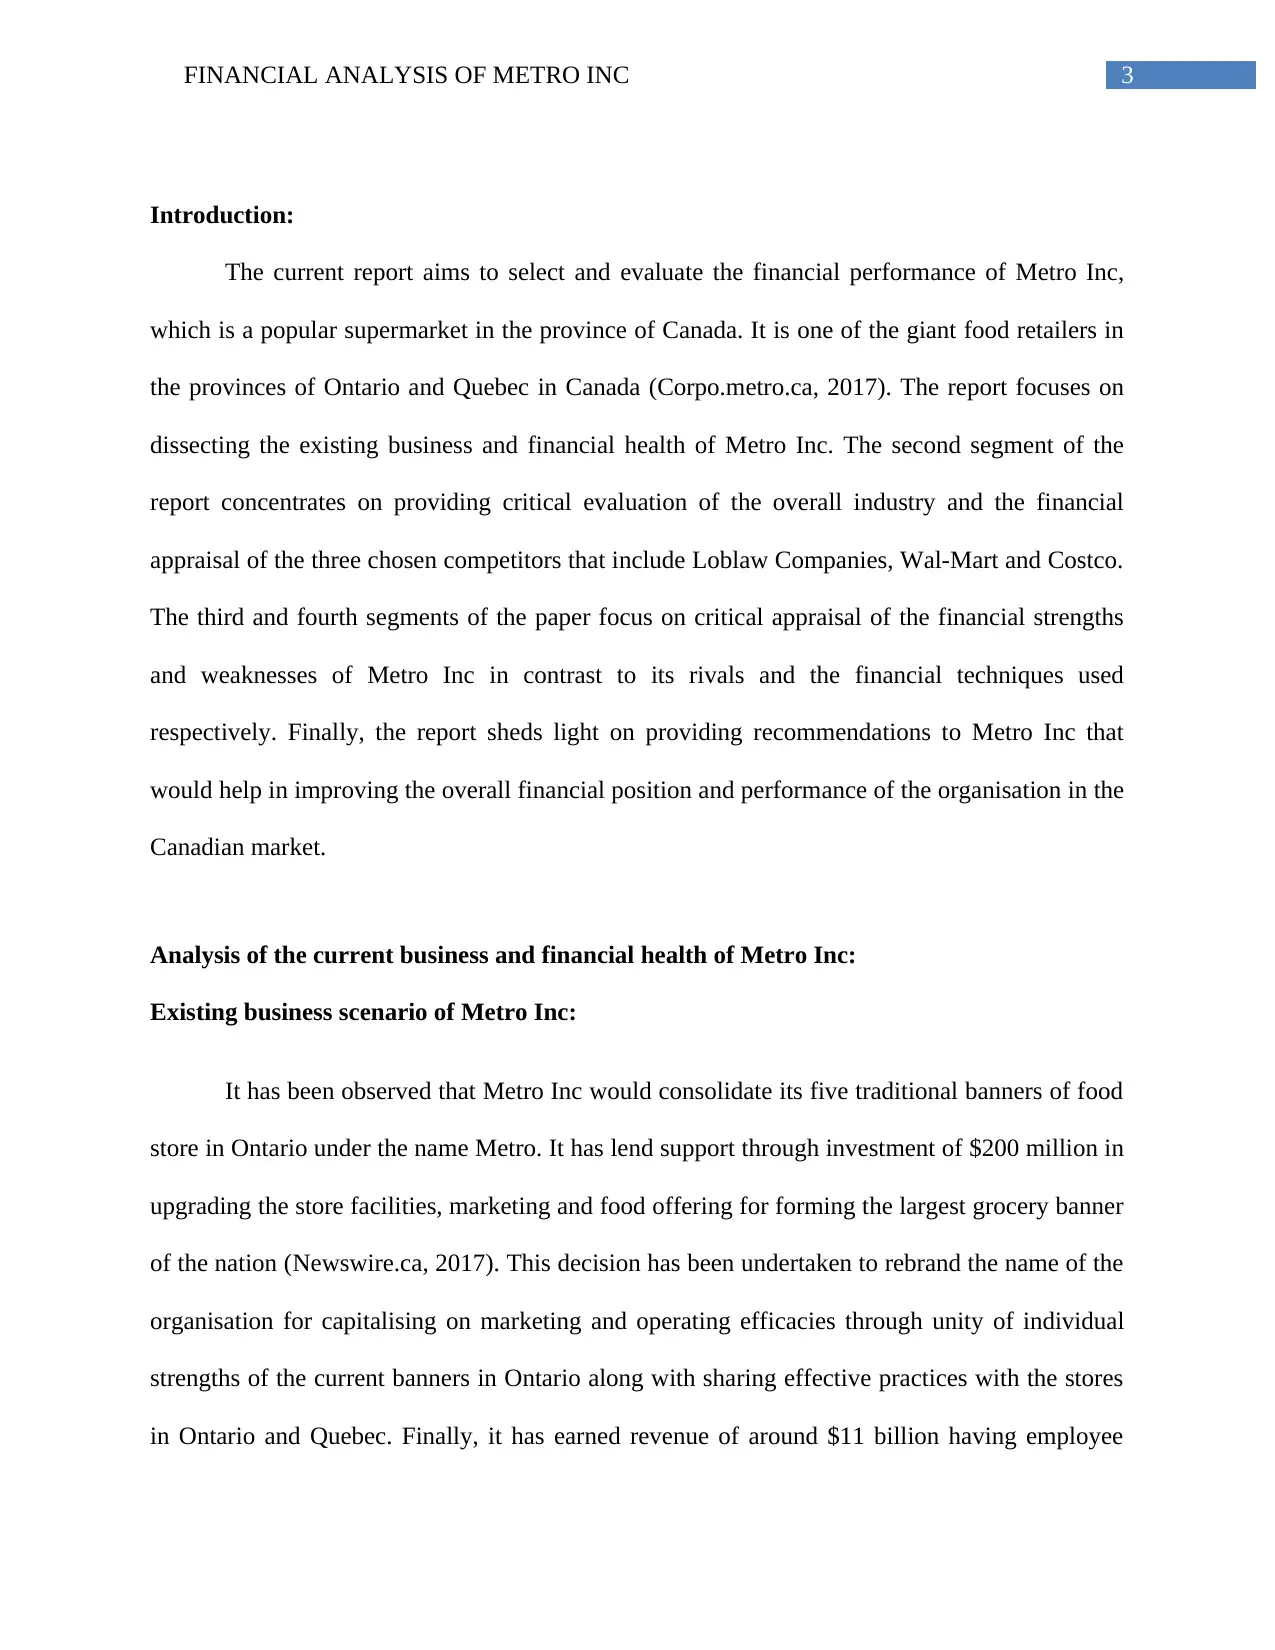
Introduction:
The current report aims to select and evaluate the financial performance of Metro Inc,
which is a popular supermarket in the province of Canada. It is one of the giant food retailers in
the provinces of Ontario and Quebec in Canada (Corpo.metro.ca, 2017). The report focuses on
dissecting the existing business and financial health of Metro Inc. The second segment of the
report concentrates on providing critical evaluation of the overall industry and the financial
appraisal of the three chosen competitors that include Loblaw Companies, Wal-Mart and Costco.
The third and fourth segments of the paper focus on critical appraisal of the financial strengths
and weaknesses of Metro Inc in contrast to its rivals and the financial techniques used
respectively. Finally, the report sheds light on providing recommendations to Metro Inc that
would help in improving the overall financial position and performance of the organisation in the
Canadian market.
Analysis of the current business and financial health of Metro Inc:
Existing business scenario of Metro Inc:
It has been observed that Metro Inc would consolidate its five traditional banners of food
store in Ontario under the name Metro. It has lend support through investment of $200 million in
upgrading the store facilities, marketing and food offering for forming the largest grocery banner
of the nation (Newswire.ca, 2017). This decision has been undertaken to rebrand the name of the
organisation for capitalising on marketing and operating efficacies through unity of individual
strengths of the current banners in Ontario along with sharing effective practices with the stores
in Ontario and Quebec. Finally, it has earned revenue of around $11 billion having employee
Paraphrase This Document
Need a fresh take? Get an instant paraphrase of this document with our AI Paraphraser
4FINANCIAL ANALYSIS OF METRO INC
base of 65,000, it has become the leader in the Canadian food sector (Brigham & Ehrhardt,
2013).
Financial health of Metro Inc:
The financial health of Metro Inc could be evaluated with the help of ratio analysis, as
this analysis helps in ascertaining the overall financial position and performance of an
organisation in its operating market (Batta, Ganguly & Rosett, 2014). The following categories
of ratios are considered for evaluating the financial health of Metro Inc:
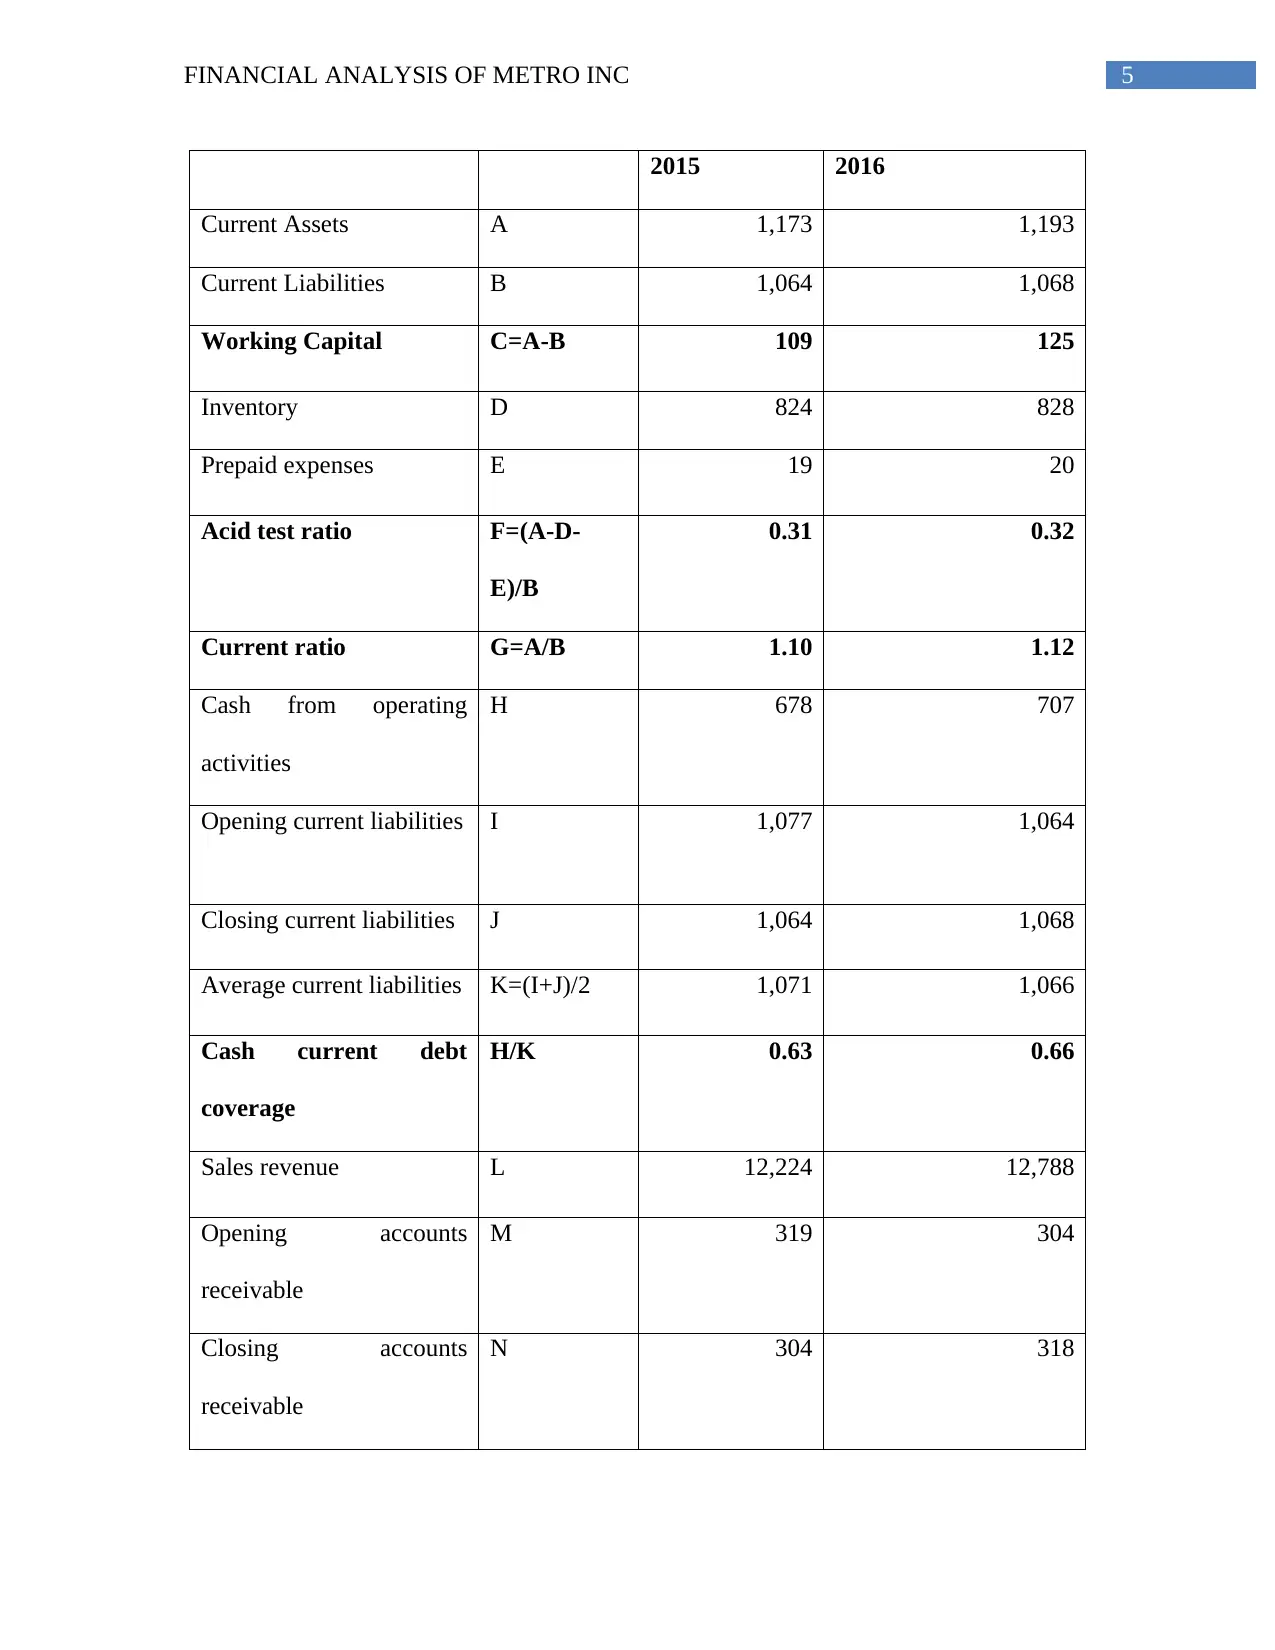
Liquidity category:
In the words of Bodie (2013), liquidity ratios help in gauging the ability of an
organisation in paying debt obligations and safety margin through the computation of various
metrics. These metrics include the following:
Working capital
Acid test ratio
Current ratio
Cash current debt coverage
Receivables turnover
Average collection period (in days)
Inventory turnover
Days in inventory
Days payable
Particulars Details Metro Inc
base of 65,000, it has become the leader in the Canadian food sector (Brigham & Ehrhardt,
2013).
Financial health of Metro Inc:
The financial health of Metro Inc could be evaluated with the help of ratio analysis, as
this analysis helps in ascertaining the overall financial position and performance of an
organisation in its operating market (Batta, Ganguly & Rosett, 2014). The following categories
of ratios are considered for evaluating the financial health of Metro Inc:
Liquidity category:
In the words of Bodie (2013), liquidity ratios help in gauging the ability of an
organisation in paying debt obligations and safety margin through the computation of various
metrics. These metrics include the following:
Working capital
Acid test ratio
Current ratio
Cash current debt coverage
Receivables turnover
Average collection period (in days)
Inventory turnover
Days in inventory
Days payable
Particulars Details Metro Inc
5FINANCIAL ANALYSIS OF METRO INC
2015 2016
Current Assets A 1,173 1,193
Current Liabilities B 1,064 1,068
Working Capital C=A-B 109 125
Inventory D 824 828
Prepaid expenses E 19 20
Acid test ratio F=(A-D-
E)/B
0.31 0.32
Current ratio G=A/B 1.10 1.12
Cash from operating
activities
H 678 707
Opening current liabilities I 1,077 1,064
Closing current liabilities J 1,064 1,068
Average current liabilities K=(I+J)/2 1,071 1,066
Cash current debt
coverage
H/K 0.63 0.66
Sales revenue L 12,224 12,788
Opening accounts
receivable
M 319 304
Closing accounts
receivable
N 304 318
⊘ This is a preview!⊘
Do you want full access?
Subscribe today to unlock all pages.
Trusted by 1+ million students worldwide
6FINANCIAL ANALYSIS OF METRO INC
Average accounts
receivable
O=(M+N)/2 312 311
Receivables turnover P=L/O 39.24 41.12
Average collection
period (in days)
365/P 9.30 8.88
Cost of sales Q 9,814 10,271
Opening inventory R 821 824
Closing inventory S 824 828
Average inventory T=(R+S)/2 823 826
Inventory turnover U=Q/T 11.93 12.43
Days in inventory 365/U 30.59 29.35
Opening accounts payable V 983 999
Closing accounts payable W 999 -
Average accounts payable X=(V+W)/2 991 500
Days payable Y=X/(Q/
365)
36.86 17.75
Table 1: Liquidity category of Metro Inc for the years 2015 and 2016
(Source: Corpo.metro.ca, 2017)
Paraphrase This Document
Need a fresh take? Get an instant paraphrase of this document with our AI Paraphraser
7FINANCIAL ANALYSIS OF METRO INC
Working Capital Acid test ratio Current ratio Cash current
debt coverage
-
20
40
60
80
100
120
140
109.00
0.31 1.10 0.63
125.00
0.32 1.12 0.66
Liquidity category of Metro Inc
2015
2016
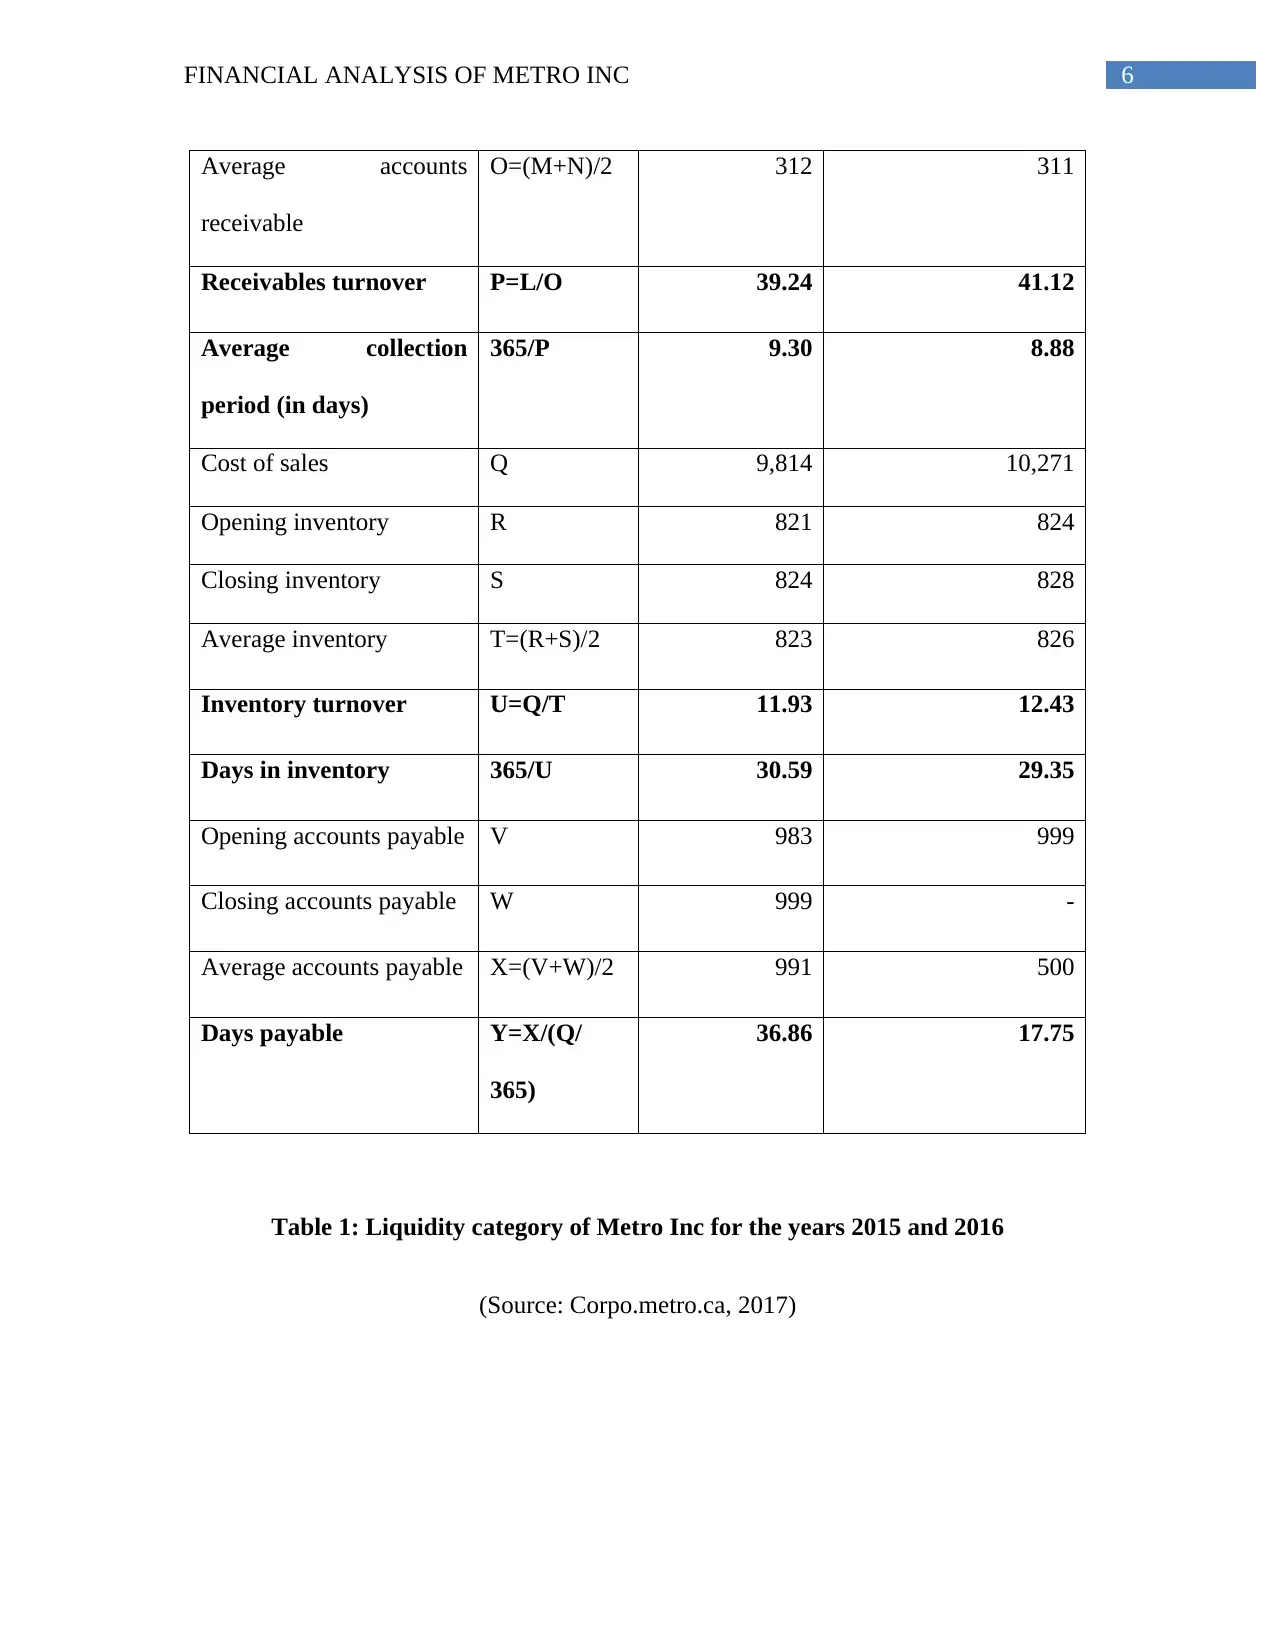
Figure 1: Working capital, acid test ratio, current ratio and cash current debt coverage of
Metro Inc for the years 2015 and 2016
(Source: Corpo.metro.ca, 2017)
According to the above figure, it has been found that the working capital of Metro Inc has
increased from 109 million CAD in 2015 to 125 million CAD in 2016. The main reason
identified behind such trend is that there is no amount of accounts payable in 2016, which has
lead to fall in short-term liabilities. In addition, both the acid test ratio and current ratio are below
the ideal standard, which are considered as 1 and 2 respectively (Brigham & Ehrhardt, 2013).
This is because the existing asset base of the organisation is not sufficient to meet the short-term
obligations due to significant increase in other current liabilities. In terms of cash current debt
coverage, the ratio has increased from 0.63 in 2015 to 0.66 in 2016. A higher ratio of 1 is always
favourable for an organisation, since it denotes that the business would be able to clear off its
short-term dues with the operational cash inflows (Brochet, Jagolinzer & Riedl, 2013). In this
Working Capital Acid test ratio Current ratio Cash current
debt coverage
-
20
40
60
80
100
120
140
109.00
0.31 1.10 0.63
125.00
0.32 1.12 0.66
Liquidity category of Metro Inc
2015
2016
Figure 1: Working capital, acid test ratio, current ratio and cash current debt coverage of
Metro Inc for the years 2015 and 2016
(Source: Corpo.metro.ca, 2017)
According to the above figure, it has been found that the working capital of Metro Inc has
increased from 109 million CAD in 2015 to 125 million CAD in 2016. The main reason
identified behind such trend is that there is no amount of accounts payable in 2016, which has
lead to fall in short-term liabilities. In addition, both the acid test ratio and current ratio are below
the ideal standard, which are considered as 1 and 2 respectively (Brigham & Ehrhardt, 2013).
This is because the existing asset base of the organisation is not sufficient to meet the short-term
obligations due to significant increase in other current liabilities. In terms of cash current debt
coverage, the ratio has increased from 0.63 in 2015 to 0.66 in 2016. A higher ratio of 1 is always
favourable for an organisation, since it denotes that the business would be able to clear off its
short-term dues with the operational cash inflows (Brochet, Jagolinzer & Riedl, 2013). In this
8FINANCIAL ANALYSIS OF METRO INC
case, it is below the desired standard, which denotes the struggling liquidity position of Metro
Inc.
Receivables
turnover Average
collection
period (in
days)
Inventory
turnover Days in
inventory Days payable
0.00
5.00
10.00
15.00
20.00
25.00
30.00
35.00
40.00
45.00 39.24
9.30 11.93
30.59
36.86
41.12
8.88 12.43
29.35
17.75
Liquidity category of Metro Inc
2015
2016
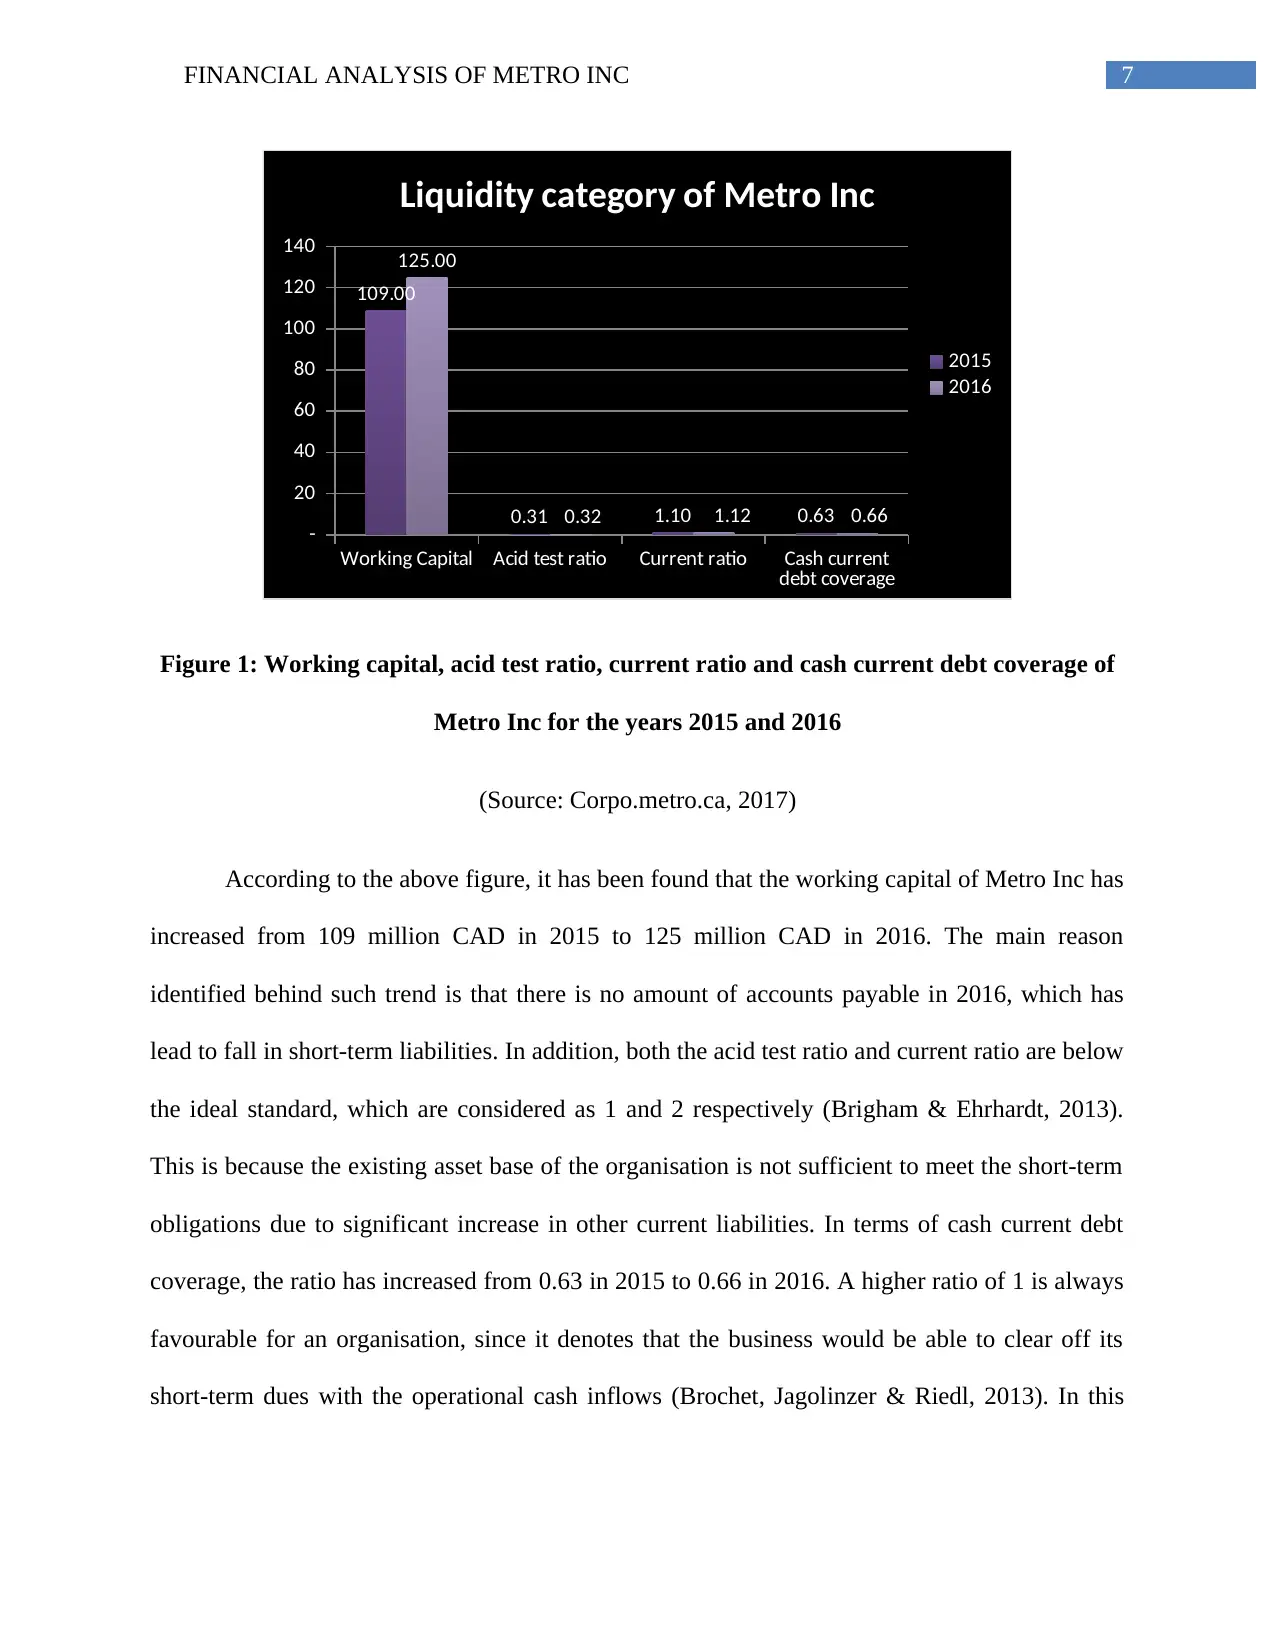
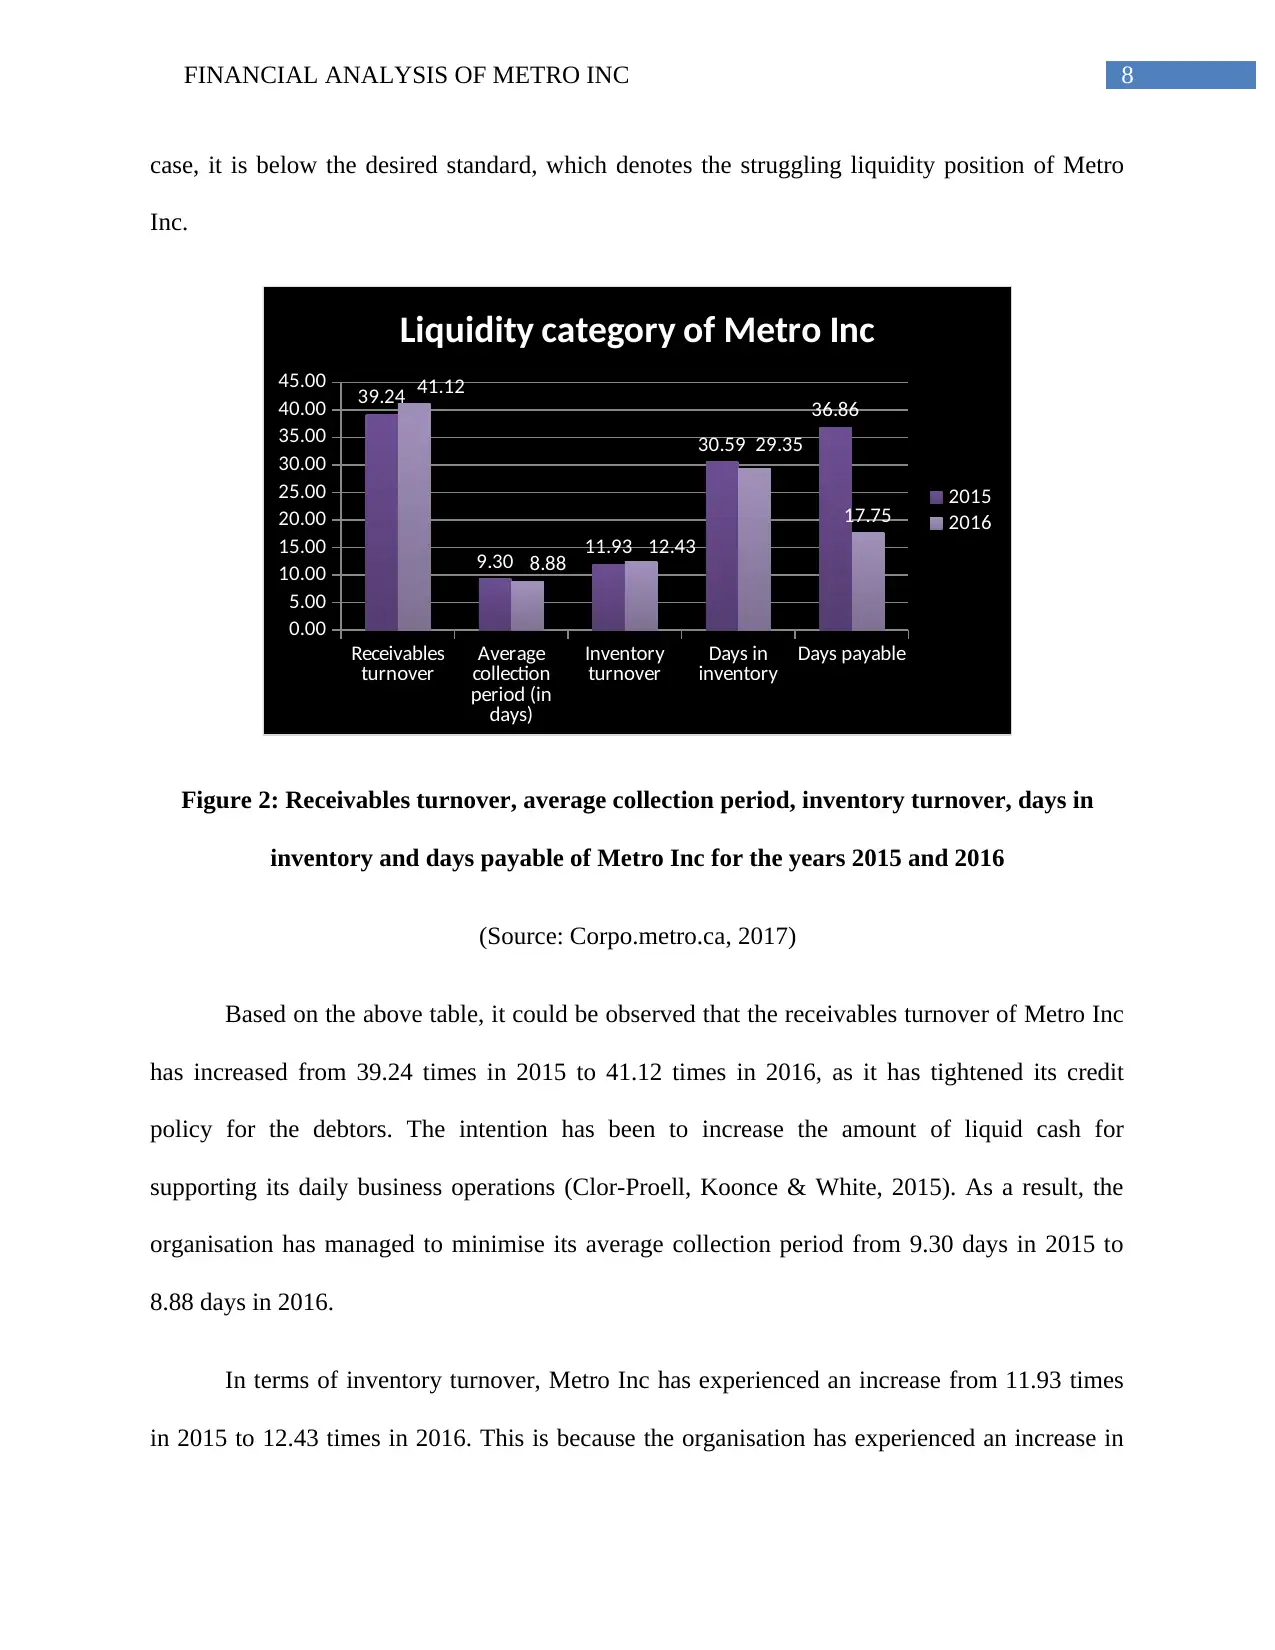
Figure 2: Receivables turnover, average collection period, inventory turnover, days in
inventory and days payable of Metro Inc for the years 2015 and 2016
(Source: Corpo.metro.ca, 2017)
Based on the above table, it could be observed that the receivables turnover of Metro Inc
has increased from 39.24 times in 2015 to 41.12 times in 2016, as it has tightened its credit
policy for the debtors. The intention has been to increase the amount of liquid cash for
supporting its daily business operations (Clor-Proell, Koonce & White, 2015). As a result, the
organisation has managed to minimise its average collection period from 9.30 days in 2015 to
8.88 days in 2016.
In terms of inventory turnover, Metro Inc has experienced an increase from 11.93 times
in 2015 to 12.43 times in 2016. This is because the organisation has experienced an increase in
case, it is below the desired standard, which denotes the struggling liquidity position of Metro
Inc.
Receivables
turnover Average
collection
period (in
days)
Inventory
turnover Days in
inventory Days payable
0.00
5.00
10.00
15.00
20.00
25.00
30.00
35.00
40.00
45.00 39.24
9.30 11.93
30.59
36.86
41.12
8.88 12.43
29.35
17.75
Liquidity category of Metro Inc
2015
2016
Figure 2: Receivables turnover, average collection period, inventory turnover, days in
inventory and days payable of Metro Inc for the years 2015 and 2016
(Source: Corpo.metro.ca, 2017)
Based on the above table, it could be observed that the receivables turnover of Metro Inc
has increased from 39.24 times in 2015 to 41.12 times in 2016, as it has tightened its credit
policy for the debtors. The intention has been to increase the amount of liquid cash for
supporting its daily business operations (Clor-Proell, Koonce & White, 2015). As a result, the
organisation has managed to minimise its average collection period from 9.30 days in 2015 to
8.88 days in 2016.
In terms of inventory turnover, Metro Inc has experienced an increase from 11.93 times
in 2015 to 12.43 times in 2016. This is because the organisation has experienced an increase in
⊘ This is a preview!⊘
Do you want full access?
Subscribe today to unlock all pages.
Trusted by 1+ million students worldwide
9FINANCIAL ANALYSIS OF METRO INC
overall revenue base due to rise in market demand and this has helped in releasing the inventory
at a faster rate (Coates IV, 2014). As a result, Metro Inc has managed to discharge its inventory
from 30.59 days in 2015 to 29.35 days in 2016. However, in terms of payables, the creditors are
not willing to accept any delay in payments due to the declining market reputation. In addition,
the overall debt burden of the organisation has resulted in loss of trust for the investors and thus,
Metro Inc has to clear their payments within shorter timeframe (Weygandt, Kimmel & Kieso,
2015).
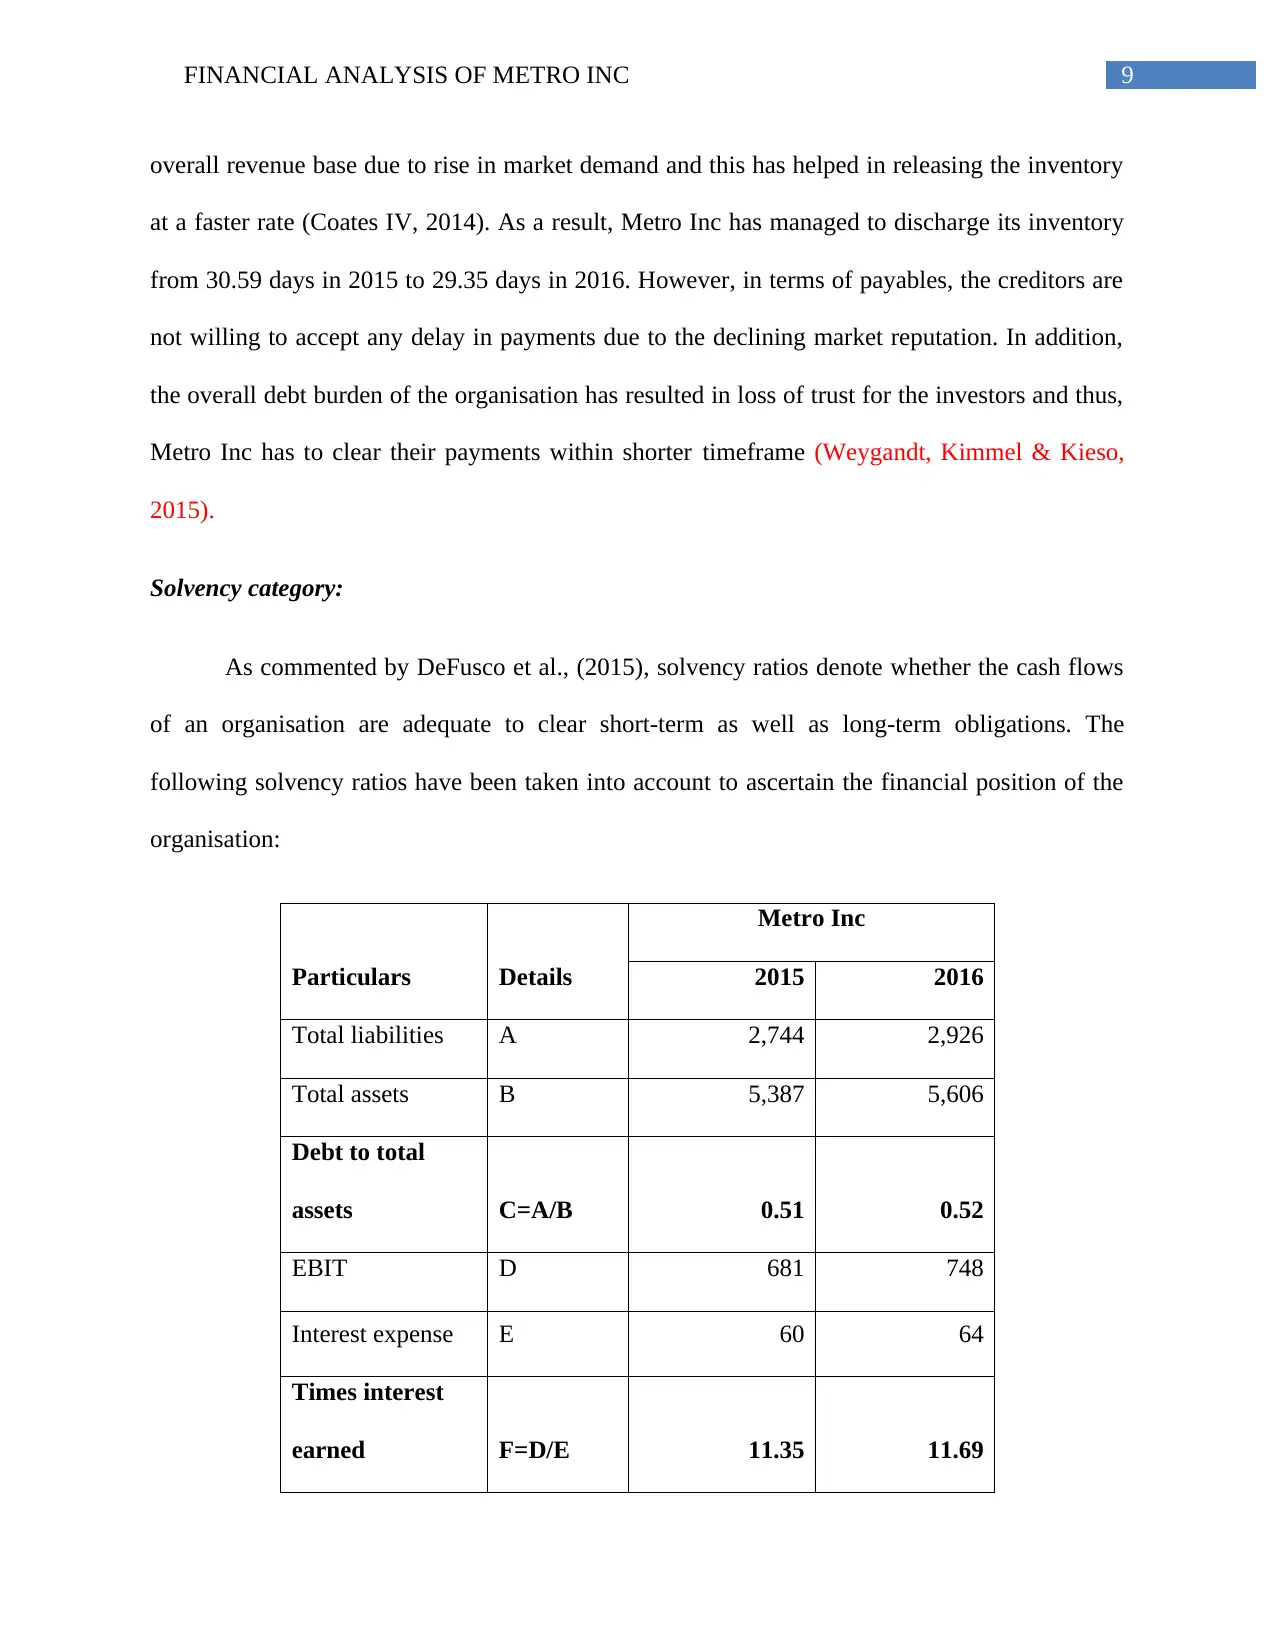
Solvency category:
As commented by DeFusco et al., (2015), solvency ratios denote whether the cash flows
of an organisation are adequate to clear short-term as well as long-term obligations. The
following solvency ratios have been taken into account to ascertain the financial position of the
organisation:
Particulars Details
Metro Inc
2015 2016
Total liabilities A 2,744 2,926
Total assets B 5,387 5,606
Debt to total
assets C=A/B 0.51 0.52
EBIT D 681 748
Interest expense E 60 64
Times interest
earned F=D/E 11.35 11.69
overall revenue base due to rise in market demand and this has helped in releasing the inventory
at a faster rate (Coates IV, 2014). As a result, Metro Inc has managed to discharge its inventory
from 30.59 days in 2015 to 29.35 days in 2016. However, in terms of payables, the creditors are
not willing to accept any delay in payments due to the declining market reputation. In addition,
the overall debt burden of the organisation has resulted in loss of trust for the investors and thus,
Metro Inc has to clear their payments within shorter timeframe (Weygandt, Kimmel & Kieso,
2015).
Solvency category:
As commented by DeFusco et al., (2015), solvency ratios denote whether the cash flows
of an organisation are adequate to clear short-term as well as long-term obligations. The
following solvency ratios have been taken into account to ascertain the financial position of the
organisation:
Particulars Details
Metro Inc
2015 2016
Total liabilities A 2,744 2,926
Total assets B 5,387 5,606
Debt to total
assets C=A/B 0.51 0.52
EBIT D 681 748
Interest expense E 60 64
Times interest
earned F=D/E 11.35 11.69
Paraphrase This Document
Need a fresh take? Get an instant paraphrase of this document with our AI Paraphraser
10FINANCIAL ANALYSIS OF METRO INC
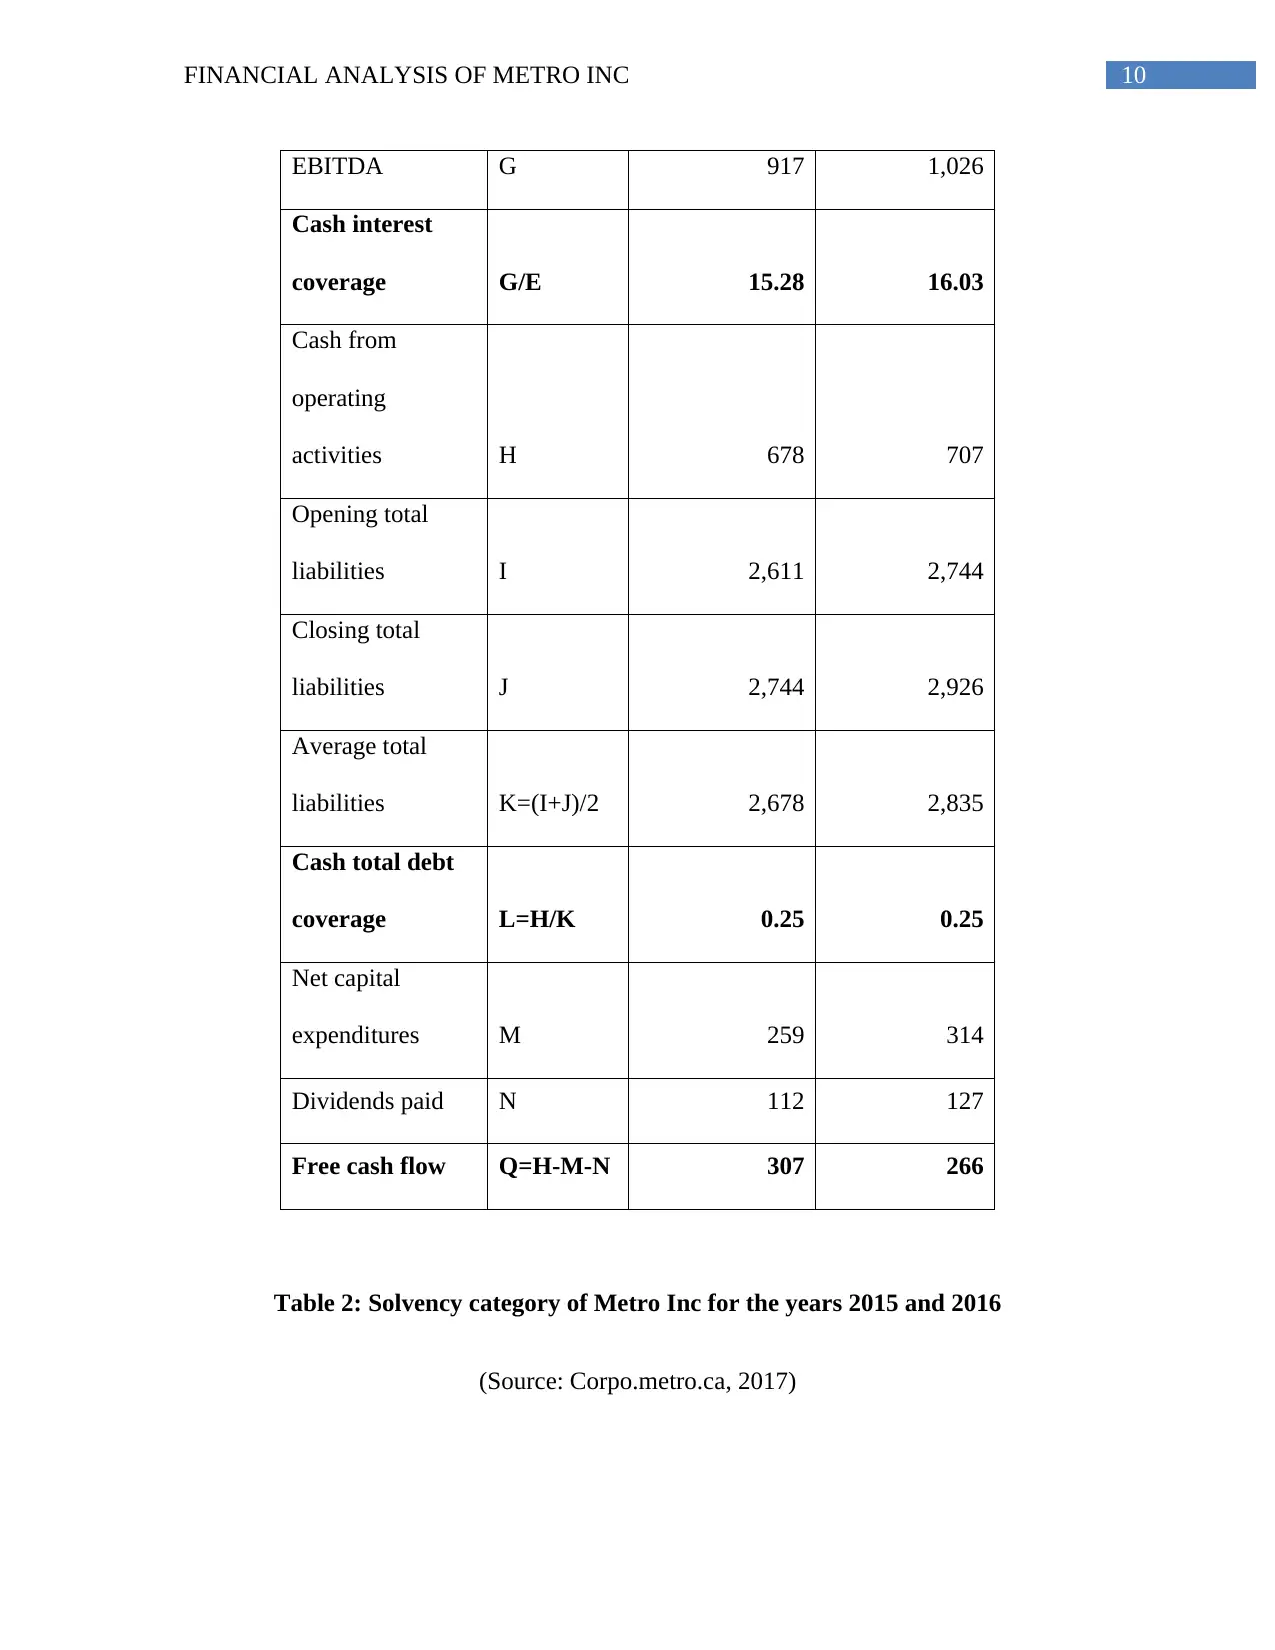
EBITDA G 917 1,026
Cash interest
coverage G/E 15.28 16.03
Cash from
operating
activities H 678 707
Opening total
liabilities I 2,611 2,744
Closing total
liabilities J 2,744 2,926
Average total
liabilities K=(I+J)/2 2,678 2,835
Cash total debt
coverage L=H/K 0.25 0.25
Net capital
expenditures M 259 314
Dividends paid N 112 127
Free cash flow Q=H-M-N 307 266
Table 2: Solvency category of Metro Inc for the years 2015 and 2016
(Source: Corpo.metro.ca, 2017)
11FINANCIAL ANALYSIS OF METRO INC
Debt to total
assets Times
interest
earned
Cash
interest
coverage
Cash total
debt
coverage
Free cash
flow
0.00
50.00
100.00
150.00
200.00
250.00
300.00
350.00
0.509374419899
759 11.35
15.28333333333
33 0.253221288515
406
307
0.52 11.69 16.03 0.25
266.00
Solvency Category of Metro Inc
2015
2016
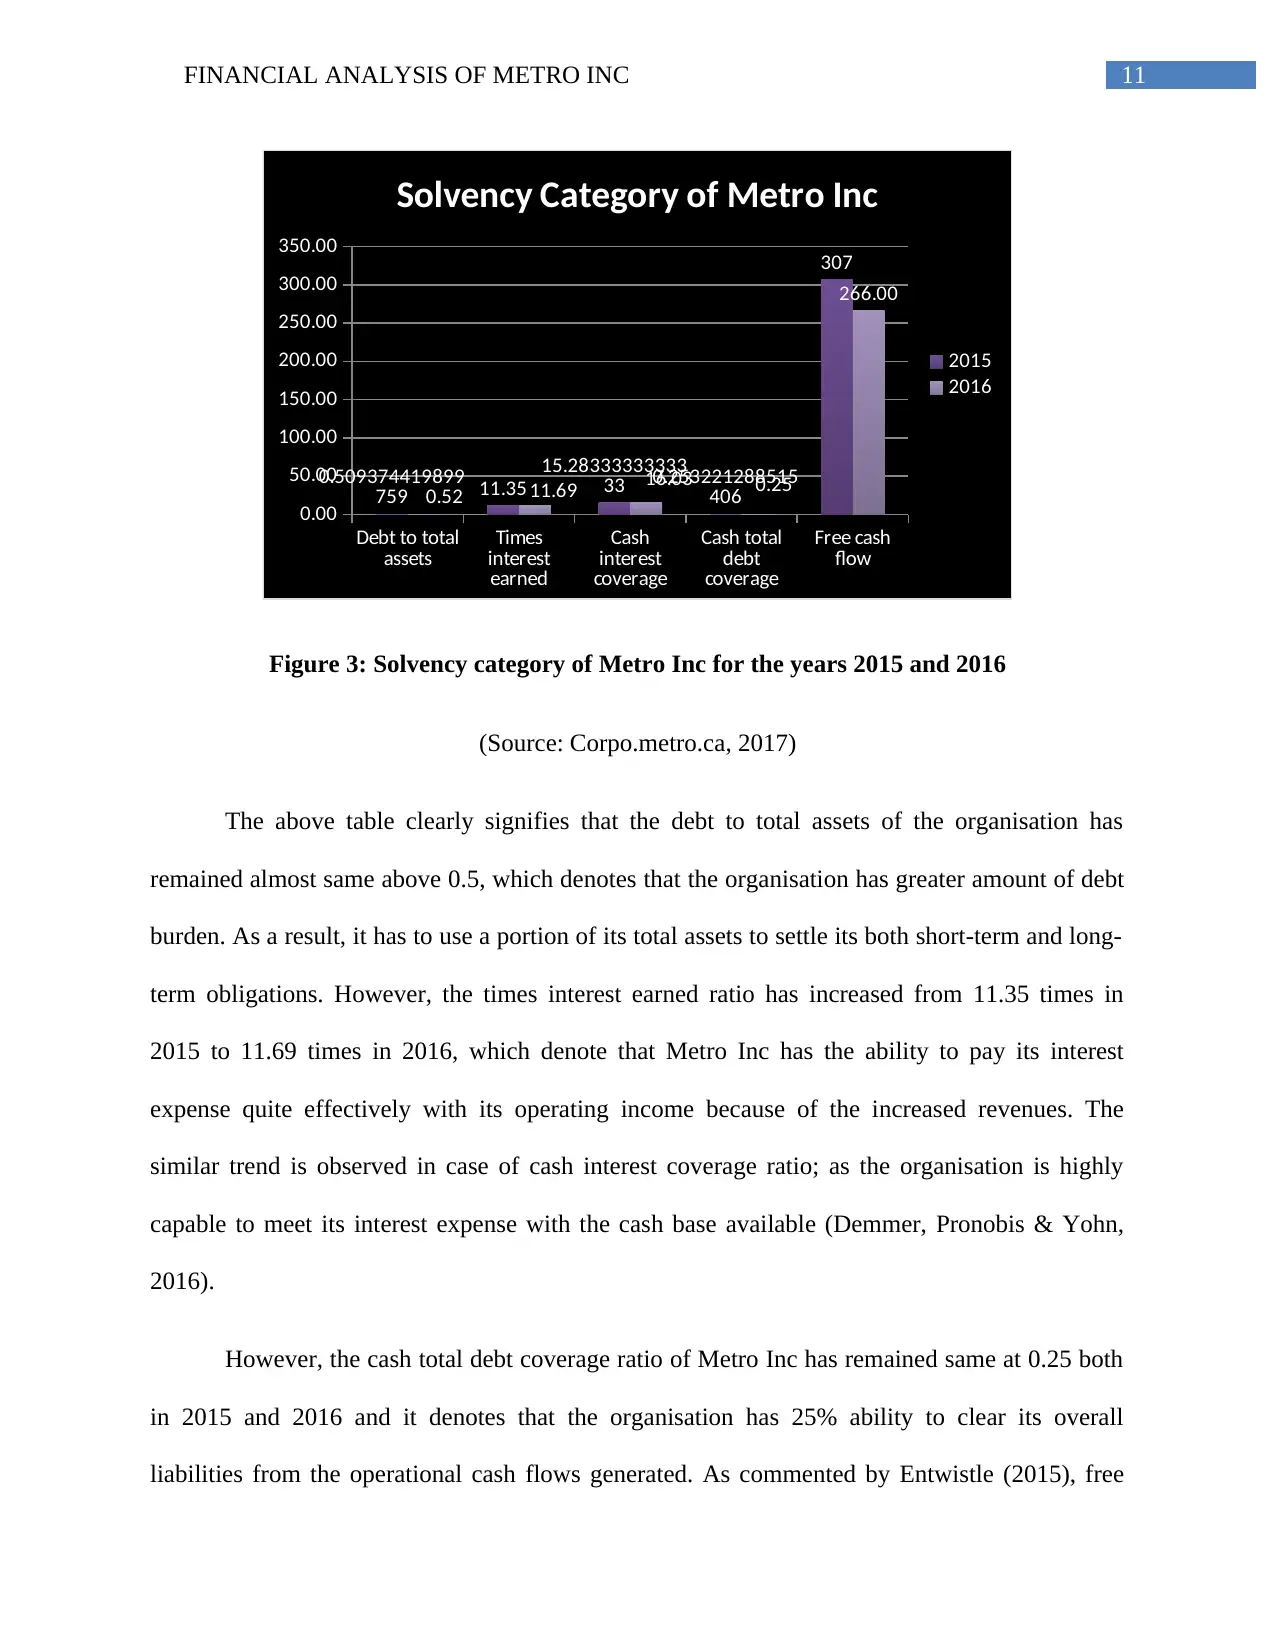
Figure 3: Solvency category of Metro Inc for the years 2015 and 2016
(Source: Corpo.metro.ca, 2017)
The above table clearly signifies that the debt to total assets of the organisation has
remained almost same above 0.5, which denotes that the organisation has greater amount of debt
burden. As a result, it has to use a portion of its total assets to settle its both short-term and long-
term obligations. However, the times interest earned ratio has increased from 11.35 times in
2015 to 11.69 times in 2016, which denote that Metro Inc has the ability to pay its interest
expense quite effectively with its operating income because of the increased revenues. The
similar trend is observed in case of cash interest coverage ratio; as the organisation is highly
capable to meet its interest expense with the cash base available (Demmer, Pronobis & Yohn,
2016).
However, the cash total debt coverage ratio of Metro Inc has remained same at 0.25 both
in 2015 and 2016 and it denotes that the organisation has 25% ability to clear its overall
liabilities from the operational cash flows generated. As commented by Entwistle (2015), free
Debt to total
assets Times
interest
earned
Cash
interest
coverage
Cash total
debt
coverage
Free cash
flow
0.00
50.00
100.00
150.00
200.00
250.00
300.00
350.00
0.509374419899
759 11.35
15.28333333333
33 0.253221288515
406
307
0.52 11.69 16.03 0.25
266.00
Solvency Category of Metro Inc
2015
2016
Figure 3: Solvency category of Metro Inc for the years 2015 and 2016
(Source: Corpo.metro.ca, 2017)
The above table clearly signifies that the debt to total assets of the organisation has
remained almost same above 0.5, which denotes that the organisation has greater amount of debt
burden. As a result, it has to use a portion of its total assets to settle its both short-term and long-
term obligations. However, the times interest earned ratio has increased from 11.35 times in
2015 to 11.69 times in 2016, which denote that Metro Inc has the ability to pay its interest
expense quite effectively with its operating income because of the increased revenues. The
similar trend is observed in case of cash interest coverage ratio; as the organisation is highly
capable to meet its interest expense with the cash base available (Demmer, Pronobis & Yohn,
2016).
However, the cash total debt coverage ratio of Metro Inc has remained same at 0.25 both
in 2015 and 2016 and it denotes that the organisation has 25% ability to clear its overall
liabilities from the operational cash flows generated. As commented by Entwistle (2015), free
⊘ This is a preview!⊘
Do you want full access?
Subscribe today to unlock all pages.
Trusted by 1+ million students worldwide
1 out of 30


Your All-in-One AI-Powered Toolkit for Academic Success.
+13062052269
info@desklib.com
Available 24*7 on WhatsApp / Email
![[object Object]](/_next/static/media/star-bottom.7253800d.svg)
Unlock your academic potential
Copyright © 2020–2026 A2Z Services. All Rights Reserved. Developed and managed by ZUCOL.