Comprehensive Financial Analysis and Modeling Project: DHG Pharma
VerifiedAdded on 2021/02/05
|15
|5683
|417
Project
AI Summary
This project provides a comprehensive financial analysis of DHG Pharmaceutical Joint Stock Company (DHG Pharma), a leading Vietnamese pharmaceutical company. It begins with an introduction to DHG Pharma, detailing its mission, history, and market position within the Vietnamese pharmaceutical industry. The analysis then employs Porter's Five Forces framework to assess the competitive landscape, evaluating factors such as industry rivalry, the threat of new entrants, substitute products, buyer power, and supplier power. A value chain analysis is conducted to examine DHG Pharma's operations, from research and development to distribution, highlighting key activities and areas of added value. Furthermore, the project delves into DHG Pharma's economic attributes, including its B2B demand generation, capital intensity, and investment policies. The company's strategies are identified, focusing on product differentiation, integration within the value chain, geographical diversification, and industry concentration. Finally, the project includes a financial analysis, with a particular focus on Return on Assets (ROA) and its components, including profit margins and asset turnover, assessing the firm's performance over a period of time. This project is a valuable resource for students seeking to understand financial modeling and analysis within the pharmaceutical sector. The project is contributed by a student to be published on the website Desklib. Desklib is a platform which provides all the necessary AI based study tools for students.
DHG PHARMACEUTICAL JSC
DHG Pharmaceutical JSC
Financial Modeling Project
6/20/2019
GROUP
1. Nguyễn Ngọc Trường 30%
2. Nguyễn Khánh Huyền 20%
3. Nguyễn Tiểu Hà 25%
4. Lưu Trần Minh Phương 20%
5. Nguyễn Trọng Nghĩa 5%
DHG Pharmaceutical JSC
Financial Modeling Project
6/20/2019
GROUP
1. Nguyễn Ngọc Trường 30%
2. Nguyễn Khánh Huyền 20%
3. Nguyễn Tiểu Hà 25%
4. Lưu Trần Minh Phương 20%
5. Nguyễn Trọng Nghĩa 5%
Paraphrase This Document
Need a fresh take? Get an instant paraphrase of this document with our AI Paraphraser
I) Introduction
DHG Pharmaceutical Joint Stock Company is a Vietnam-based company engaged in the
Field of Manufacture and Trade pharmaceutical industry. The Company Manufactures
and trades in pharmaceuticals, dietary supplement and cosmetics. Via its subsidiaries, the
Company is also involved in packaging printing, herb cultivation, medicinal supplies
trading, as well as domestic travel tour and medical clinic operation. DHG’s mission is to
provides high quality products and services to satisfy the aspiration for a more beautiful
and healthier life. In 1996, DHG Pharma’s products was elected as “Vietnam High
Quality Goods” by customers (15 years consecutive). The company equitized in 2004 and
“DHG” was being listed on HOSE in 2006. With outstanding achievements, the company
has been honored with many prestigious awards and titles: Labor Medal I, II, III and
Independence Medal II and III. For more than 30 years of formation and development,
DHG Pharma is now recognized as a company leader of Vietmam Pharmaceutical
industry. These are essential factors that help DHG Pharma have a steady position in the
path of integration.
II) Industry analysis
1) Porter’s five forces framework
Competitive Force 1: Rivalry Among Existing Firms – HIGH
• Industry growth: Recently, pharaceutical industry has a very positive growth rate with
10% per year and forecasted to maintain the growth rate in next 5 years. The increase
of GDP per capital leads to the demand of using drugs is higher.
• Product differentiation: With increasing technical level, the life cycle of drugs is
developed. Even essential items, drugs can be sophisticated easily. Therefore, lacking
of product differentiation, the pressure of price competition is not high.
• Industry concentration: DHG is leading in this industry but other competitors are
growing fast. The largest competitor of DHG is Traphaco, which the goal is to
substitute DHG to be leader of pharaceutical industry in Vietnam. Besides, the
industry has participation of big companies like MGW, Nguyen Kim, FPT Retail,... in
the future so the pressure of DHG is high.
Competitive Force 2: Threat of New Entrants – LOW
• Economy of scale: DHG factory with capacity of 9 billion products per year. Besides,
other local companies enhance the capicity by constructing more factories lead to
barriers to entry is high.
• Brand loyalty: Pharacies and medical institutions are familiar with their old supplier.
New entrants may have big troubles to gain market share, to create trust from
customer. They have to spend so much costs to make people change their minds.
• Legal barrier: Pharaceutical business is controlled by the government. New entrants
must be checked rigorously by Ministry of Health before infiltrating into Vietnam.
• Distribution channels: DHG is holding largest distribution channels of the industry.
The best way for foreign rivals to access into the industry is to invest into domestic
pharmaceutical companies to use their channels and bring their products into
Vietnam’s pharmaceutical market. Abbott Corporation (USA) holds 51.69% stake in
Domesco Medical Import Export JSC; Tashio, top 4 Pharmacy Coporation in Japan,
became major shareholders of the acquisition 24.5% stock in Hau Giang
Pharmaceutical.
Competitive Force 3: Threat of substitute products – HIGH
• Nowadays, the economy is more and more integrated. Vietnam’s pharmaceutical
industry may have opportunities to access high technology. Therefore, domestic
companies spend more R&D expenditure, develop products with highest quality and
effectiveness. DHG’s products must meet higher quality to avoid replacing by rivals’
products and maintaining the loyalty of customers.
Competitive Force 4: Buyer’s power - LOW
⊘ This is a preview!⊘
Do you want full access?
Subscribe today to unlock all pages.
Trusted by 1+ million students worldwide
• Pharmaceutical is one of the essential items, there is no bargain on the price because
buyers have to buy prescription drugs by intruction of the doctor, so the individual
customer power is weak.
• Entities with negotiating power are the pharmacies and medical institutions that fulfill
the medical patients’ prescriptions. Even these entities have little power over newer
drugs under patent or drugs with only one manufacturer. Pharmacies focus on their
profit margins and have little incentive to provide patients with the lowest price.
Competitive Force 5: Supplier’s power-HIGH
• DHG will be in a stronger position if there are fewer manufacturers and distributors.
• Cost of seeking and changing supplier is high when company want to amend other
suppliesr because materials are primally provided by foreign sources. Raw materials
is almost imported from another countries so COGS is affected by the input factors
like as exchange rate, fluctuations or import tax policy.
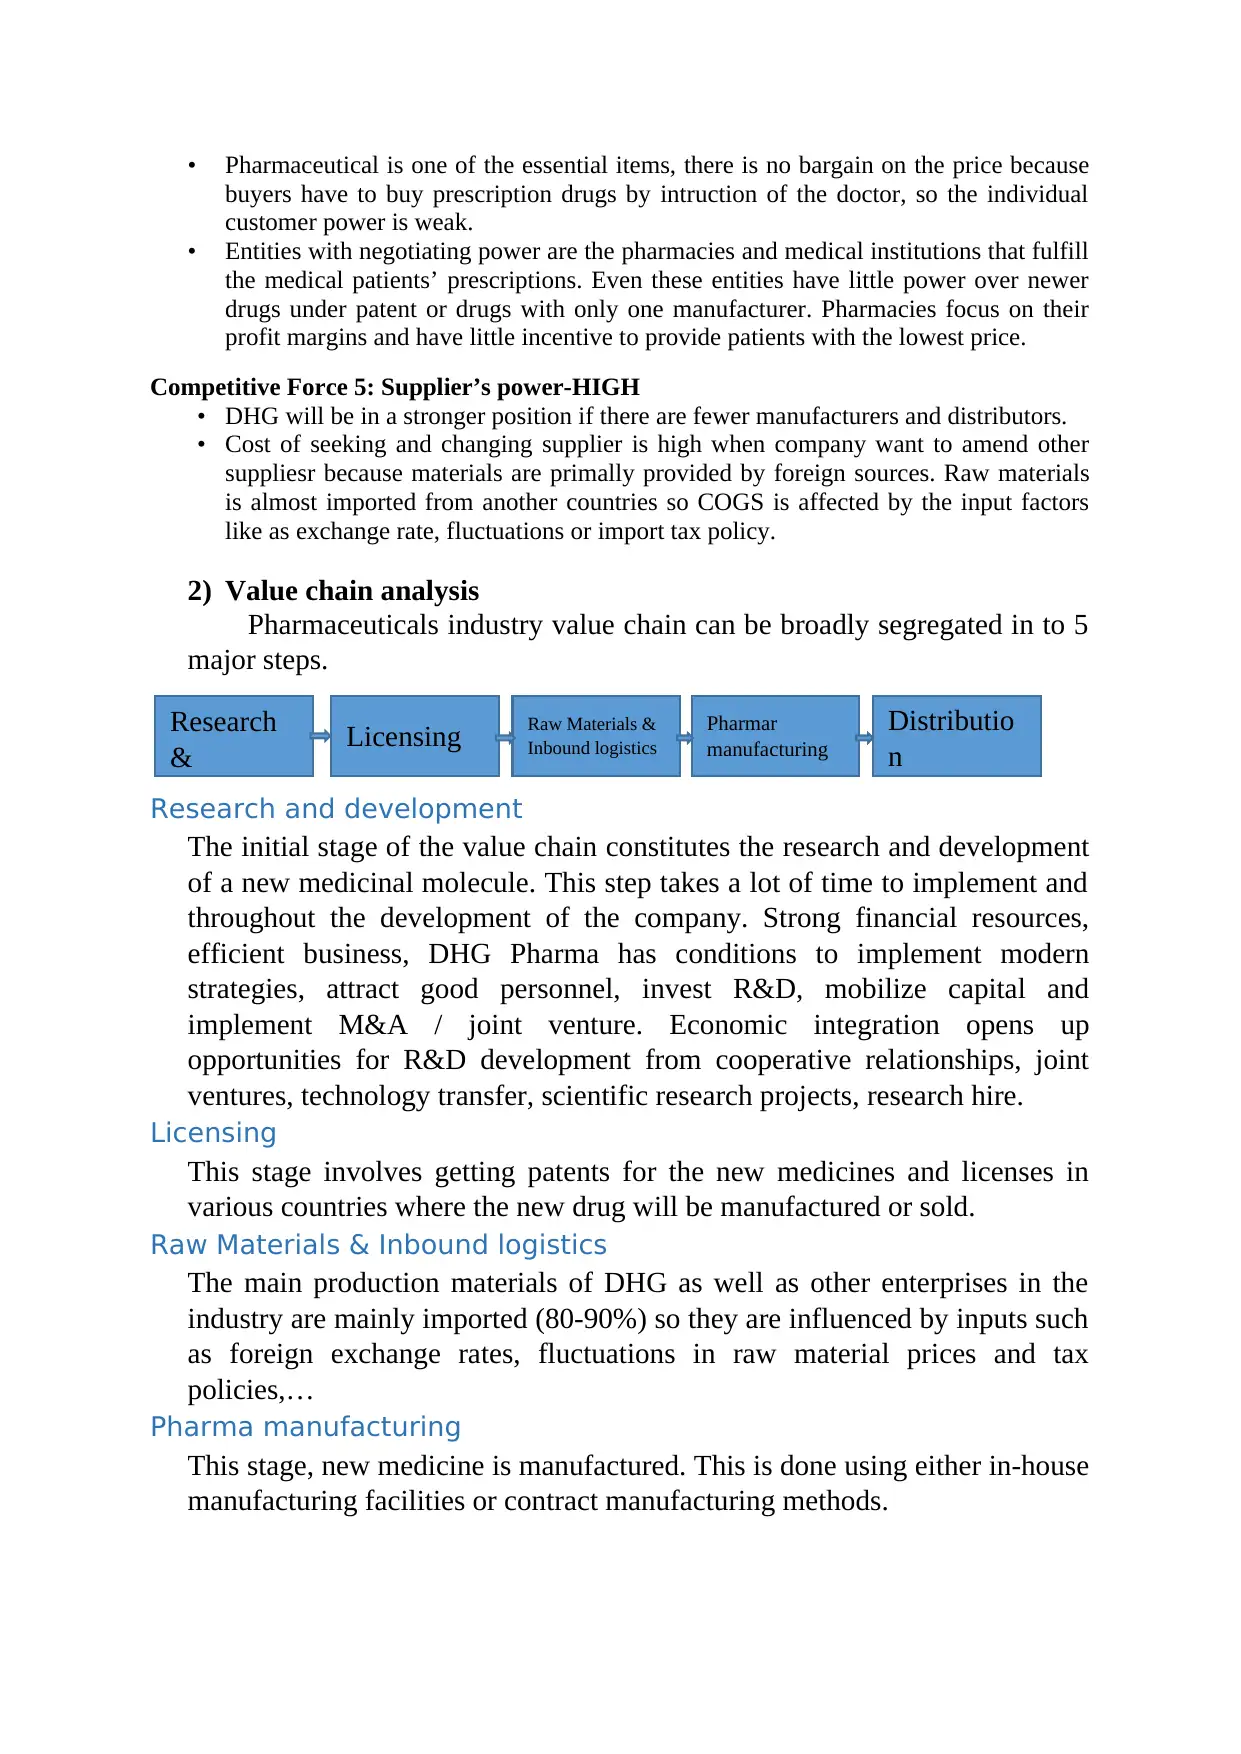
2) Value chain analysis
Pharmaceuticals industry value chain can be broadly segregated in to 5
major steps.
Research and development
The initial stage of the value chain constitutes the research and development
of a new medicinal molecule. This step takes a lot of time to implement and
throughout the development of the company. Strong financial resources,
efficient business, DHG Pharma has conditions to implement modern
strategies, attract good personnel, invest R&D, mobilize capital and
implement M&A / joint venture. Economic integration opens up
opportunities for R&D development from cooperative relationships, joint
ventures, technology transfer, scientific research projects, research hire.
Licensing
This stage involves getting patents for the new medicines and licenses in
various countries where the new drug will be manufactured or sold.
Raw Materials & Inbound logistics
The main production materials of DHG as well as other enterprises in the
industry are mainly imported (80-90%) so they are influenced by inputs such
as foreign exchange rates, fluctuations in raw material prices and tax
policies,…
Pharma manufacturing
This stage, new medicine is manufactured. This is done using either in-house
manufacturing facilities or contract manufacturing methods.
Distributio
n
Research
& Licensing Raw Materials &
Inbound logistics
Pharmar
manufacturing
buyers have to buy prescription drugs by intruction of the doctor, so the individual
customer power is weak.
• Entities with negotiating power are the pharmacies and medical institutions that fulfill
the medical patients’ prescriptions. Even these entities have little power over newer
drugs under patent or drugs with only one manufacturer. Pharmacies focus on their
profit margins and have little incentive to provide patients with the lowest price.
Competitive Force 5: Supplier’s power-HIGH
• DHG will be in a stronger position if there are fewer manufacturers and distributors.
• Cost of seeking and changing supplier is high when company want to amend other
suppliesr because materials are primally provided by foreign sources. Raw materials
is almost imported from another countries so COGS is affected by the input factors
like as exchange rate, fluctuations or import tax policy.
2) Value chain analysis
Pharmaceuticals industry value chain can be broadly segregated in to 5
major steps.
Research and development
The initial stage of the value chain constitutes the research and development
of a new medicinal molecule. This step takes a lot of time to implement and
throughout the development of the company. Strong financial resources,
efficient business, DHG Pharma has conditions to implement modern
strategies, attract good personnel, invest R&D, mobilize capital and
implement M&A / joint venture. Economic integration opens up
opportunities for R&D development from cooperative relationships, joint
ventures, technology transfer, scientific research projects, research hire.
Licensing
This stage involves getting patents for the new medicines and licenses in
various countries where the new drug will be manufactured or sold.
Raw Materials & Inbound logistics
The main production materials of DHG as well as other enterprises in the
industry are mainly imported (80-90%) so they are influenced by inputs such
as foreign exchange rates, fluctuations in raw material prices and tax
policies,…
Pharma manufacturing
This stage, new medicine is manufactured. This is done using either in-house
manufacturing facilities or contract manufacturing methods.
Distributio
n
Research
& Licensing Raw Materials &
Inbound logistics
Pharmar
manufacturing
Paraphrase This Document
Need a fresh take? Get an instant paraphrase of this document with our AI Paraphraser
Distribution
DHG Pharma is considered the largest and largest distribution system in the
country, with 36 branches distributing goods across the country from urban
to rural areas with 27,000 customers. The most value added of the firm is is
stage, because almost revenue of DHG Pharma comes from distribution,
concentrate in southern of Vietnam. DHG does not have retail stores but
mainly distributes to dealers, so that profit comes mainly from distribution
activities.
Hau Giang Pharmaceutical is forming a value chain quickly and optimally, building a
value chain of products from natural links of 04 houses: State - Scientific researchers -
Producers and Farmers, creating economic benefits and social benefits. The subsidiary
that supplies materials is Spivaha; carry out pharmaceutical production through two
factories in Hau Giang and Can Tho; self-printing, packaging production in Hau Giang;
opening Fuji Medic polyclinic; directly distributing through the distribution system of 36
branches distributed to over 25,000 customers, more than 500 hospitals across the
country, over 162 supermarkets, convenience stores and 3 major drugstores. The added
value of drug retail companies has not been expanded much due to the nature of the
industry, a small pharmaceutical company may be able to diversify types of production
drugs to retail in the market.
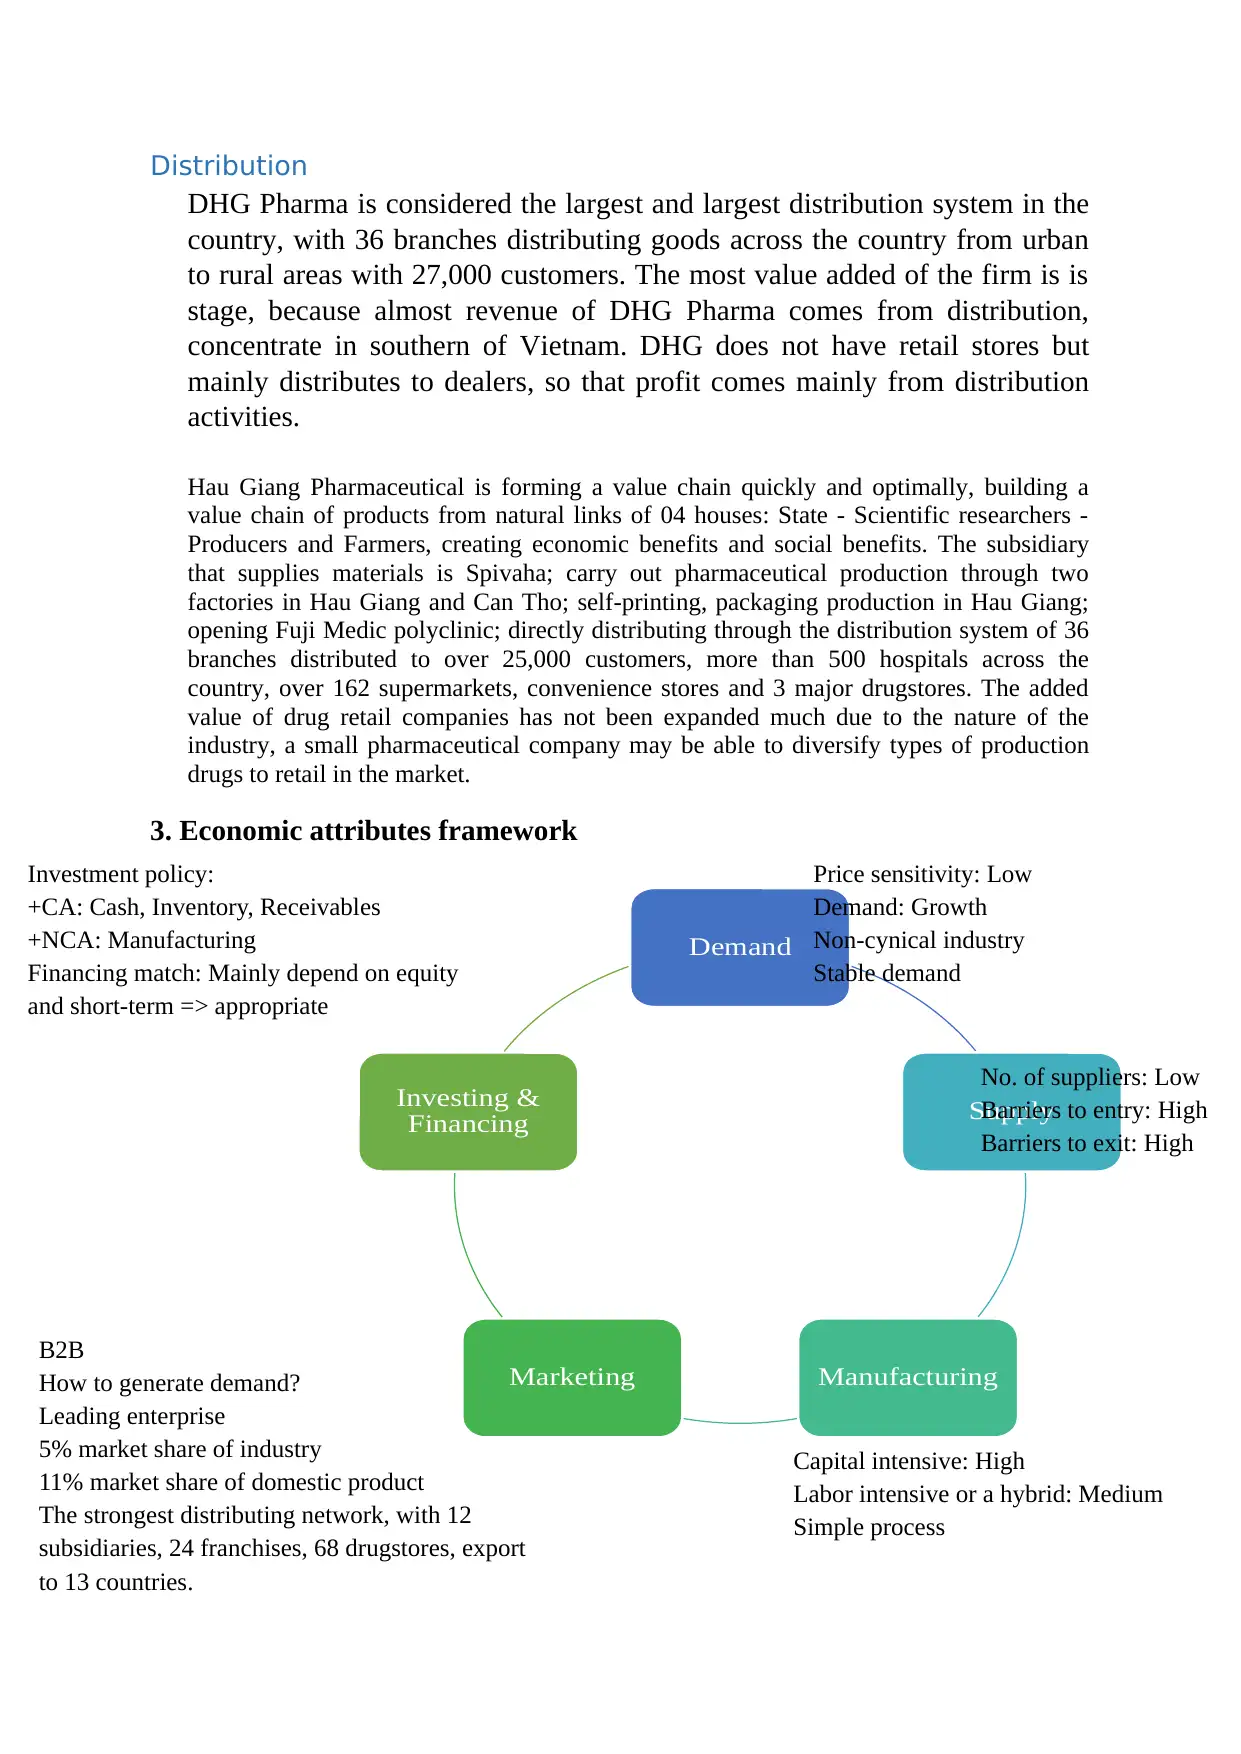
3. Economic attributes framework
Demand
Supply
ManufacturingMarketing
Investing &
Financing
Price sensitivity: Low
Demand: Growth
Non-cynical industry
Stable demand
Investment policy:
+CA: Cash, Inventory, Receivables
+NCA: Manufacturing
Financing match: Mainly depend on equity
and short-term => appropriate
No. of suppliers: Low
Barriers to entry: High
Barriers to exit: High
B2B
How to generate demand?
Leading enterprise
5% market share of industry
11% market share of domestic product
The strongest distributing network, with 12
subsidiaries, 24 franchises, 68 drugstores, export
to 13 countries.
Capital intensive: High
Labor intensive or a hybrid: Medium
Simple process
DHG Pharma is considered the largest and largest distribution system in the
country, with 36 branches distributing goods across the country from urban
to rural areas with 27,000 customers. The most value added of the firm is is
stage, because almost revenue of DHG Pharma comes from distribution,
concentrate in southern of Vietnam. DHG does not have retail stores but
mainly distributes to dealers, so that profit comes mainly from distribution
activities.
Hau Giang Pharmaceutical is forming a value chain quickly and optimally, building a
value chain of products from natural links of 04 houses: State - Scientific researchers -
Producers and Farmers, creating economic benefits and social benefits. The subsidiary
that supplies materials is Spivaha; carry out pharmaceutical production through two
factories in Hau Giang and Can Tho; self-printing, packaging production in Hau Giang;
opening Fuji Medic polyclinic; directly distributing through the distribution system of 36
branches distributed to over 25,000 customers, more than 500 hospitals across the
country, over 162 supermarkets, convenience stores and 3 major drugstores. The added
value of drug retail companies has not been expanded much due to the nature of the
industry, a small pharmaceutical company may be able to diversify types of production
drugs to retail in the market.
3. Economic attributes framework
Demand
Supply
ManufacturingMarketing
Investing &
Financing
Price sensitivity: Low
Demand: Growth
Non-cynical industry
Stable demand
Investment policy:
+CA: Cash, Inventory, Receivables
+NCA: Manufacturing
Financing match: Mainly depend on equity
and short-term => appropriate
No. of suppliers: Low
Barriers to entry: High
Barriers to exit: High
B2B
How to generate demand?
Leading enterprise
5% market share of industry
11% market share of domestic product
The strongest distributing network, with 12
subsidiaries, 24 franchises, 68 drugstores, export
to 13 countries.
Capital intensive: High
Labor intensive or a hybrid: Medium
Simple process
III) Identify the company strategy
+) Nature of product and services : DHG primary strategy is to be the VietNam leading
branded pharameutical company . Its products are narrowly focused on medicine and health
facilities. DHG relies on brand name to create recognition and to differentiate its products.
Because of differentiation,DHG is able to charge a premium price for its products. Because of
its brand name recognition, DHG is able to grow quickly by exporting products in mature and
new markets around the world (13 countries till now).
+) Degree of Intergration in value chain : The chain of DHG now is horizontal
intergration because 80% of raw materials is still imported from foreign countries, DHG only
control manufacuring process and distribution channel , especially DHG Pharma owns a
nationwide distribution system with 12 distribution subsidiaries and 24 branches, is invested
in buying land building houses, having GDP-qualified warehouses, distributing down to each
district and commune level. , hamlets of provinces and cities nationwide.
+) Degree of geographical diversification : DHG choose to export product to create
opportunity for growth. In particular, DHG Pharma's current export market includes 13
countries: Moldova, Ukraine, Myanmar, Russia, Mongolia, Cambodia, Nigeria, Laos,
Singapore, Jordan, Sri Lanka, Romania and North Korea. The main export products are the
key products of the Company and the herbal origin group with the strength of Vietnam's
natural herbal sources.
+ Degree of industry diversification : DHG is concentrated in public health industry
because they want to have a sustainable growth in one main industry and remain one of
leading brand in this.
In conclusion, operating in public health industry, the main mission of DHG is to provide
products that can support public benefits and health care for people, so differentiation is a
main business sector of the company. The reason that the company don’t make choice in
price strategy is the quality and effectiveness of products. In differentiation, the cost maybe
higher than the competitors choose pricing strategy, due to the expenditure that DHG spend
on R&D is high. So they can improve the effect of drugs, increase human life and prevent
diseases. In addition, DHG usually organize programs to show the importance of medical
care in the life. Beside of differentiation sector, DHG also take care of price sector. The
entity tries to produce drugs that have high quality but also in a low price to help people
with lower economic condition. DHG build more systems to administrate costs, apply
technology in production to reduce cost, train staff frequently to enhance their skills and
master the technology.
IV) Financial analysis
1) Analysis ROA with 3 levels
Level 1 : ROA for the firm as a whole
ROA 2016 2017 2018
DHG 19.51% 15.99% 15.7%
Public
health industry
7.06% 10.48% 10.05%
⊘ This is a preview!⊘
Do you want full access?
Subscribe today to unlock all pages.
Trusted by 1+ million students worldwide
- Overall, the ROA of the firm decreased in the period 2016-2018, but still greater than
average public health industry . So we discuss three elements of risk that are useful in
understanding differences in ROAs across firms and changes over time.
a) Product life cycle
- The product of DHG in VietNam market are in the mature stage, with largest expand
of operating profit and need only small outflow of investment. DHG benefits from
economic of scale with the ROA reach 19.51% in 2016, but most pharameutical
products experience product life cycles of approximately seven years and DHG has a
strategy to diversify through many countries with growth or shakeout stage lead to
ROA decreased in 2017 and 2018.
b) Cyclicality of sales
- The sales of DHG is less affected by economic conditions than others cyclical industries
such as computer or automoblies. The demand for most pharmaceuticals is relatively
price inelastic because customers need the drugs and because the cost of drugs is often
covered by insurance
Level 2 : Disaggregation of ROA into profit margin for ROA and assets
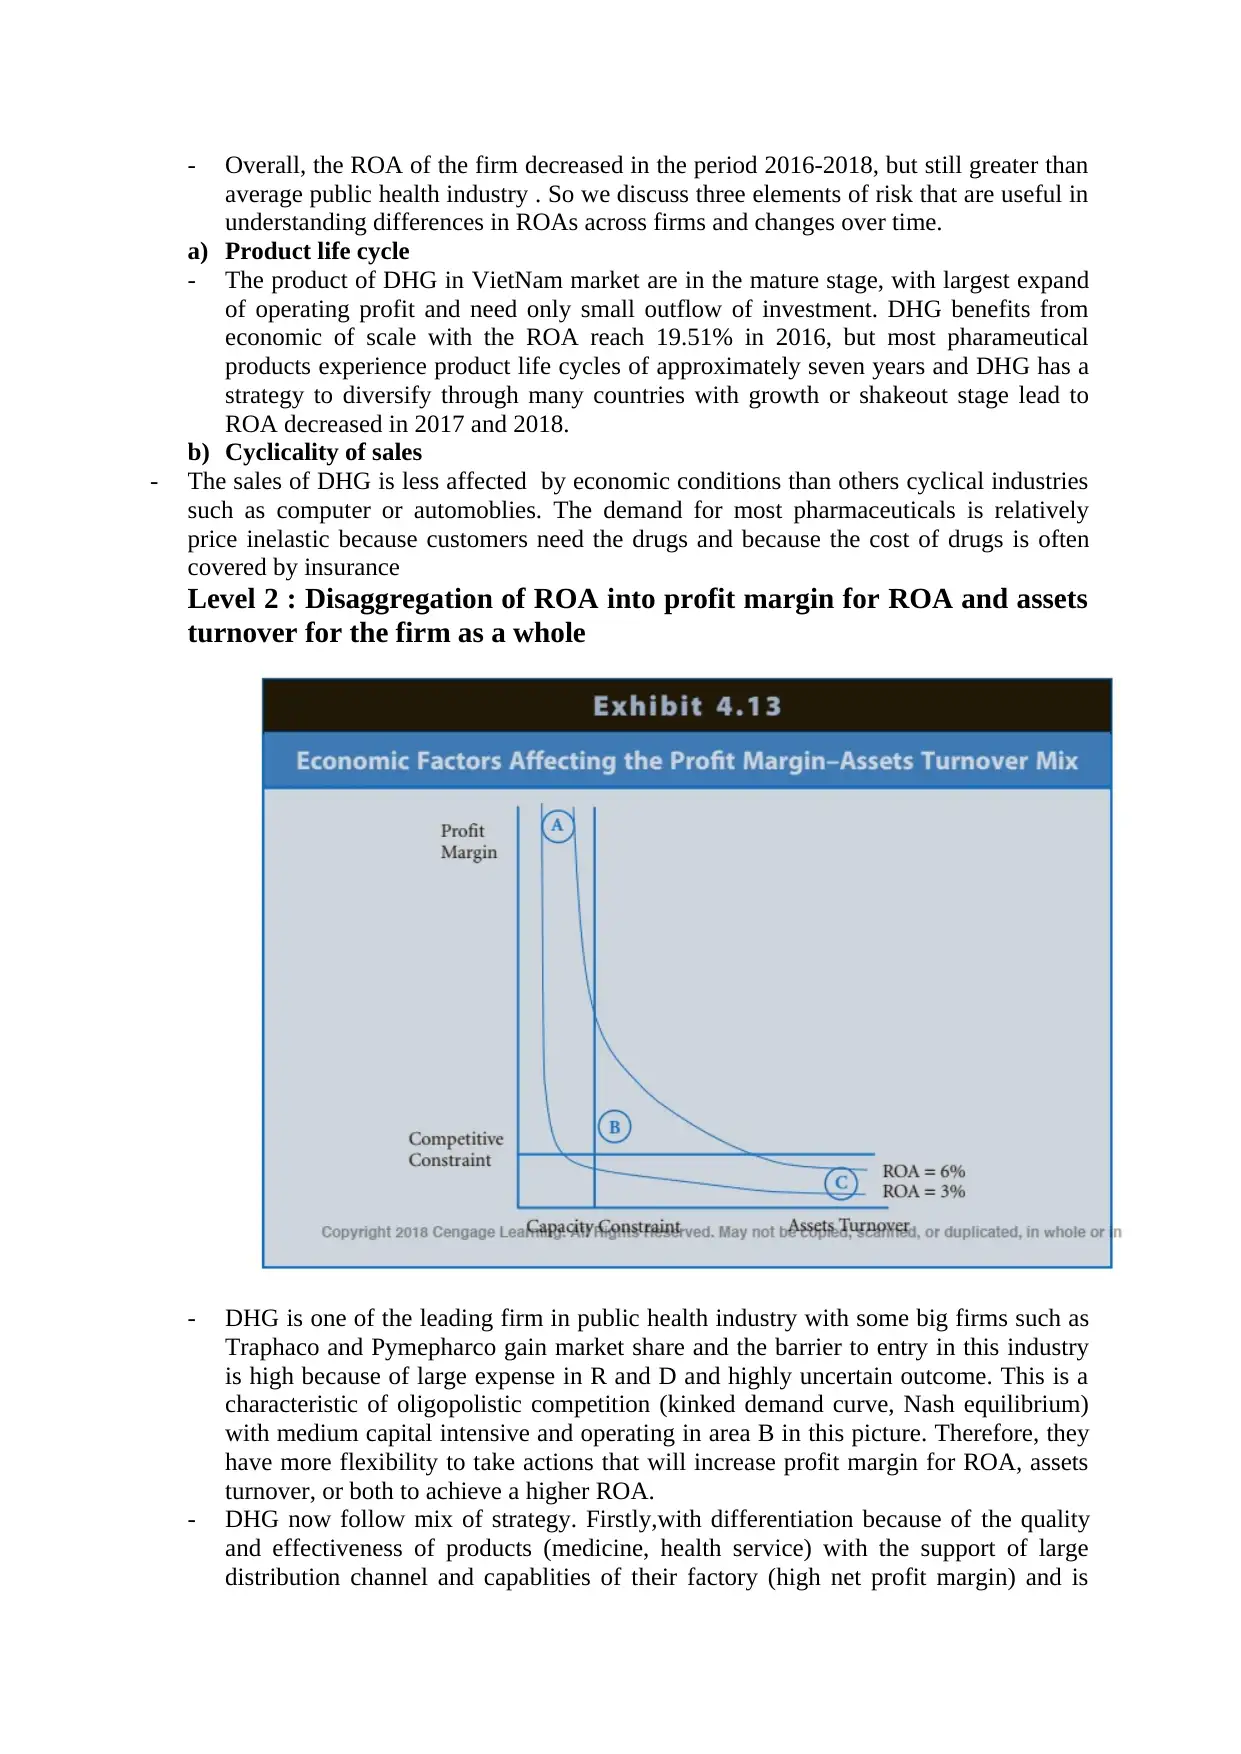
turnover for the firm as a whole
- DHG is one of the leading firm in public health industry with some big firms such as
Traphaco and Pymepharco gain market share and the barrier to entry in this industry
is high because of large expense in R and D and highly uncertain outcome. This is a
characteristic of oligopolistic competition (kinked demand curve, Nash equilibrium)
with medium capital intensive and operating in area B in this picture. Therefore, they
have more flexibility to take actions that will increase profit margin for ROA, assets
turnover, or both to achieve a higher ROA.
- DHG now follow mix of strategy. Firstly,with differentiation because of the quality
and effectiveness of products (medicine, health service) with the support of large
distribution channel and capablities of their factory (high net profit margin) and is
average public health industry . So we discuss three elements of risk that are useful in
understanding differences in ROAs across firms and changes over time.
a) Product life cycle
- The product of DHG in VietNam market are in the mature stage, with largest expand
of operating profit and need only small outflow of investment. DHG benefits from
economic of scale with the ROA reach 19.51% in 2016, but most pharameutical
products experience product life cycles of approximately seven years and DHG has a
strategy to diversify through many countries with growth or shakeout stage lead to
ROA decreased in 2017 and 2018.
b) Cyclicality of sales
- The sales of DHG is less affected by economic conditions than others cyclical industries
such as computer or automoblies. The demand for most pharmaceuticals is relatively
price inelastic because customers need the drugs and because the cost of drugs is often
covered by insurance
Level 2 : Disaggregation of ROA into profit margin for ROA and assets
turnover for the firm as a whole
- DHG is one of the leading firm in public health industry with some big firms such as
Traphaco and Pymepharco gain market share and the barrier to entry in this industry
is high because of large expense in R and D and highly uncertain outcome. This is a
characteristic of oligopolistic competition (kinked demand curve, Nash equilibrium)
with medium capital intensive and operating in area B in this picture. Therefore, they
have more flexibility to take actions that will increase profit margin for ROA, assets
turnover, or both to achieve a higher ROA.
- DHG now follow mix of strategy. Firstly,with differentiation because of the quality
and effectiveness of products (medicine, health service) with the support of large
distribution channel and capablities of their factory (high net profit margin) and is
Paraphrase This Document
Need a fresh take? Get an instant paraphrase of this document with our AI Paraphraser
their main strategy to gain sustainable growth rate . Secondly, with low cost
leadership strategy, entity tries to produce drugs that have high quality but also in a
low price to help people with lower economic condition, increase product efficiency
through reduce cost to gain economic of scale.
- The median ROA, profit margin for ROA, and assets turnover for this industry and
the average amounts for DHG for 2016 through 2018 are as follows :
Pharmaceutical and
medical industry
DHG
ROA 9.2% 17.07%
Net profit margin 8.5% 17.14%
Total asset turnover 1.1 0.99
Note that the average ROA of Starbucks significantly exceeds that for the public
health
industry because of higher profit margins for ROA. Possible economic or strategic
explanations for the higher profit margin for ROA include (1) more value to DHG
brand name than obtained by other pharmaceutical and medical firms, (2) greater
pricing power because of DHG’s lead position in the health industry. The lower of
asset turnover because many firm don’t have good position and large captial to invest
for R and D and mainly imported focused totally in price strategy lead to higher
average of asset turnover (1.1 >0.99).
Level 3a : Analyze the profit margin for ROA
2016 2017 2018
Gross revenue from
goods sold and services
rendered
100.00% 109.99
%
100.00
%
Deductions 8.93% 12.19% 12.20%
Net revenue from good
sold and services
rendered
91.07% 97.81% 87.80%
Cost of sale and services
rendered
49.83% 54.88% 48.97%
Gross profit from good
sokd and services
rendered
41.24% 42.93% 38.83%
Financial income 1.39% 2.14% 2.44%
Financial expenses 2.04% 2.35% 2.17%
Share of net losses from
joint-ventures, associates
0.00% -0.03% 0.00%
Selling expenses 15.21% 17.62% 16.39%
General and administation
expenses
7.16% 7.66% 6.46%
Operating profit 18.22% 17.39% 16.24%
Other income 0.36% 0.16% 0.41%
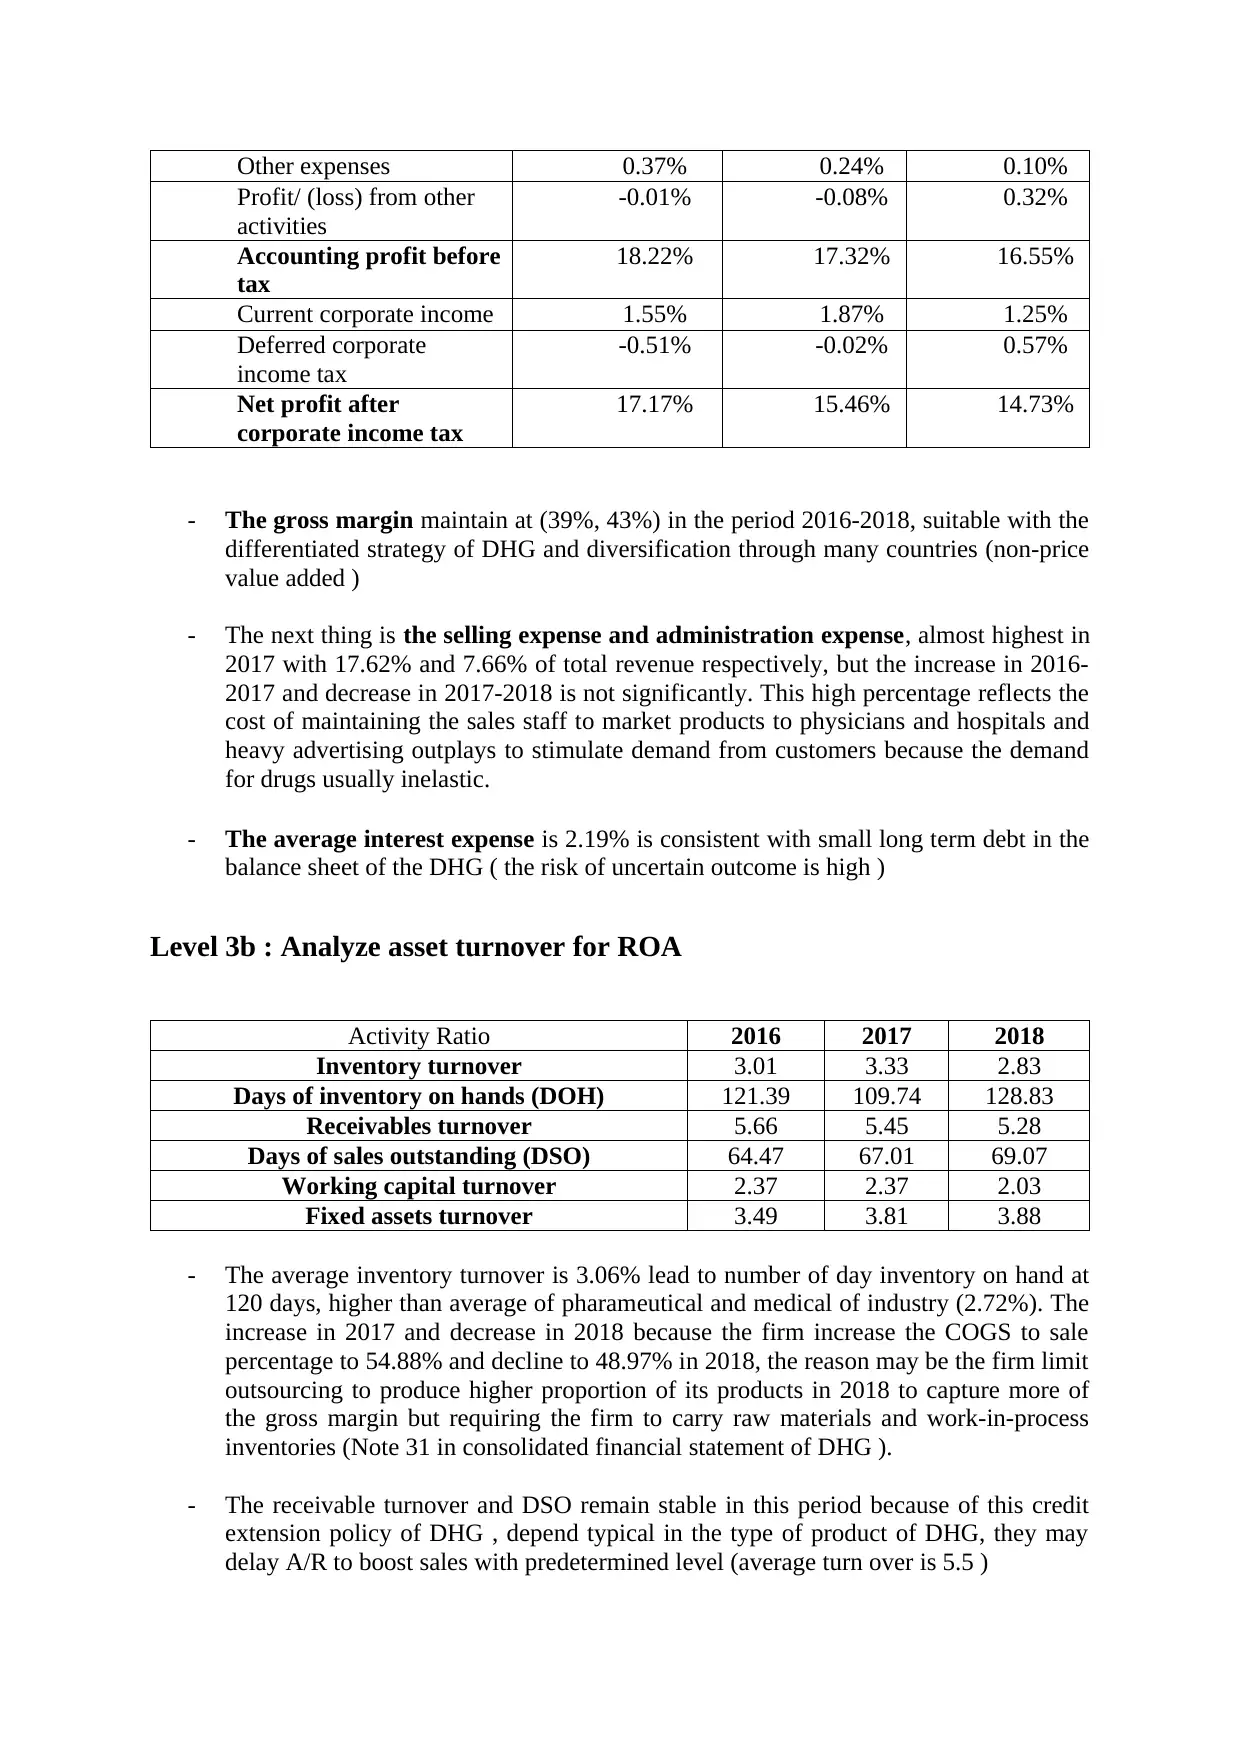
Other expenses 0.37% 0.24% 0.10%
Profit/ (loss) from other
activities
-0.01% -0.08% 0.32%
Accounting profit before
tax
18.22% 17.32% 16.55%
Current corporate income 1.55% 1.87% 1.25%
Deferred corporate
income tax
-0.51% -0.02% 0.57%
Net profit after
corporate income tax
17.17% 15.46% 14.73%
- The gross margin maintain at (39%, 43%) in the period 2016-2018, suitable with the
differentiated strategy of DHG and diversification through many countries (non-price
value added )
- The next thing is the selling expense and administration expense, almost highest in
2017 with 17.62% and 7.66% of total revenue respectively, but the increase in 2016-
2017 and decrease in 2017-2018 is not significantly. This high percentage reflects the
cost of maintaining the sales staff to market products to physicians and hospitals and
heavy advertising outplays to stimulate demand from customers because the demand
for drugs usually inelastic.
- The average interest expense is 2.19% is consistent with small long term debt in the
balance sheet of the DHG ( the risk of uncertain outcome is high )
Level 3b : Analyze asset turnover for ROA
Activity Ratio 2016 2017 2018
Inventory turnover 3.01 3.33 2.83
Days of inventory on hands (DOH) 121.39 109.74 128.83
Receivables turnover 5.66 5.45 5.28
Days of sales outstanding (DSO) 64.47 67.01 69.07
Working capital turnover 2.37 2.37 2.03
Fixed assets turnover 3.49 3.81 3.88
- The average inventory turnover is 3.06% lead to number of day inventory on hand at
120 days, higher than average of pharameutical and medical of industry (2.72%). The
increase in 2017 and decrease in 2018 because the firm increase the COGS to sale
percentage to 54.88% and decline to 48.97% in 2018, the reason may be the firm limit
outsourcing to produce higher proportion of its products in 2018 to capture more of
the gross margin but requiring the firm to carry raw materials and work-in-process
inventories (Note 31 in consolidated financial statement of DHG ).
- The receivable turnover and DSO remain stable in this period because of this credit
extension policy of DHG , depend typical in the type of product of DHG, they may
delay A/R to boost sales with predetermined level (average turn over is 5.5 )
⊘ This is a preview!⊘
Do you want full access?
Subscribe today to unlock all pages.
Trusted by 1+ million students worldwide
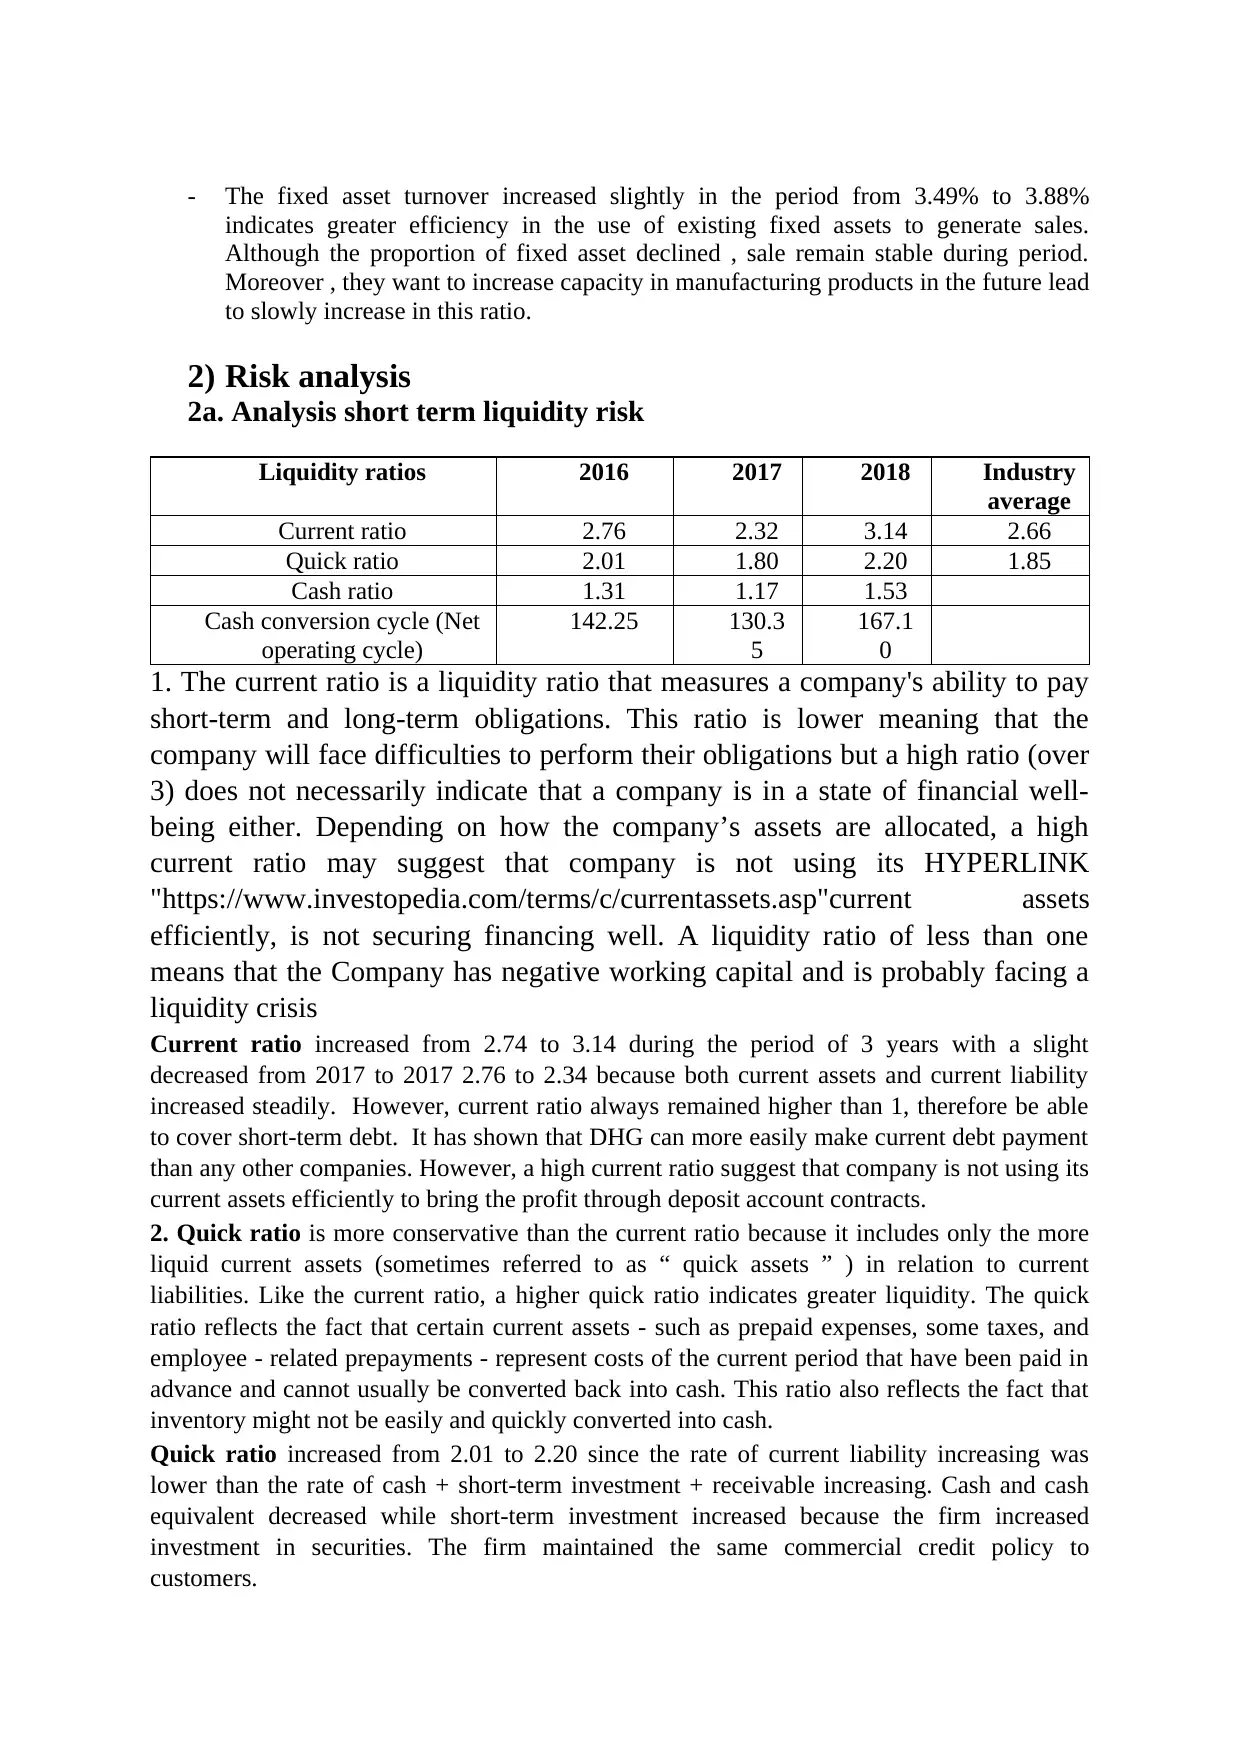
- The fixed asset turnover increased slightly in the period from 3.49% to 3.88%
indicates greater efficiency in the use of existing fixed assets to generate sales.
Although the proportion of fixed asset declined , sale remain stable during period.
Moreover , they want to increase capacity in manufacturing products in the future lead
to slowly increase in this ratio.
2) Risk analysis
2a. Analysis short term liquidity risk
Liquidity ratios 2016 2017 2018 Industry
average
Current ratio 2.76 2.32 3.14 2.66
Quick ratio 2.01 1.80 2.20 1.85
Cash ratio 1.31 1.17 1.53
Cash conversion cycle (Net
operating cycle)
142.25 130.3
5
167.1
0
1. The current ratio is a liquidity ratio that measures a company's ability to pay
short-term and long-term obligations. This ratio is lower meaning that the
company will face difficulties to perform their obligations but a high ratio (over
3) does not necessarily indicate that a company is in a state of financial well-
being either. Depending on how the company’s assets are allocated, a high
current ratio may suggest that company is not using its HYPERLINK
"https://www.investopedia.com/terms/c/currentassets.asp"current assets
efficiently, is not securing financing well. A liquidity ratio of less than one
means that the Company has negative working capital and is probably facing a
liquidity crisis
Current ratio increased from 2.74 to 3.14 during the period of 3 years with a slight
decreased from 2017 to 2017 2.76 to 2.34 because both current assets and current liability
increased steadily. However, current ratio always remained higher than 1, therefore be able
to cover short-term debt. It has shown that DHG can more easily make current debt payment
than any other companies. However, a high current ratio suggest that company is not using its
current assets efficiently to bring the profit through deposit account contracts.
2. Quick ratio is more conservative than the current ratio because it includes only the more
liquid current assets (sometimes referred to as “ quick assets ” ) in relation to current
liabilities. Like the current ratio, a higher quick ratio indicates greater liquidity. The quick
ratio reflects the fact that certain current assets - such as prepaid expenses, some taxes, and
employee - related prepayments - represent costs of the current period that have been paid in
advance and cannot usually be converted back into cash. This ratio also reflects the fact that
inventory might not be easily and quickly converted into cash.
Quick ratio increased from 2.01 to 2.20 since the rate of current liability increasing was
lower than the rate of cash + short-term investment + receivable increasing. Cash and cash
equivalent decreased while short-term investment increased because the firm increased
investment in securities. The firm maintained the same commercial credit policy to
customers.
Paraphrase This Document
Need a fresh take? Get an instant paraphrase of this document with our AI Paraphraser
3. The cash ratio normally represents a reliable measure of an individual entity ’s liquidity in
a crisis situation.
Cash ratio increased from 1.31 to 1.53 because market securities increased since the firm
increased investment in securities.
4. Cash conversion cycle increased from 142,25 days to 167,09 days since days of inventory
on hand increased which means storing inventories was not as good as compared to the past
few years. A longer cash conversion cycle indicates lower liquidity; it implies that the
company must finance its inventory and accounts receivable for a longer period of time,
possibly indicating a need for a higher level of capital to fund current assets .
2b. Analysis long-term solvency risk
Solvency Ratios 2016 2017 2018
Use of debt financing
Debt to equity (D/E) 0.12 0.17 0.18
Debt to capital (D/(D+E)) 0.11 0.15 0.15
Debt to assets (D/A) 0.09 0.11 0.13
Financial leverage ratio 1.35 1.42 1.40
Coverage ratio
Interest coverage (Times interest earned) 81.33 61.57 30.31
Debt to equity
Debt to equity showed an upward trend during the period, however, it increased slower from
2017 to 2018, at 0.17 and 0.18 respectively. This was because owner’s equity climbed up
again in 2018 after a slight decrease in the first two years. The higher debt to equity, the
higher debt DHG had used. This also consistent with strategy of pharameutical firm, with
high uncertainty in new products and changing of technology, so DHG still finance with low
leverage
More over, the changing of investment and development fund in long-term liabilities of DHG
is also considered. This can lead to boosting more debt or lower to reduce risk.
Interest coverage
Interest coverage decreased dramatically from 81.33 (in 2016) to 61.57 (in 2017), then surged
to 30.31 (in 2018). The reason is there were changes in interest expense throughout the
period. DHG might have faced with burdening situation by debt expense.
2c. Financial flexibility
Financial flexibility 2016 2017 2018
EBIT = EBT + I 710039670242.00 769149366458.00 743790260432.0
0
I 12492351845.00 24541141037.00 28523706808.00
D 312738317600.00 412282714231.50 513850663709.5
0
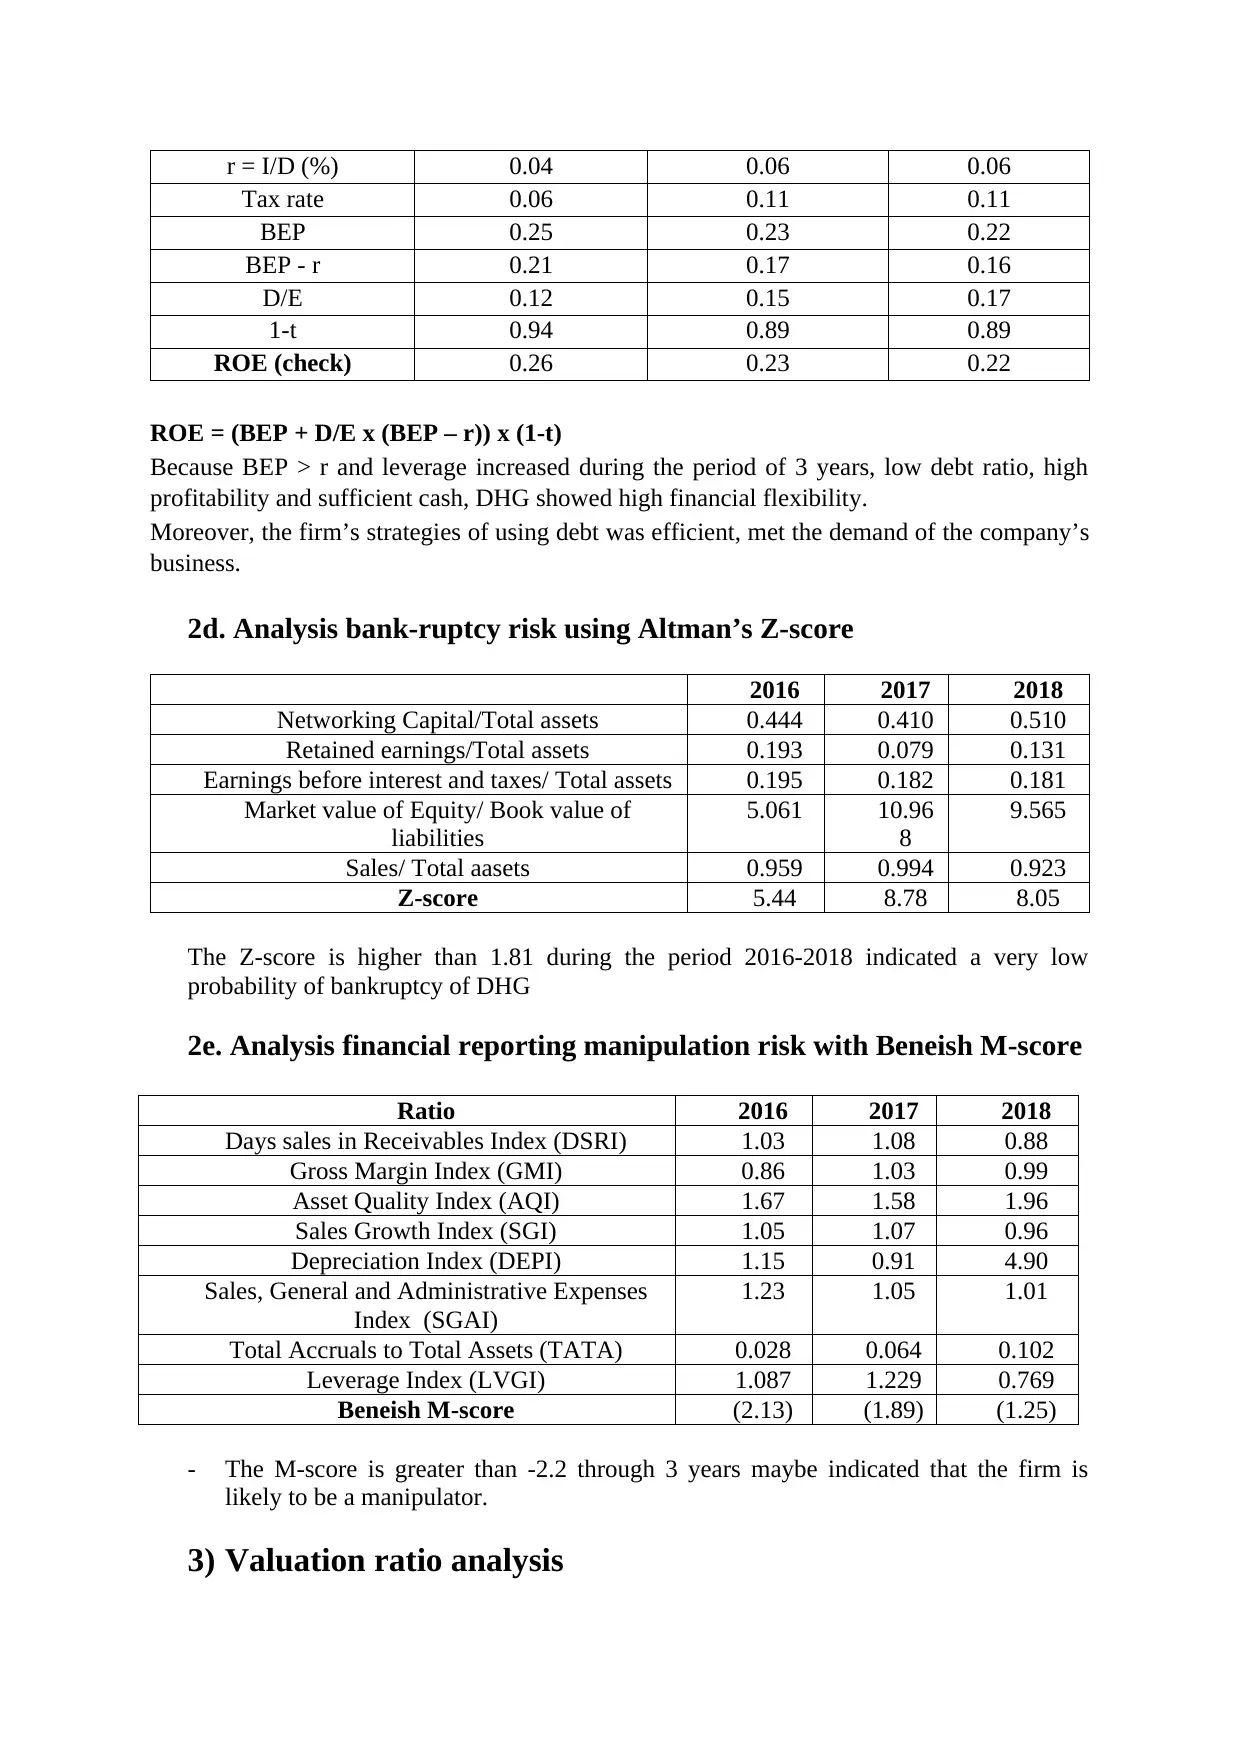
r = I/D (%) 0.04 0.06 0.06
Tax rate 0.06 0.11 0.11
BEP 0.25 0.23 0.22
BEP - r 0.21 0.17 0.16
D/E 0.12 0.15 0.17
1-t 0.94 0.89 0.89
ROE (check) 0.26 0.23 0.22
ROE = (BEP + D/E x (BEP – r)) x (1-t)
Because BEP > r and leverage increased during the period of 3 years, low debt ratio, high
profitability and sufficient cash, DHG showed high financial flexibility.
Moreover, the firm’s strategies of using debt was efficient, met the demand of the company’s
business.
2d. Analysis bank-ruptcy risk using Altman’s Z-score
2016 2017 2018
Networking Capital/Total assets 0.444 0.410 0.510
Retained earnings/Total assets 0.193 0.079 0.131
Earnings before interest and taxes/ Total assets 0.195 0.182 0.181
Market value of Equity/ Book value of
liabilities
5.061 10.96
8
9.565
Sales/ Total aasets 0.959 0.994 0.923
Z-score 5.44 8.78 8.05
The Z-score is higher than 1.81 during the period 2016-2018 indicated a very low
probability of bankruptcy of DHG
2e. Analysis financial reporting manipulation risk with Beneish M-score
Ratio 2016 2017 2018
Days sales in Receivables Index (DSRI) 1.03 1.08 0.88
Gross Margin Index (GMI) 0.86 1.03 0.99
Asset Quality Index (AQI) 1.67 1.58 1.96
Sales Growth Index (SGI) 1.05 1.07 0.96
Depreciation Index (DEPI) 1.15 0.91 4.90
Sales, General and Administrative Expenses
Index (SGAI)
1.23 1.05 1.01
Total Accruals to Total Assets (TATA) 0.028 0.064 0.102
Leverage Index (LVGI) 1.087 1.229 0.769
Beneish M-score (2.13) (1.89) (1.25)
- The M-score is greater than -2.2 through 3 years maybe indicated that the firm is
likely to be a manipulator.
3) Valuation ratio analysis
⊘ This is a preview!⊘
Do you want full access?
Subscribe today to unlock all pages.
Trusted by 1+ million students worldwide
1 out of 15

Your All-in-One AI-Powered Toolkit for Academic Success.
+13062052269
info@desklib.com
Available 24*7 on WhatsApp / Email
![[object Object]](/_next/static/media/star-bottom.7253800d.svg)
Unlock your academic potential
Copyright © 2020–2026 A2Z Services. All Rights Reserved. Developed and managed by ZUCOL.