Financial Modeling Report: Project Viability and Risk Assessment

Verified

Added on  2020/02/05

|13
|1902
|160
Report
AI Summary
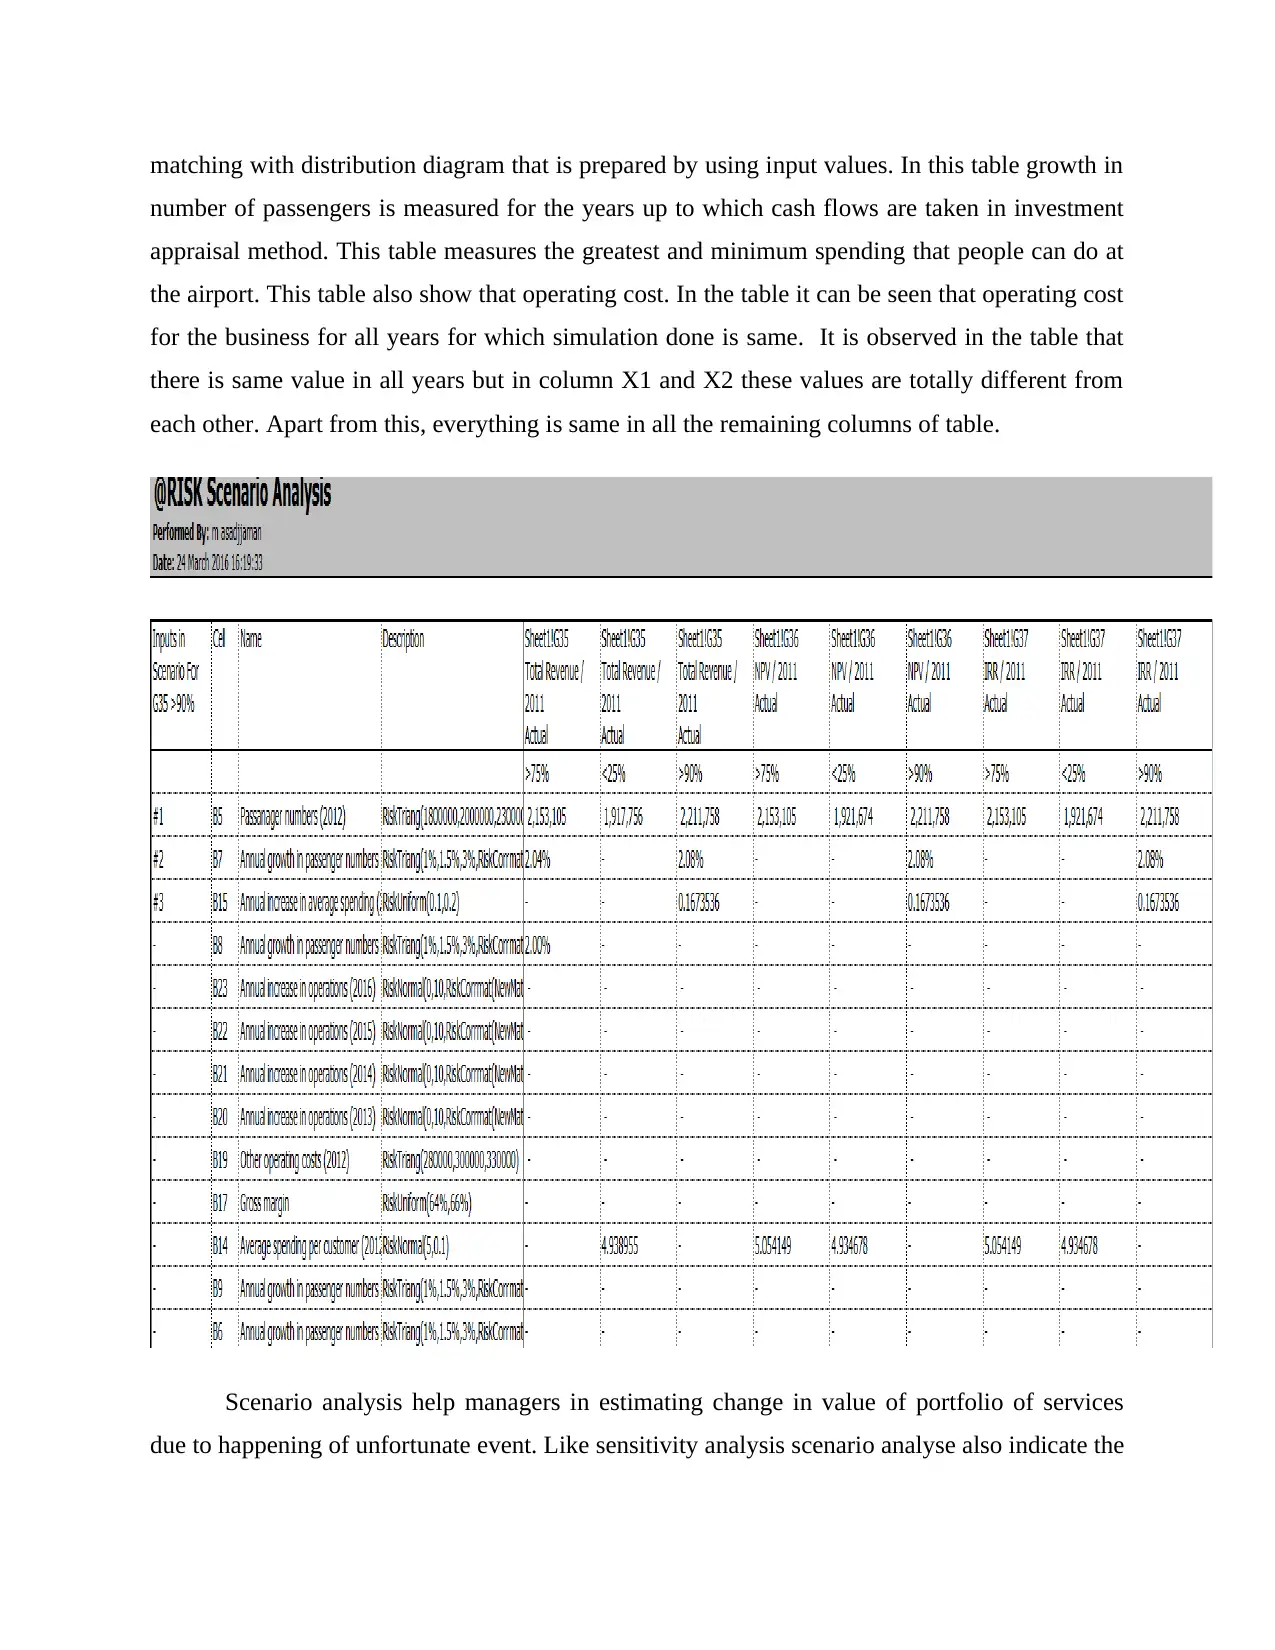
This report delves into financial modeling techniques, focusing on Net Present Value (NPV), Internal Rate of Return (IRR), and simulation methods for project evaluation and risk assessment. Part A presents a spreadsheet model to calculate NPV and IRR, providing insights into project viability. Part B explores simulation analysis using various distributions like normal, triangular, and uniform to assess project risks and sensitivities. The report explains the model's functionality, including the use of different distributions for variable analysis and the limitations of the model. The conclusion emphasizes the importance of financial modeling in making informed business decisions, highlighting the project's viability based on the positive NPV and increasing IRR. The report includes references to academic journals and online resources, supporting the analysis and conclusions drawn.
Document Page
FINANCIAL MODELING
tabler-icon-diamond-filled.svg

Paraphrase This Document

Need a fresh take? Get an instant paraphrase of this document with our AI Paraphraser
Document Page
TABLE OF CONTENT
INTRODUCTION...........................................................................................................................3
Part A...............................................................................................................................................3
Spreadsheet model to find Net Present Value and Internal rate of Return for the investment....3
Part B...............................................................................................................................................8
Simulation on proposed project...................................................................................................8
Explanation of what the model is doing....................................................................................11
Model limitations.......................................................................................................................11
CONCLUSION..............................................................................................................................12
REFERENCES..............................................................................................................................13
Document Page
INTRODUCTION
In today’s era, it is very difficult to make a sound business decision. In order to reduce
this complexity, simulation methods are used by the managers. In this report, various methods
like sensitive analysis and scenario analysis are used. Along with this, project evaluation is also
done in the report. Hence, it can be said that by using these methods, the best decision can be
made by the managers.
PART A
Spreadsheet model to find Net Present Value and Internal rate of Return for the investment
Figure 1: Risk output sheet
In this, attached image results of NPV and IRR are clearly given and help in taking
decision related to the viability of the project. On the basis of results produced by the above
given table we can see amount that firm may lose in its business. On the basis of projections
financial manager comers to know about the income that this project can be generate for the
firm. The above given chart shows the maximum, minimum and average return that a firm can
earn on the project during life time of the project. NPV measures the present value of the project
that remains after deducting initial investment from the present value of the cash flows (Zivot
and Wang, 2007). The cost of capital for project is 15% which is also discount rate used in the
project for computing present value of the cash flows. On the basis of results produced by the
NPV and IRR best viable can be selected by the firm. Thus, it can be said that this method help
Document Page
financial managers in selecting most viable project for the firm. IRR indicate the actual return
that a project can earn on the invested amount. The only difference between ARR and IRR is that
in former method calculation process is tough then latter method of project evaluation. By using
IRR managers can be best decisions related to project selection. The column which is labelled
with name P1 and P2 indicate the rate of x1 and x2. Output of calculation is both positive and
negative and more lower will be value of p1 more will be negative value of x1. In case of p2 its
higher value will result in greater value of result. On the basis of analysis of figures given in
table, it can be said that project is viable for the firm.
tabler-icon-diamond-filled.svg

Paraphrase This Document

Need a fresh take? Get an instant paraphrase of this document with our AI Paraphraser
Document Page
Document Page
Document Page
tabler-icon-diamond-filled.svg

Paraphrase This Document

Need a fresh take? Get an instant paraphrase of this document with our AI Paraphraser
Document Page
PART B
Simulation on proposed project
In this image given above, sensitive analysis of NPV and IRR is done for the entire
project life. In this report different distribution are used like normal distribution, triangular
distribution and uniform distribution. By using same from different sides project is evaluated.
These distributions indicate the maximum, average and minimum value of the project that is at
risk. These values are shown for each and every type of distribution. Sensitivity analysis is used
to measure changes that can take place in the specific variable with change in one variable. By
looking at the sensitive table manager get an idea about the likely changes in the value of
specific variable due to change in other variable (Andersen, Bollerslev and Diebold, 2007). The
predictions made by sensitive analysis help managers in making sound business decisions. This
is because; there is tolerance level that manager decides related to the specific variable. Manager
will use that tolerance level for in order to identify the limit up to which he can accept changes in
Document Page
the specific variable. In the given table values of correlation is given for different factors and by
using values of correlation impact of input on output can be determined easily. Means that by
using value of correlation the extent to which specific input can affect output is measured in
systematic way (Example models, 2016). Thus, it can be said that along with sensitive analysis
correlation is an important technique that can be used by the managers in order to identify impact
on one variable if other variable value get changed with passage of time. Hence, it can be said
that both sensitive analysis and correlation have a due importance for the managers.
In the above image, all the inputs that are used in simulation process are shown in tabular
form. It helps financial manager of the firm to check outcome of the simulated values by
Document Page
matching with distribution diagram that is prepared by using input values. In this table growth in
number of passengers is measured for the years up to which cash flows are taken in investment
appraisal method. This table measures the greatest and minimum spending that people can do at
the airport. This table also show that operating cost. In the table it can be seen that operating cost
for the business for all years for which simulation done is same. It is observed in the table that
there is same value in all years but in column X1 and X2 these values are totally different from
each other. Apart from this, everything is same in all the remaining columns of table.
Scenario analysis help managers in estimating change in value of portfolio of services
due to happening of unfortunate event. Like sensitivity analysis scenario analyse also indicate the
tabler-icon-diamond-filled.svg

Paraphrase This Document

Need a fresh take? Get an instant paraphrase of this document with our AI Paraphraser
Document Page
type of distribution that are used in calculation. Three rates are used for conducting analysis
namely 25%, 75% and 90%. By using these values entire calculation is done in the report.
Explanation of what the model is doing
In the discussion on model inputs, four different types of distributions are used. These
distributions are used to identify the rates and values of specific variables. On different types of
distributions like nominal and uniform, there are distinct probabilities of occurrence of outcomes.
It has been observed that probability distribution is better than other type of distributions. The
first distribution that is used in the report is probability distribution which helps in measuring
uncertainty in all the variables of risk analysis (Bielecki and Rutkowski, 2013).
Normal distribution indicates the mean value of variable and standard deviation in the
variable value from mean. In table, values that are nearby to the mean value have higher
probability of occurrence. Price of base metals and other financial instruments are used for
evaluation by using normal distribution curve.
The triangular distribution is also used in the diagram and it describes minimum, most
likely and maximum values. The values that are put in the formula under category most likely
will have higher probability of occurrence. This type of distribution is used to measure inventory
level which has minimum level and maximum level as well as average level that an organization
always have in its stock.
The last distribution in this model is binomial distribution which prepares the chances of
success of probability p of n independent trail of the specific variable. This distribution method is
used for solving many types of problems. This type of distribution has formula, that is, Binomial (n,
p) + Binomial (m, p) = Binomial (n+m,p) which is used by assuming that n and m are the two
independent binomial trials which have the same probability of success.
Model limitations
The main limitation of this model is that everyone can not apply this model. Only person
that have good knowledge can apply this model (Wilmott, 2013). Hence, it can be said that this
technique is very complex and it is its main limitation. @risk is an add-in which is equipped with
occurrence monitoring facility. This is used to evaluate the steadiness in the output distributions
in simulation. One of the main limitations of this method is that value of statistics tool reaches
their convergence tolerance confidence level. In this model, when output distribution becomes
Document Page
stable with consistency in values, big change is not observed in case of summary statistics. In the
report, default convergence tolerance rate is 3% and confidence level for distribution is 95%
which means that there is 95% chance of occurrence of output in the simulation model and the
computed mean is 3%. If simulation is done on auto stop mode then risk add-in will run
simulation until output values of simulation model are converged. Thus, the major limitation of
this model is that if there will be higher input and output value then distribution will be skewed
in nature and it will take long time for convergence.
CONCLUSION
On the basis of above discussion, it is concluded that managers must different financial
modeling techniques in order to select most viable project for the business. By using these
methods various aspects of project can be measured and good decision can be taken by the
manager. It is concluded that project is viable and financial manager must select this project for
the firm. This is because; outcome of NPV is £52326030 which is more than shown £15762250
by NPV. Firm is also facing loss in the starting year of this project up to £14562200. IRR for £
15762250 is 20% and for £ 52326030, it is 30%. Hence, values clearly indicate that with passage
of time, rate of return on this project has been increased. On this basis, project is assumed to be
viable for the firm.
chevron_up_icon
1 out of 13
circle_padding
hide_on_mobile
zoom_out_icon
[object Object]