Intermediate Financial Reporting: M&S Plc Performance Analysis
VerifiedAdded on 2021/01/01
|15
|2998
|300
Report
AI Summary
This report provides a comprehensive financial analysis of Marks & Spencer Plc (M&S) over a three-year period, focusing on key performance indicators. The analysis includes a detailed examination of profitability ratios (ROCE, ROE, asset turnover, gross profit margin, and net profit margin), liquidity ratios (current ratio and quick ratio), management ratios (inventory turnover, trade receivables collection period, and trade payables payment period), solvency ratios (debt to equity, debt to capital employed, and interest cover ratio), and investment ratios (EPS, P/E ratio, earning yield and dividend cover). The report interprets the trends and implications of each ratio, offering insights into the company's financial health, efficiency, and ability to meet its obligations. Furthermore, it explores cash flow and share price movements, providing a holistic view of M&S Plc's financial performance and position within the retail sector. The report also considers the competitive environment and its impact on the company's financial outcomes, offering recommendations for improvement.
INTERMEDIATE FINANCIAL
REPORTING
REPORTING
Paraphrase This Document
Need a fresh take? Get an instant paraphrase of this document with our AI Paraphraser
Abstract
The financial statements are to be analysed so that performance can be analysed. M&S
Plc will be analysed on the basis of profitability, liquidity, solvency, efficiency, management and
shareholder positions for last three years. The share price movements along with cash flows
movements will be identified as well. Hence, financial position of organisation will be analysed.
TABLE OF CONTENTS
INTRODUCTION...........................................................................................................................1
MAIN BODY...................................................................................................................................1
Analysing financial performance of Marks & Spencer Plc for last three years..........................1
1. Profitability (Refer Appendix 1).............................................................................................1
2. Liquidity (Refer Appendix 2)..................................................................................................2
3. Management (Refer Appendix 3)............................................................................................3
4. Solvency (Refer Appendix 4)..................................................................................................4
5. Investment (Refer Appendix 5)...............................................................................................4
6. Cash Flow movement over the years......................................................................................5
7. Share Price movement and performance.................................................................................8
CONCLUSION................................................................................................................................9
REFERENCES..............................................................................................................................10
APPENDIX....................................................................................................................................11
1. Profitability Ratios................................................................................................................11
2. Liquidity Ratios.....................................................................................................................11
3. Management Ratios...............................................................................................................11
4. Solvency Ratios.....................................................................................................................12
5. Investment Ratios..................................................................................................................12
⊘ This is a preview!⊘
Do you want full access?
Subscribe today to unlock all pages.
Trusted by 1+ million students worldwide
INTRODUCTION
Financial analysis is vital aspect for assessing overall financial position of company.
Present report deals with M&S Plc, giant in retail sector of the UK having worldwide operations
which will be analysed regarding its past three years' performance on the basis of ratio analysis.
Several ratios will be computed for getting clear picture whether corporate is adequately
performing or not. On the other side, cash flow movements for past years will be analysed. Share
prices movements and performance in the market will be identified through historical share
prices included by preparing area chart. Thus, overall performance of organisation will be
analysed for providing better aspect to stakeholders for taking decisions.
MAIN BODY
Analysing financial performance of Marks & Spencer Plc for last three years
1. Profitability (Refer Appendix 1)
Interpretation-
The profitability ratios are computed which provides clarity regarding the position of
M&S Plc for last three years. ROCE was 10.44 % in 2014 which decreased to 9.86 % in 2015
and further minimised to 7.68 % in 2016 showing that firm is unable to utilise assets for getting
operating profits in effective manner. On the other hand, ROE is another useful ratio implying
how investment made by shareholders are utilised by company up to a great extent. The ratio
was 20.14 % in 2014, reduced to 16.47 % in 2015 and further decreased to 12.25 %. This shows
that M&S Plc is not effectively using equity for getting higher net profits. While, Asset turnover
ratio is also calculated for showing how effectively average assets are utilised for garnering sales
in the best manner possible. Higher the ratio, better for organisation. Ratio was 1.33 % in 2014
which decreased to 1.28 % in next year and reached 1.27 % highlighting that organisation is not
using assets adequately to generate sales (Annual Report of Marks and Spencer Group Plc. 2014-
15. 2015).
It can be analysed that M&S Plc had low asset turnover ratio which it should take care
into account and properly utilise its assets for producing sales in a better manner. This will
provide it with higher sales and assets will offer higher sales quite effectually. On the other hand,
gross profit ratio is also being calculated showing that figure was 37.50 % in 2014 which
increased to 38.70 % in the year 2015. Furthermore, it climbed to 39.10 % in later year showing
that organisation is properly analysing expenses and reducing it for maximising gross profits.
1
Paraphrase This Document
Need a fresh take? Get an instant paraphrase of this document with our AI Paraphraser
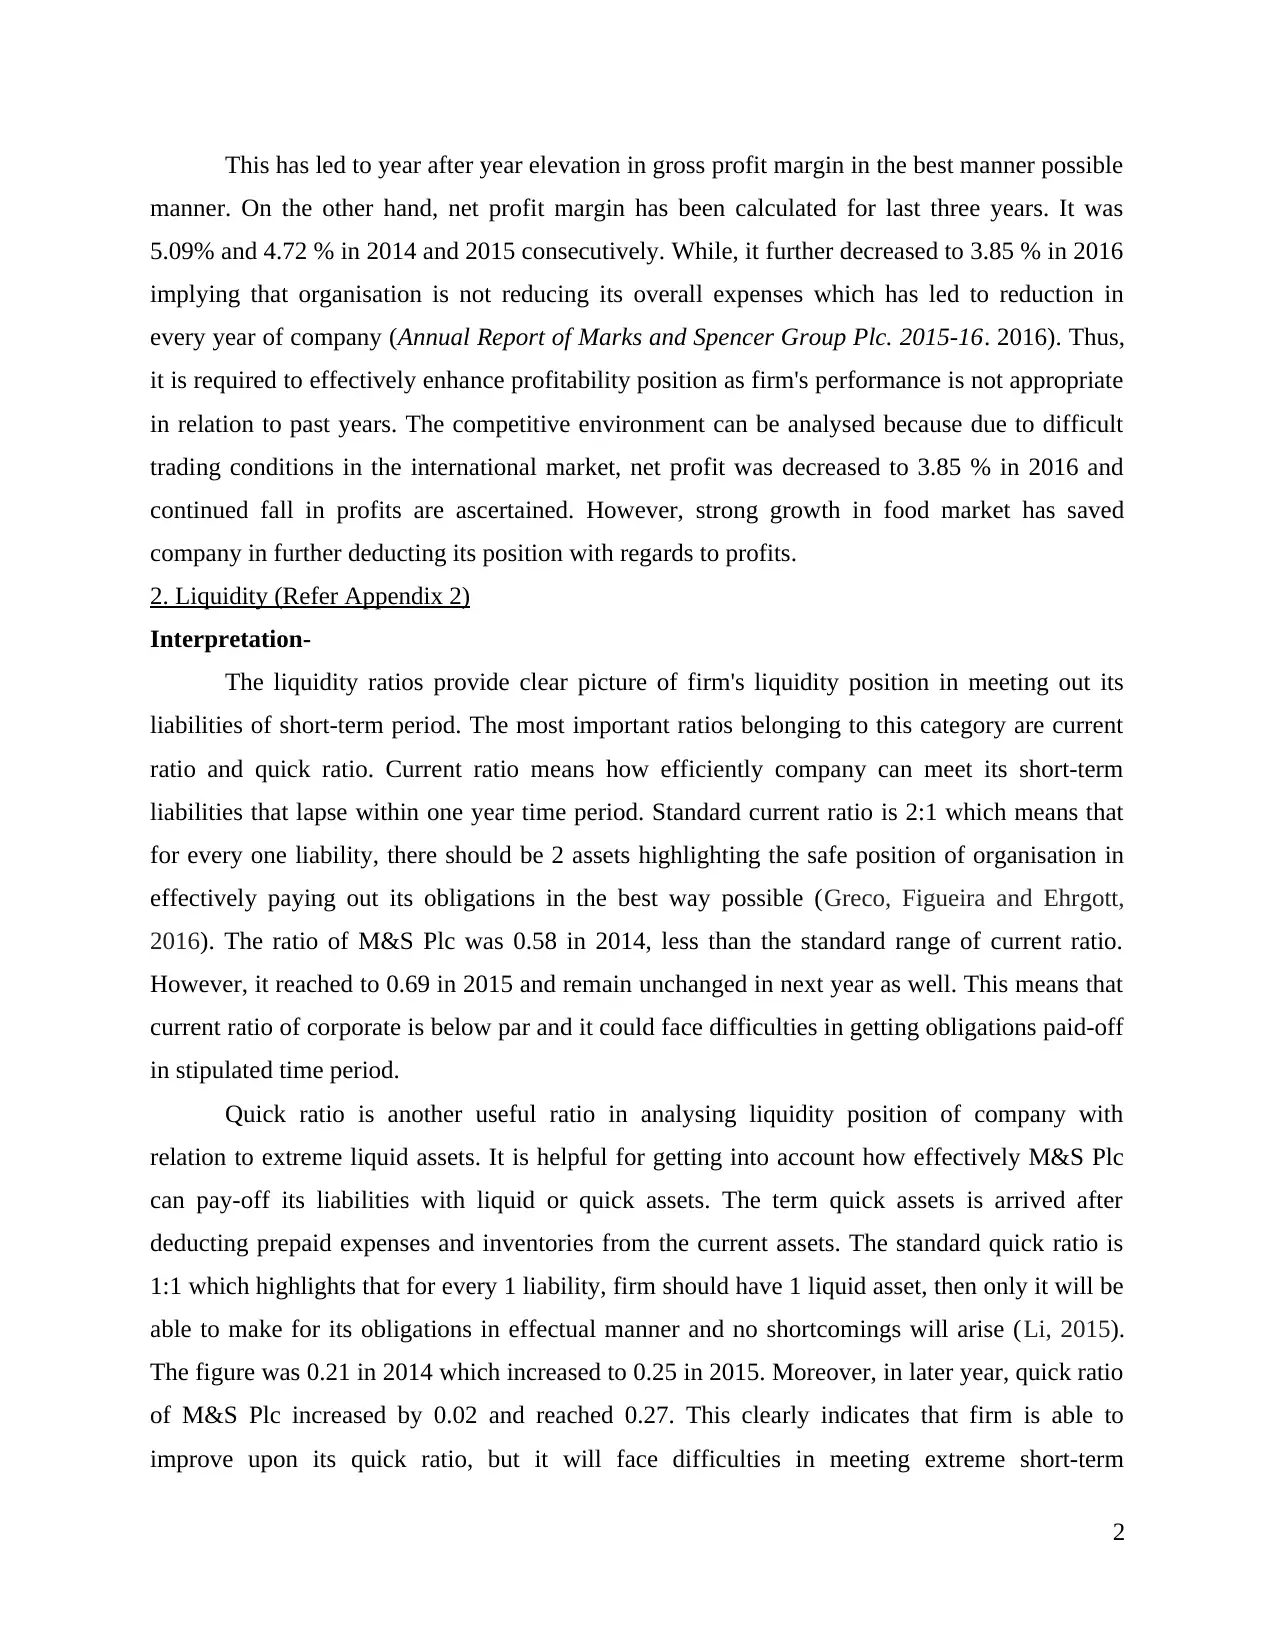
This has led to year after year elevation in gross profit margin in the best manner possible
manner. On the other hand, net profit margin has been calculated for last three years. It was
5.09% and 4.72 % in 2014 and 2015 consecutively. While, it further decreased to 3.85 % in 2016
implying that organisation is not reducing its overall expenses which has led to reduction in
every year of company (Annual Report of Marks and Spencer Group Plc. 2015-16. 2016). Thus,
it is required to effectively enhance profitability position as firm's performance is not appropriate
in relation to past years. The competitive environment can be analysed because due to difficult
trading conditions in the international market, net profit was decreased to 3.85 % in 2016 and
continued fall in profits are ascertained. However, strong growth in food market has saved
company in further deducting its position with regards to profits.
2. Liquidity (Refer Appendix 2)
Interpretation-
The liquidity ratios provide clear picture of firm's liquidity position in meeting out its
liabilities of short-term period. The most important ratios belonging to this category are current
ratio and quick ratio. Current ratio means how efficiently company can meet its short-term
liabilities that lapse within one year time period. Standard current ratio is 2:1 which means that
for every one liability, there should be 2 assets highlighting the safe position of organisation in
effectively paying out its obligations in the best way possible (Greco, Figueira and Ehrgott,
2016). The ratio of M&S Plc was 0.58 in 2014, less than the standard range of current ratio.
However, it reached to 0.69 in 2015 and remain unchanged in next year as well. This means that
current ratio of corporate is below par and it could face difficulties in getting obligations paid-off
in stipulated time period.
Quick ratio is another useful ratio in analysing liquidity position of company with
relation to extreme liquid assets. It is helpful for getting into account how effectively M&S Plc
can pay-off its liabilities with liquid or quick assets. The term quick assets is arrived after
deducting prepaid expenses and inventories from the current assets. The standard quick ratio is
1:1 which highlights that for every 1 liability, firm should have 1 liquid asset, then only it will be
able to make for its obligations in effectual manner and no shortcomings will arise (Li, 2015).
The figure was 0.21 in 2014 which increased to 0.25 in 2015. Moreover, in later year, quick ratio
of M&S Plc increased by 0.02 and reached 0.27. This clearly indicates that firm is able to
improve upon its quick ratio, but it will face difficulties in meeting extreme short-term
2
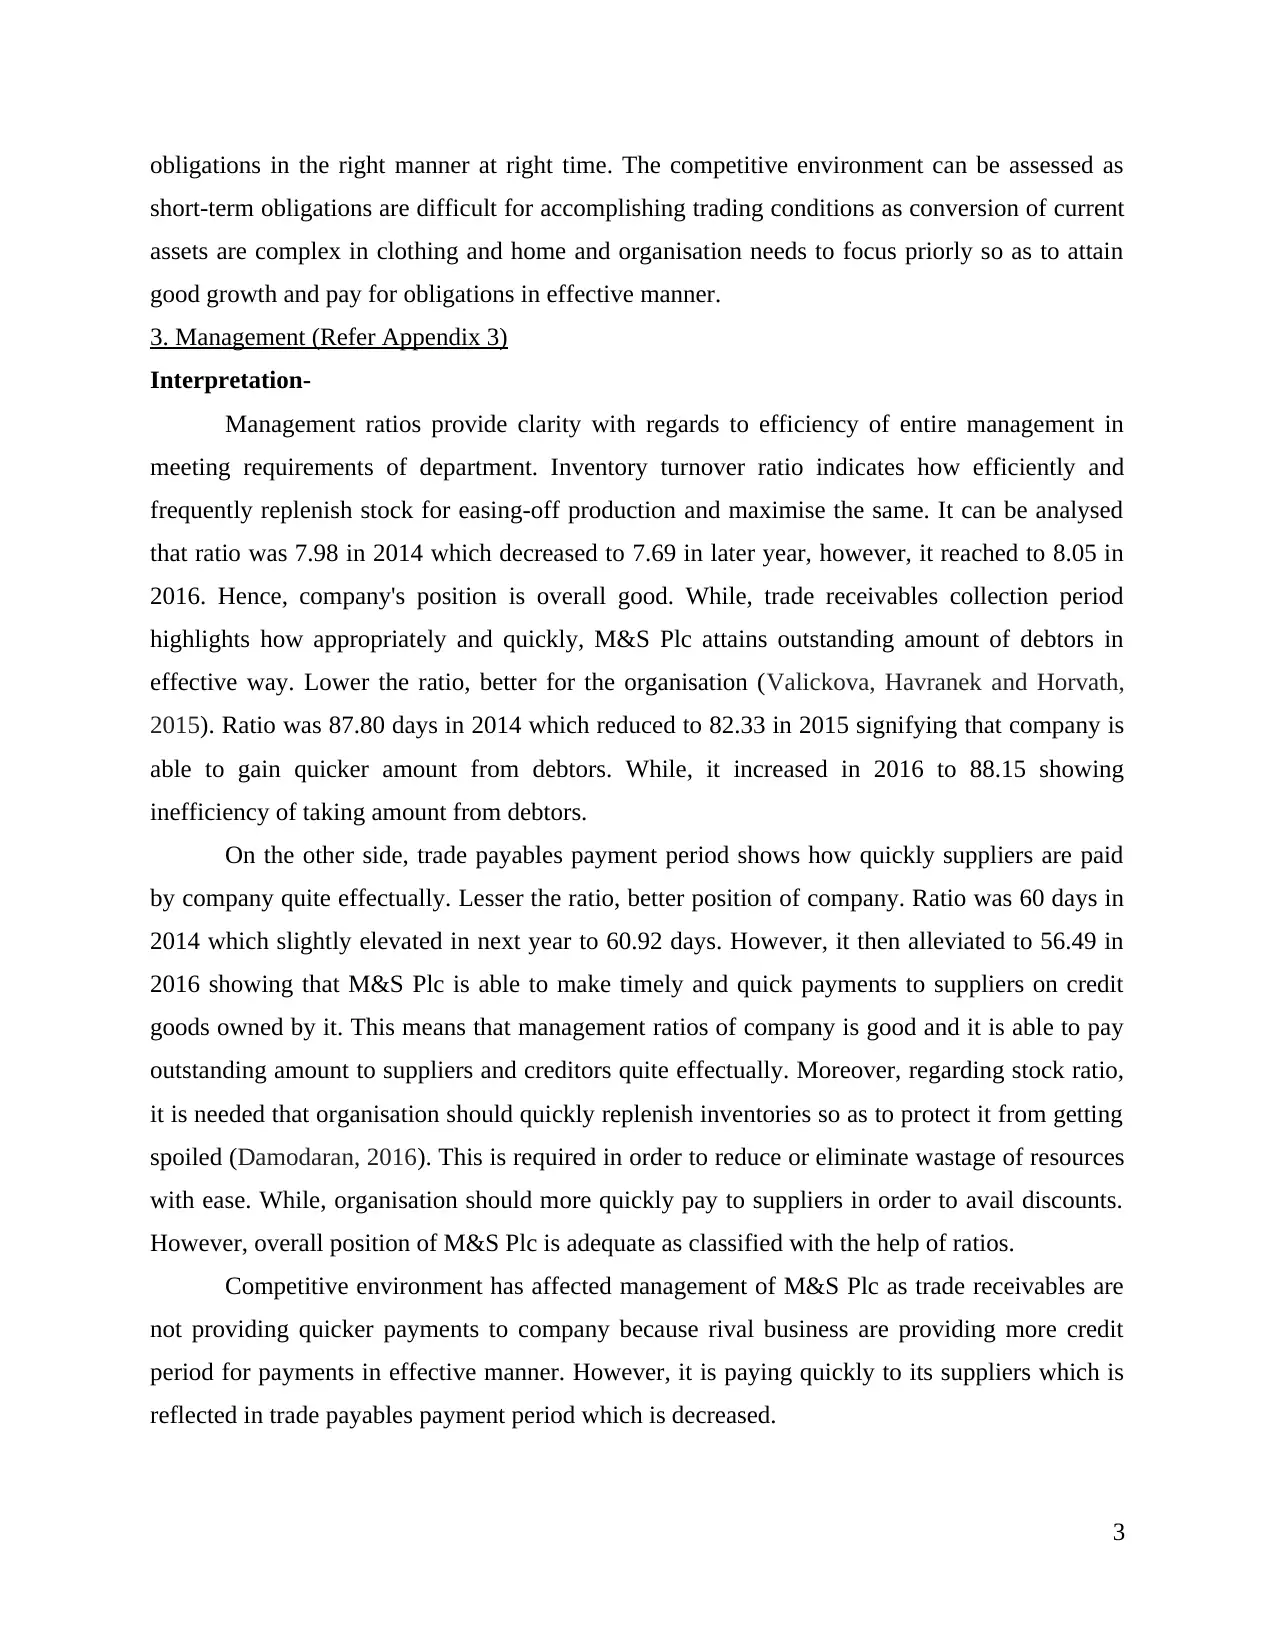
obligations in the right manner at right time. The competitive environment can be assessed as
short-term obligations are difficult for accomplishing trading conditions as conversion of current
assets are complex in clothing and home and organisation needs to focus priorly so as to attain
good growth and pay for obligations in effective manner.
3. Management (Refer Appendix 3)
Interpretation-
Management ratios provide clarity with regards to efficiency of entire management in
meeting requirements of department. Inventory turnover ratio indicates how efficiently and
frequently replenish stock for easing-off production and maximise the same. It can be analysed
that ratio was 7.98 in 2014 which decreased to 7.69 in later year, however, it reached to 8.05 in
2016. Hence, company's position is overall good. While, trade receivables collection period
highlights how appropriately and quickly, M&S Plc attains outstanding amount of debtors in
effective way. Lower the ratio, better for the organisation (Valickova, Havranek and Horvath,
2015). Ratio was 87.80 days in 2014 which reduced to 82.33 in 2015 signifying that company is
able to gain quicker amount from debtors. While, it increased in 2016 to 88.15 showing
inefficiency of taking amount from debtors.
On the other side, trade payables payment period shows how quickly suppliers are paid
by company quite effectually. Lesser the ratio, better position of company. Ratio was 60 days in
2014 which slightly elevated in next year to 60.92 days. However, it then alleviated to 56.49 in
2016 showing that M&S Plc is able to make timely and quick payments to suppliers on credit
goods owned by it. This means that management ratios of company is good and it is able to pay
outstanding amount to suppliers and creditors quite effectually. Moreover, regarding stock ratio,
it is needed that organisation should quickly replenish inventories so as to protect it from getting
spoiled (Damodaran, 2016). This is required in order to reduce or eliminate wastage of resources
with ease. While, organisation should more quickly pay to suppliers in order to avail discounts.
However, overall position of M&S Plc is adequate as classified with the help of ratios.
Competitive environment has affected management of M&S Plc as trade receivables are
not providing quicker payments to company because rival business are providing more credit
period for payments in effective manner. However, it is paying quickly to its suppliers which is
reflected in trade payables payment period which is decreased.
3
⊘ This is a preview!⊘
Do you want full access?
Subscribe today to unlock all pages.
Trusted by 1+ million students worldwide
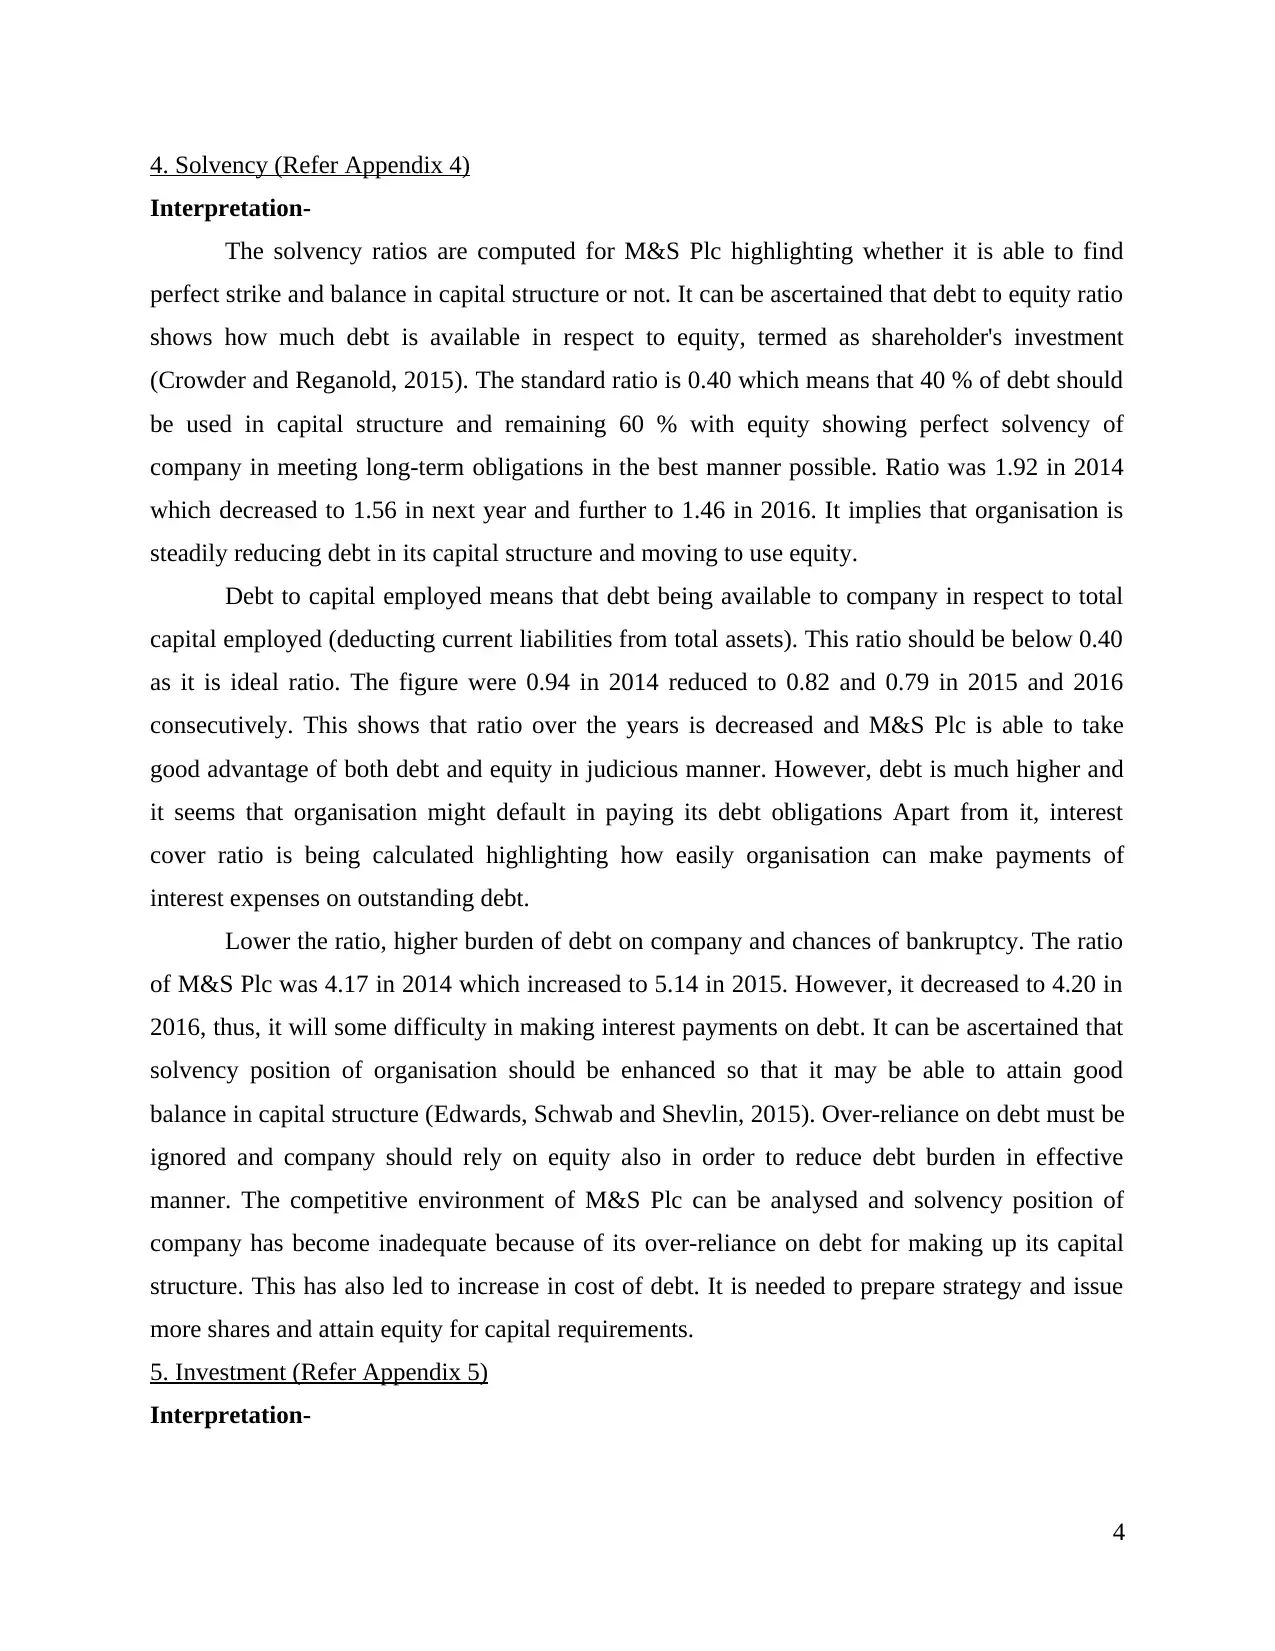
4. Solvency (Refer Appendix 4)
Interpretation-
The solvency ratios are computed for M&S Plc highlighting whether it is able to find
perfect strike and balance in capital structure or not. It can be ascertained that debt to equity ratio
shows how much debt is available in respect to equity, termed as shareholder's investment
(Crowder and Reganold, 2015). The standard ratio is 0.40 which means that 40 % of debt should
be used in capital structure and remaining 60 % with equity showing perfect solvency of
company in meeting long-term obligations in the best manner possible. Ratio was 1.92 in 2014
which decreased to 1.56 in next year and further to 1.46 in 2016. It implies that organisation is
steadily reducing debt in its capital structure and moving to use equity.
Debt to capital employed means that debt being available to company in respect to total
capital employed (deducting current liabilities from total assets). This ratio should be below 0.40
as it is ideal ratio. The figure were 0.94 in 2014 reduced to 0.82 and 0.79 in 2015 and 2016
consecutively. This shows that ratio over the years is decreased and M&S Plc is able to take
good advantage of both debt and equity in judicious manner. However, debt is much higher and
it seems that organisation might default in paying its debt obligations Apart from it, interest
cover ratio is being calculated highlighting how easily organisation can make payments of
interest expenses on outstanding debt.
Lower the ratio, higher burden of debt on company and chances of bankruptcy. The ratio
of M&S Plc was 4.17 in 2014 which increased to 5.14 in 2015. However, it decreased to 4.20 in
2016, thus, it will some difficulty in making interest payments on debt. It can be ascertained that
solvency position of organisation should be enhanced so that it may be able to attain good
balance in capital structure (Edwards, Schwab and Shevlin, 2015). Over-reliance on debt must be
ignored and company should rely on equity also in order to reduce debt burden in effective
manner. The competitive environment of M&S Plc can be analysed and solvency position of
company has become inadequate because of its over-reliance on debt for making up its capital
structure. This has also led to increase in cost of debt. It is needed to prepare strategy and issue
more shares and attain equity for capital requirements.
5. Investment (Refer Appendix 5)
Interpretation-
4
Interpretation-
The solvency ratios are computed for M&S Plc highlighting whether it is able to find
perfect strike and balance in capital structure or not. It can be ascertained that debt to equity ratio
shows how much debt is available in respect to equity, termed as shareholder's investment
(Crowder and Reganold, 2015). The standard ratio is 0.40 which means that 40 % of debt should
be used in capital structure and remaining 60 % with equity showing perfect solvency of
company in meeting long-term obligations in the best manner possible. Ratio was 1.92 in 2014
which decreased to 1.56 in next year and further to 1.46 in 2016. It implies that organisation is
steadily reducing debt in its capital structure and moving to use equity.
Debt to capital employed means that debt being available to company in respect to total
capital employed (deducting current liabilities from total assets). This ratio should be below 0.40
as it is ideal ratio. The figure were 0.94 in 2014 reduced to 0.82 and 0.79 in 2015 and 2016
consecutively. This shows that ratio over the years is decreased and M&S Plc is able to take
good advantage of both debt and equity in judicious manner. However, debt is much higher and
it seems that organisation might default in paying its debt obligations Apart from it, interest
cover ratio is being calculated highlighting how easily organisation can make payments of
interest expenses on outstanding debt.
Lower the ratio, higher burden of debt on company and chances of bankruptcy. The ratio
of M&S Plc was 4.17 in 2014 which increased to 5.14 in 2015. However, it decreased to 4.20 in
2016, thus, it will some difficulty in making interest payments on debt. It can be ascertained that
solvency position of organisation should be enhanced so that it may be able to attain good
balance in capital structure (Edwards, Schwab and Shevlin, 2015). Over-reliance on debt must be
ignored and company should rely on equity also in order to reduce debt burden in effective
manner. The competitive environment of M&S Plc can be analysed and solvency position of
company has become inadequate because of its over-reliance on debt for making up its capital
structure. This has also led to increase in cost of debt. It is needed to prepare strategy and issue
more shares and attain equity for capital requirements.
5. Investment (Refer Appendix 5)
Interpretation-
4
Paraphrase This Document
Need a fresh take? Get an instant paraphrase of this document with our AI Paraphraser
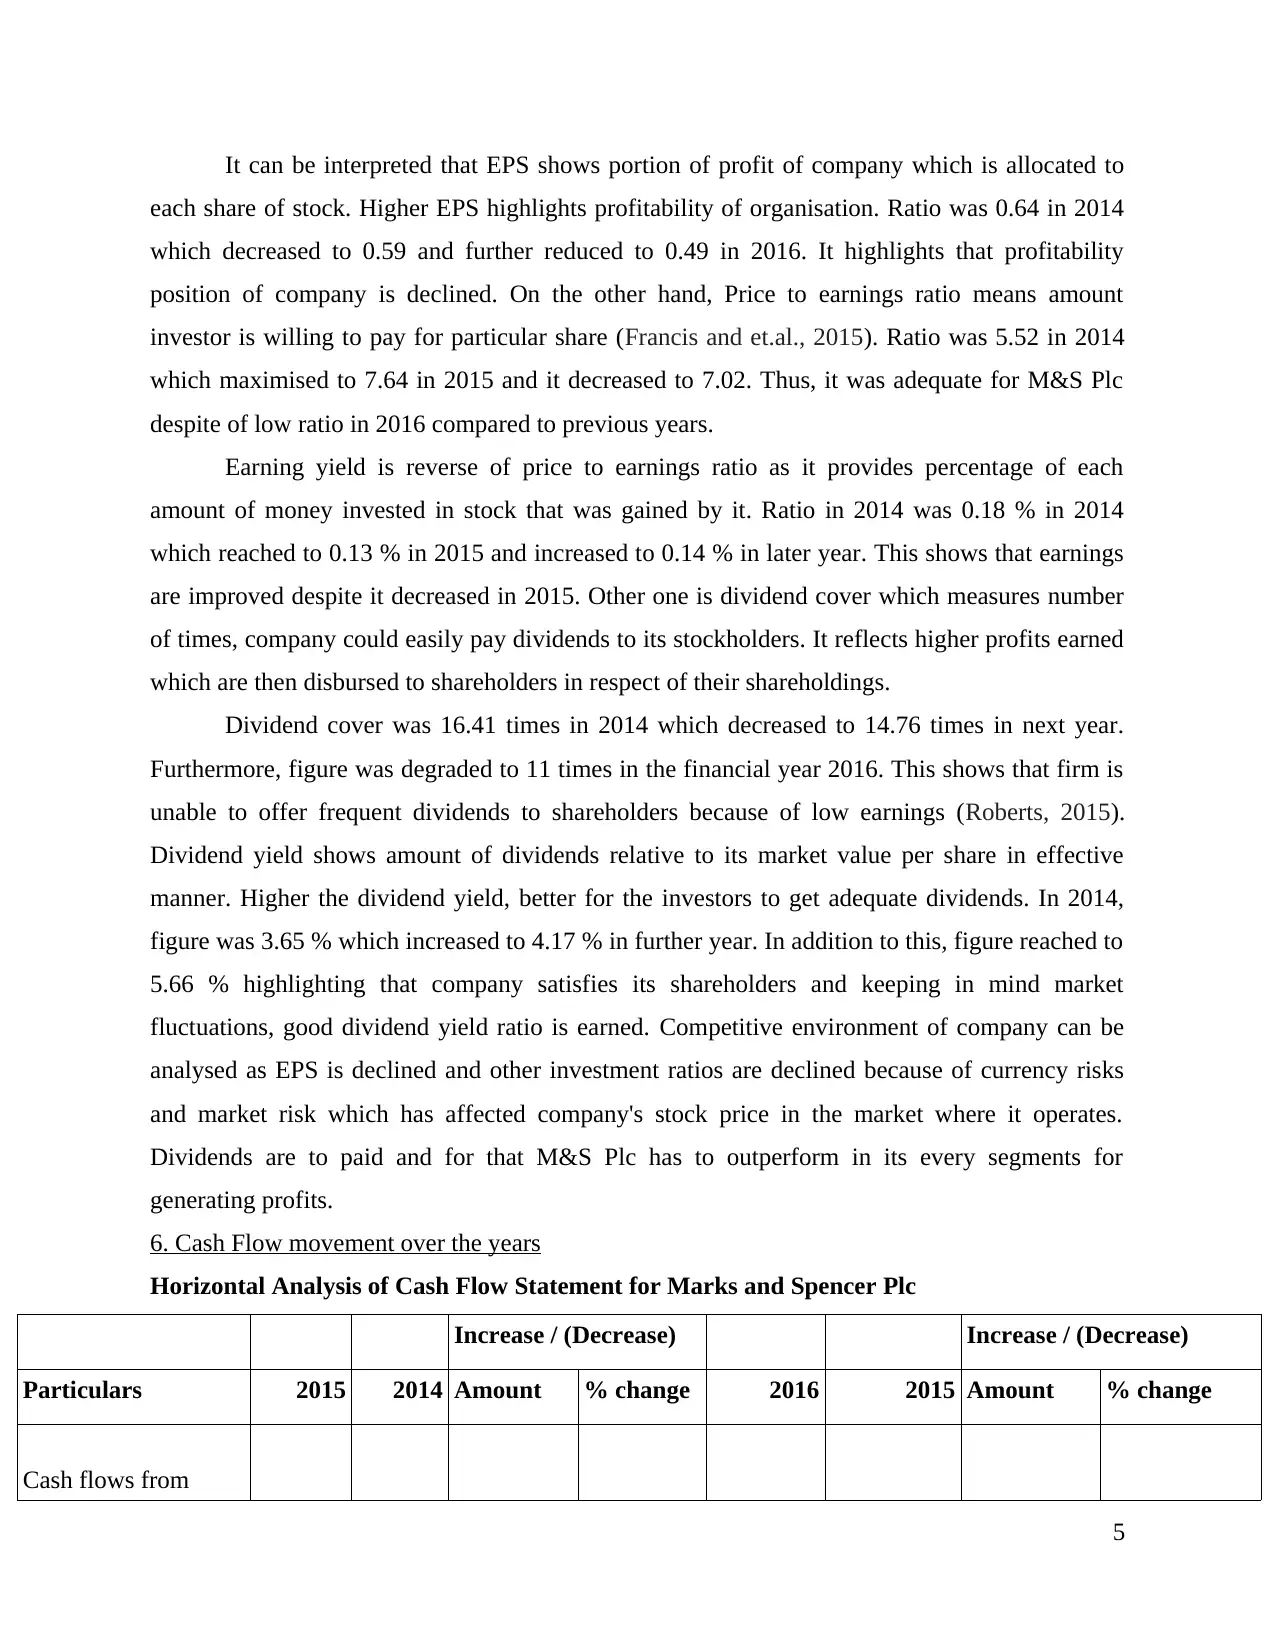
It can be interpreted that EPS shows portion of profit of company which is allocated to
each share of stock. Higher EPS highlights profitability of organisation. Ratio was 0.64 in 2014
which decreased to 0.59 and further reduced to 0.49 in 2016. It highlights that profitability
position of company is declined. On the other hand, Price to earnings ratio means amount
investor is willing to pay for particular share (Francis and et.al., 2015). Ratio was 5.52 in 2014
which maximised to 7.64 in 2015 and it decreased to 7.02. Thus, it was adequate for M&S Plc
despite of low ratio in 2016 compared to previous years.
Earning yield is reverse of price to earnings ratio as it provides percentage of each
amount of money invested in stock that was gained by it. Ratio in 2014 was 0.18 % in 2014
which reached to 0.13 % in 2015 and increased to 0.14 % in later year. This shows that earnings
are improved despite it decreased in 2015. Other one is dividend cover which measures number
of times, company could easily pay dividends to its stockholders. It reflects higher profits earned
which are then disbursed to shareholders in respect of their shareholdings.
Dividend cover was 16.41 times in 2014 which decreased to 14.76 times in next year.
Furthermore, figure was degraded to 11 times in the financial year 2016. This shows that firm is
unable to offer frequent dividends to shareholders because of low earnings (Roberts, 2015).
Dividend yield shows amount of dividends relative to its market value per share in effective
manner. Higher the dividend yield, better for the investors to get adequate dividends. In 2014,
figure was 3.65 % which increased to 4.17 % in further year. In addition to this, figure reached to
5.66 % highlighting that company satisfies its shareholders and keeping in mind market
fluctuations, good dividend yield ratio is earned. Competitive environment of company can be
analysed as EPS is declined and other investment ratios are declined because of currency risks
and market risk which has affected company's stock price in the market where it operates.
Dividends are to paid and for that M&S Plc has to outperform in its every segments for
generating profits.
6. Cash Flow movement over the years
Horizontal Analysis of Cash Flow Statement for Marks and Spencer Plc
Increase / (Decrease) Increase / (Decrease)
Particulars 2015 2014 Amount % change 2016 2015 Amount % change
Cash flows from
5
operating activities
Cash from operations 1349.1 1175.5 173.6 14.77% 1311.3 1349.1 -37.8 -2.80%
Paid income taxes -71.1 -45.9 -25.2 54.90% -99.3 -71.1 -28.2 39.66%
Net inflow from
operating activities 1278 1129.6 148.4 13.14% 1212 1278 -66 -5.16%
Cash flows from
investing activities
Property disposals
(proceeds) 35.4 25 10.4 41.60% 30.6 35.4 -4.8 -13.56%
Bought PPE
(property, plant and
equipment) -521.8 -440.1 -81.7 18.56% -363.3 -521.8 158.5 -30.38%
Intangible assets
purchased -178 -201.5 23.5 -11.66% -186.8 -178 -8.8 4.94%
Reduction/(purchase)
of current financial
assets 6 -1.7 7.7 -4.53 -7.2 6 -13.2 -2.20
Acquired subsidiary 0 0 0 0.00% -56.2 0 -56.2 0.00%
Received interest 9.3 3.4 5.9 1.74 6.8 9.3 -2.5 -26.88%
Net outflow in
investing activities -649.1 -614.9 -34.2 5.56% -576.1 -649.1 73 -11.25%
Cash flows from
financing activities
Paid interest -115.3 -132.7 17.4 -13.11% -113.5 -115.3 1.8 -1.56%
Borrowings -165.7 167.5 -333.2 -1.99 3.1 -165.7 168.8 -1.02
6
⊘ This is a preview!⊘
Do you want full access?
Subscribe today to unlock all pages.
Trusted by 1+ million students worldwide
(outflow)/inflow
(Repayment)/
drawdown of
syndicated loan notes -10.2 154.1 -164.3 -1.07 -19.9 -10.2 -9.7 95.10%
Medium-term notes
(redemption 0 -400 400 -1.00 0 0 0 0.00%
Reduction in
obligations under
finance leases -4.8 -7.3 2.5 -34.25% -2.4 -4.8 2.4 -50.00%
Liability payment to
Pension scheme -54.4 -50.3 -4.1 8.15% -56 -54.4 -1.6 2.94%
Paid equity dividends -280.7 -273.6 -7.1 2.60% -301.7 -280.7 -21 7.48%
Issued shares by
exercising employee
share options 40.8 44.2 -3.4 -7.69% 20.6 40.8 -20.2 -49.51%
Buy back of shares 0 0 0 0.00% -150.7 0 -150.7 0.00%
Purchase of own
shares through
employee trust -24.2 0 -24.2 0.00% -24.2 24.2 -1.00
Net outflow in
financing activities -614.5 -498.1 -116.4 23.37% -631.4 -614.5 -16.9 2.75%
Net Increase /
(Decrease) in cash 14.4 16.6 -2.2 -13.25% 4.5 14.4 -9.9 -68.75%
Exchange rate effects -2.3 -1.6 -0.7 43.75% 3.7 -2.3 6 -260.87%
Opening cash balance 175.7 160.7 15 9.33% 187.8 175.7 12.1 6.89%
Closing cash balance 187.8 175.7 12.1 6.89% 196 187.8 8.2 4.37%
7
Paraphrase This Document
Need a fresh take? Get an instant paraphrase of this document with our AI Paraphraser
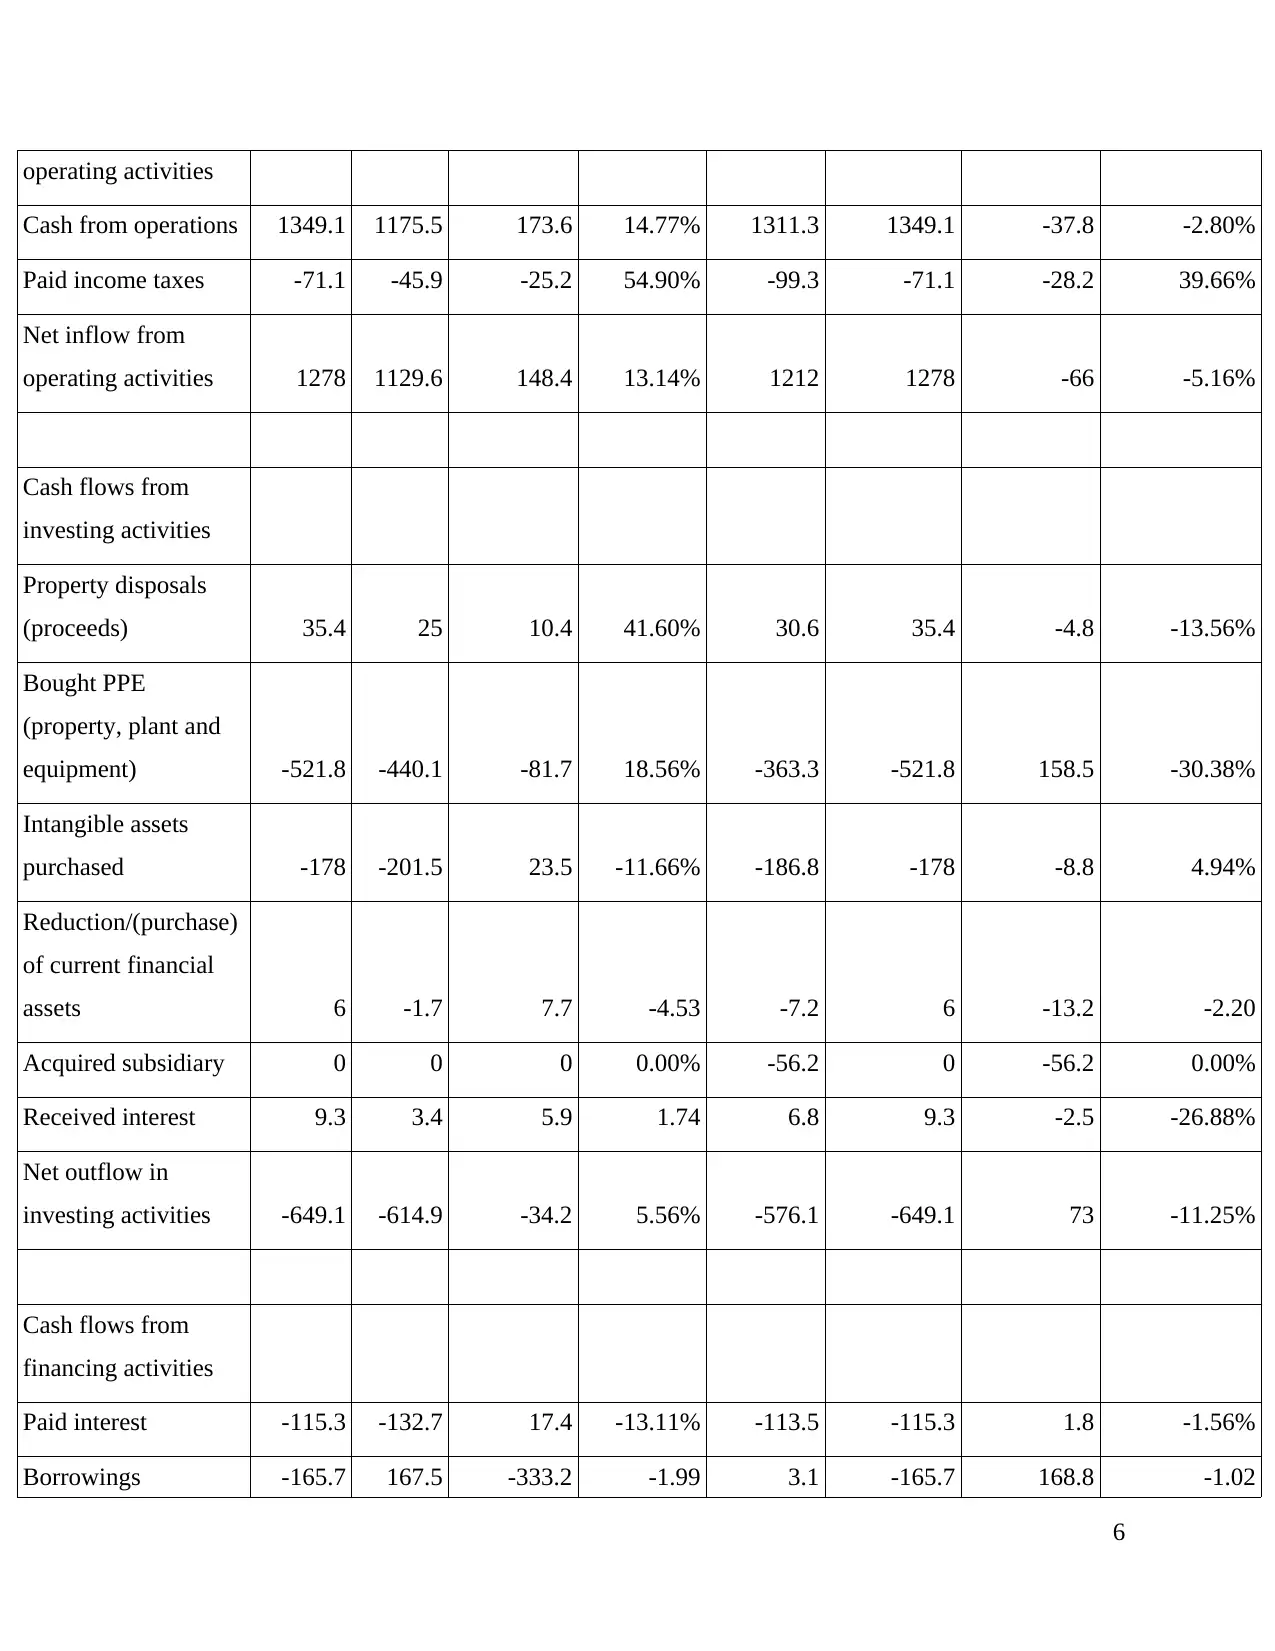
Interpretation-
It can be interpreted that cash flow statements of last three years have been analysed by
implementing horizontal analysis to show movements of cash in effective manner (Palvia,
Vähämaa and Vähämaa, 2015). There are three activities such as operating, investing and
financing activities from which cash balance be it increased or decreased can be assessed in a
better manner. It can be analysed that cash inflows from operating activities were 1129.6 in 2014
which increased to 1278 in 2015 with total amount by margin of 148.4. While, it increased by
13.14 % in terms of percentage basis. This was earned because of more cash from operations.
However, it decreased to 1212 and -5.16 % because of decrease in cash from operational
activities.
On the other hand, investing activities can also be identified as property disposals,
purchase of PPE, purchase of intangible assets were occurred leading to change in investing
activities (Greenbaum, Thakor and Boot, 2015). The figure was -614.9 in 2014 which increased
to -649.1 in 2015 as cash was utilised and invested in fixed assets and was increased by 5.56 %.
Moreover, sale of investments were taken place in 2016 in comparison to 2015 as it decreased to
-576.1 having -11.25 % of change. This clearly reflects that cash outflows from investing
activities has been reduced by M&S Plc. On the other side, financing activities are also
computed for three years.
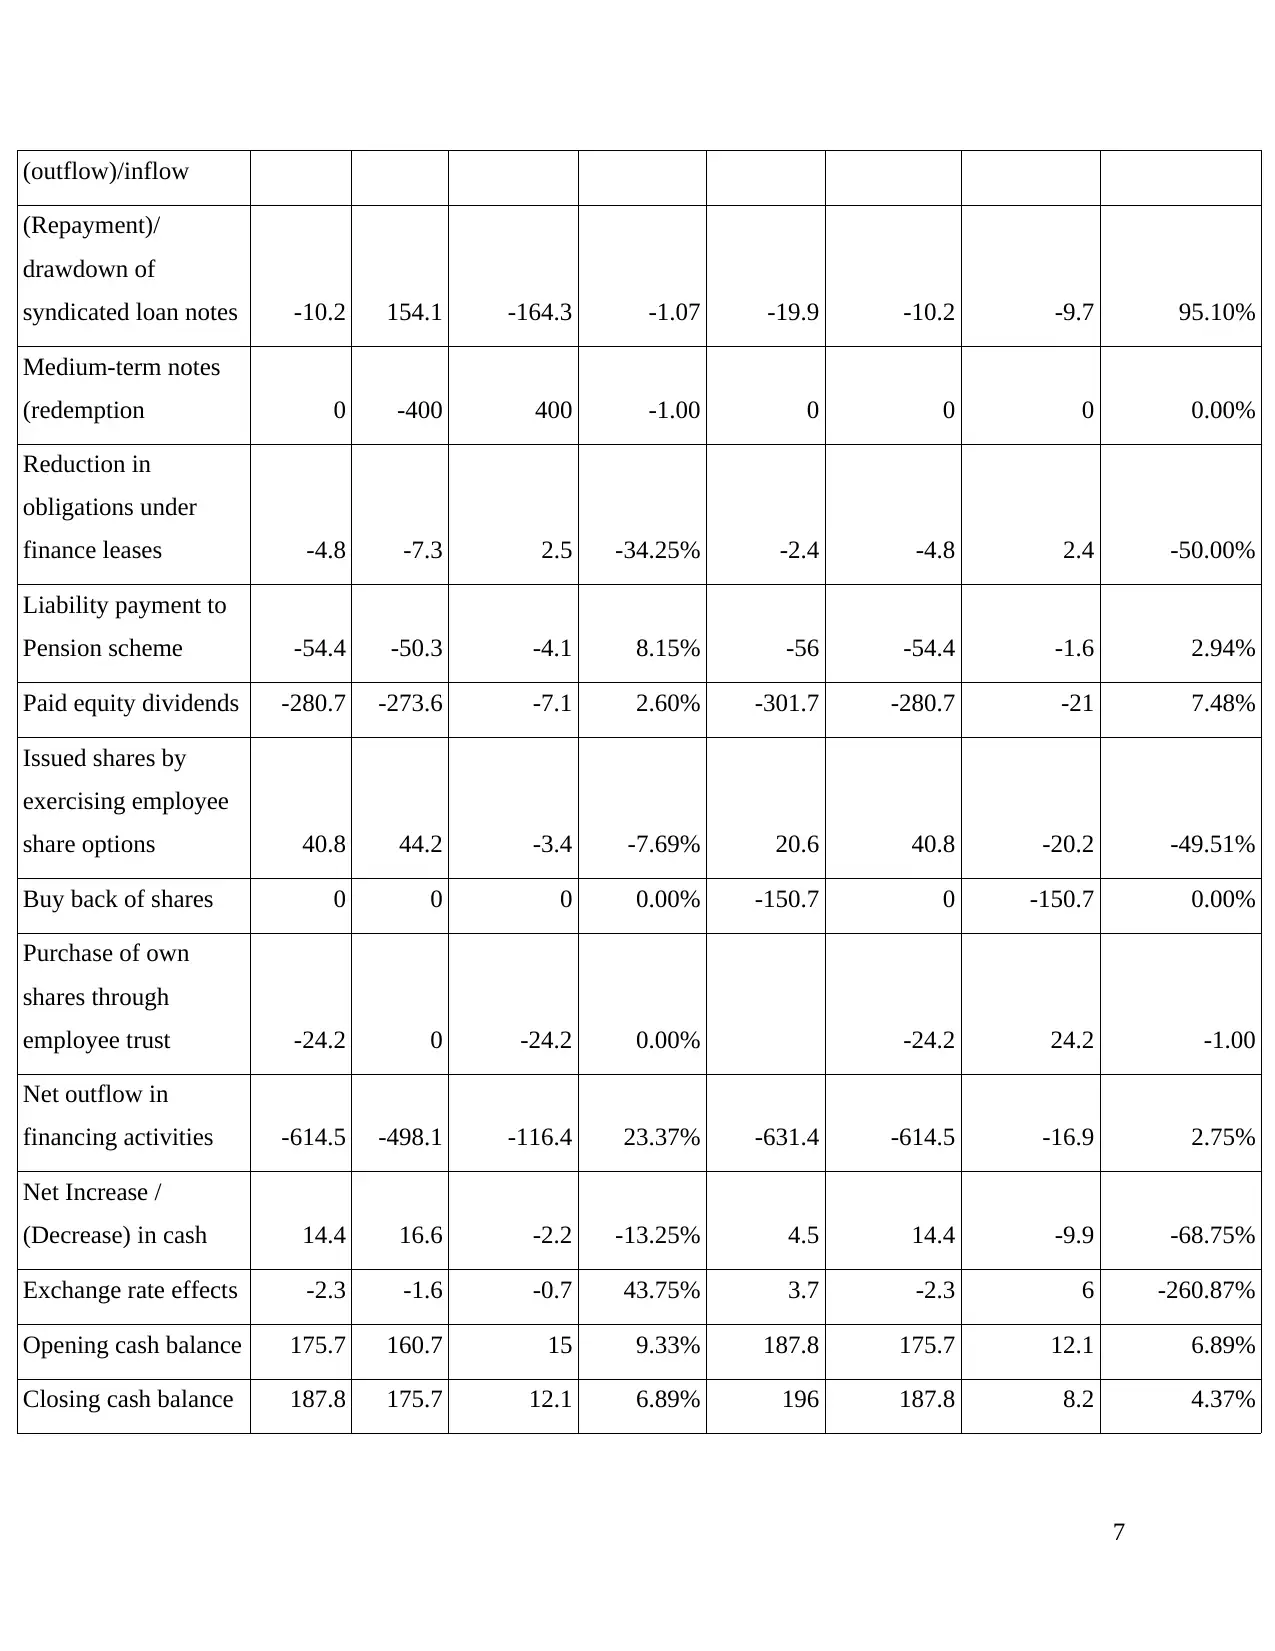
Cash was also utilised in financing activities as net outflow was -498.1 in 2014 which
increased by 23.37 % in 2015 leading to -614.5. However, it increased by 2.75 % in 2016 and
reached -631.4 in effective manner. The increase and decrease of all three activities are
computed and closing balance along with opening balance have been calculated. The closing
balance was 175.7 in 2014 which increased by 6.89 % in 2015 to 187.8. While, it further
elevated to 196 with an increase by 4.37%. Hence, overall cash movements of M&S Plc are
good.
8
It can be interpreted that cash flow statements of last three years have been analysed by
implementing horizontal analysis to show movements of cash in effective manner (Palvia,
Vähämaa and Vähämaa, 2015). There are three activities such as operating, investing and
financing activities from which cash balance be it increased or decreased can be assessed in a
better manner. It can be analysed that cash inflows from operating activities were 1129.6 in 2014
which increased to 1278 in 2015 with total amount by margin of 148.4. While, it increased by
13.14 % in terms of percentage basis. This was earned because of more cash from operations.
However, it decreased to 1212 and -5.16 % because of decrease in cash from operational
activities.
On the other hand, investing activities can also be identified as property disposals,
purchase of PPE, purchase of intangible assets were occurred leading to change in investing
activities (Greenbaum, Thakor and Boot, 2015). The figure was -614.9 in 2014 which increased
to -649.1 in 2015 as cash was utilised and invested in fixed assets and was increased by 5.56 %.
Moreover, sale of investments were taken place in 2016 in comparison to 2015 as it decreased to
-576.1 having -11.25 % of change. This clearly reflects that cash outflows from investing
activities has been reduced by M&S Plc. On the other side, financing activities are also
computed for three years.
Cash was also utilised in financing activities as net outflow was -498.1 in 2014 which
increased by 23.37 % in 2015 leading to -614.5. However, it increased by 2.75 % in 2016 and
reached -631.4 in effective manner. The increase and decrease of all three activities are
computed and closing balance along with opening balance have been calculated. The closing
balance was 175.7 in 2014 which increased by 6.89 % in 2015 to 187.8. While, it further
elevated to 196 with an increase by 4.37%. Hence, overall cash movements of M&S Plc are
good.
8
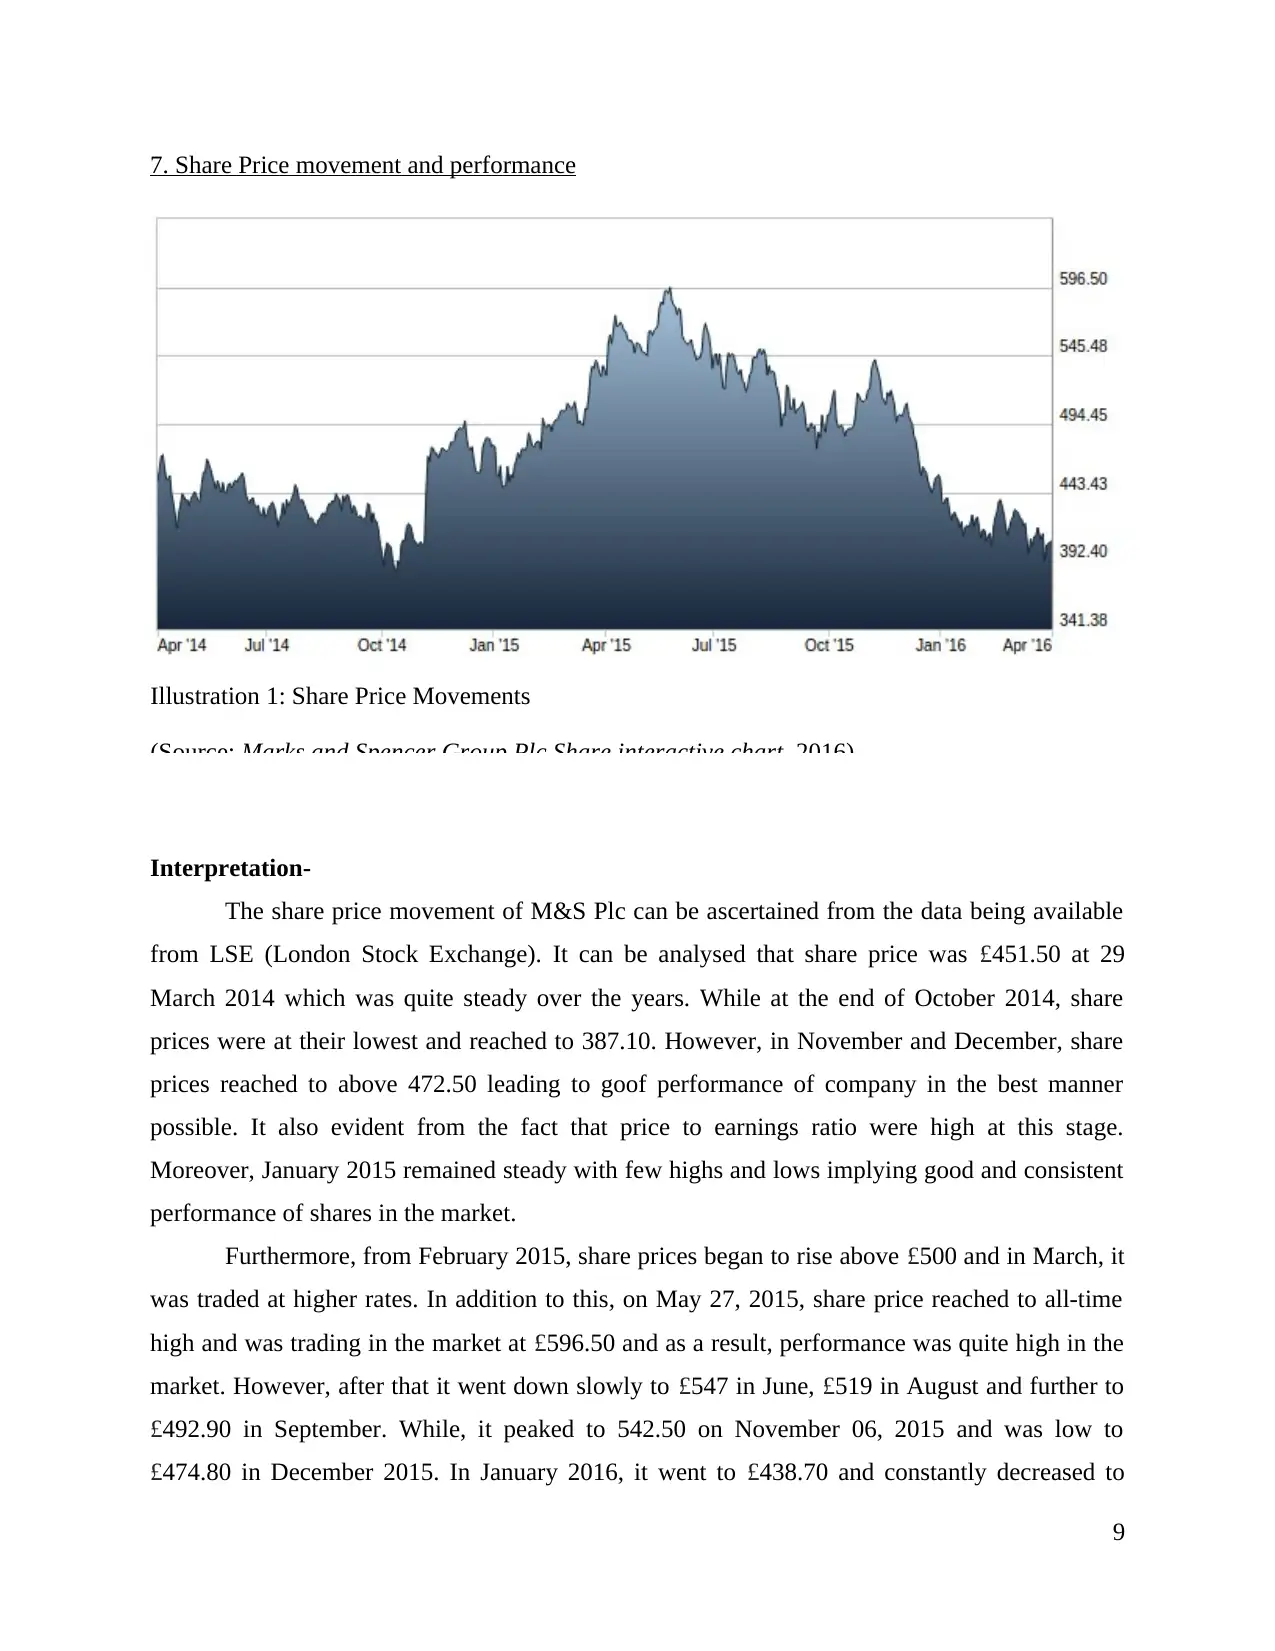
7. Share Price movement and performance
Illustration 1: Share Price Movements
(Source: Marks and Spencer Group Plc Share interactive chart, 2016)
Interpretation-
The share price movement of M&S Plc can be ascertained from the data being available
from LSE (London Stock Exchange). It can be analysed that share price was £451.50 at 29
March 2014 which was quite steady over the years. While at the end of October 2014, share
prices were at their lowest and reached to 387.10. However, in November and December, share
prices reached to above 472.50 leading to goof performance of company in the best manner
possible. It also evident from the fact that price to earnings ratio were high at this stage.
Moreover, January 2015 remained steady with few highs and lows implying good and consistent
performance of shares in the market.
Furthermore, from February 2015, share prices began to rise above £500 and in March, it
was traded at higher rates. In addition to this, on May 27, 2015, share price reached to all-time
high and was trading in the market at £596.50 and as a result, performance was quite high in the
market. However, after that it went down slowly to £547 in June, £519 in August and further to
£492.90 in September. While, it peaked to 542.50 on November 06, 2015 and was low to
£474.80 in December 2015. In January 2016, it went to £438.70 and constantly decreased to
9
⊘ This is a preview!⊘
Do you want full access?
Subscribe today to unlock all pages.
Trusted by 1+ million students worldwide
1 out of 15
Related Documents


Your All-in-One AI-Powered Toolkit for Academic Success.
+13062052269
info@desklib.com
Available 24*7 on WhatsApp / Email
![[object Object]](/_next/static/media/star-bottom.7253800d.svg)
Unlock your academic potential
Copyright © 2020–2026 A2Z Services. All Rights Reserved. Developed and managed by ZUCOL.