University Analysis: Strategic Financial Management Report on Netflix
VerifiedAdded on 2022/11/23
|37
|5968
|352
Report
AI Summary
This report provides a comprehensive strategic financial management analysis of Netflix, covering various aspects of its business operations. The report begins with an introduction to Netflix, its business model, and its industry context. A detailed financial analysis follows, examining profitability ratios (gross margin, operating margin, and return on equity), liquidity ratios (current ratio, acid-test ratio, and shareholders’ equity), efficiency ratios (accounts payable days and asset turnover ratio), cash flow analysis, and gearing ratios. The report also assesses Netflix's investors, segmentation, and competitor analysis. Furthermore, the report includes an overview of Netflix's marketing analysis, focusing on product, price, place, and promotion strategies. It also delves into human resource management analysis, covering core values, skills, pay, culture, recruitment, and the organizational structure of Netflix. Finally, the report examines Netflix's operations analysis, including its value chain, primary activities, and supporting activities, and concludes with a summary of the company's strengths and weaknesses. The report uses data from the provided case study.
Running Head: Strategic Finance Management
Netflix
Strategic Finance Management
This report deals with the complete analysis of Netflix which includes financial analysis,
marketing, HRM and operations analysis. All work in this report is obtained from the case
study unless referenced otherwise.
Contents
Netflix
Strategic Finance Management
This report deals with the complete analysis of Netflix which includes financial analysis,
marketing, HRM and operations analysis. All work in this report is obtained from the case
study unless referenced otherwise.
Contents
Paraphrase This Document
Need a fresh take? Get an instant paraphrase of this document with our AI Paraphraser
Strategic Finance Management
1. Introduction...................................................................................................................................2
2. Financial Analysis.........................................................................................................................3
2.1 Profitability Ratios...................................................................................................................3
2.2 Gross Margin vs. Operating Expenses.....................................................................................5
2.3 Liquidity Ratios.......................................................................................................................6
2.4 Efficiency Ratios.....................................................................................................................7
2.5 Cash Flow Analysis.................................................................................................................9
2.6 Gearing Ratios.........................................................................................................................9
2.7 Investors................................................................................................................................10
2.8 Segmentation Analysis..........................................................................................................11
2.9 Competitor Analysis..............................................................................................................11
3. Marketing Analysis......................................................................................................................12
4. Human Resource Management Analysis.....................................................................................13
4.1 Core Values of Netflix...............................................................................................................13
4.2 Skills..........................................................................................................................................13
4.3 Pay.............................................................................................................................................13
4.4 Additional Compensation..........................................................................................................14
4.5 Culture.......................................................................................................................................14
4.6 Number of Employees...............................................................................................................14
4.7 Recruitment...............................................................................................................................14
4.8 Structure of Netflix....................................................................................................................15
4.9 Corporate Governance at Netflix...............................................................................................15
5. Operations Analysis.....................................................................................................................16
5.1 Value Chain of Netflix...............................................................................................................16
5.2 Primary Activities................................................................................................................16
5.3 Supporting Activities...........................................................................................................17
6. Strengths and Weakness for Netflix.............................................................................................18
References...........................................................................................................................................20
1
Strategic Finance Management
Appendices..........................................................................................................................................24
Appendix 1......................................................................................................................................24
Appendix 2......................................................................................................................................27
Appendix 3......................................................................................................................................27
Appendix 4......................................................................................................................................30
Appendix 5......................................................................................................................................31
2
⊘ This is a preview!⊘
Do you want full access?
Subscribe today to unlock all pages.
Trusted by 1+ million students worldwide
Strategic Finance Management
1. Introduction
Netflix was started by Marc Randolph and Reed Hastings in 1997. At present, Reed Hastings
is its Chief Operating Officer. Subscription service was started by the company in 1999. The
company is leading in the area of internet entertainment service with more than 151 million
paid memberships in about one hundred ninety countries. It deals in streaming TV series,
feature films, documentaries etc.1
Netflix Business Operations
Earlier Netflix was into web based- catalogue service wherein it used to rent the DVD’s of
old movies through mail. They allowed the subscribed users to keep the DVD’s for as long as
they want without any late fee charges.
At present, the company is streaming a library of movies, TV shows, documentaries, in-house
contents etc. It generates revenue through streaming varieties of videos and audios for which
it charges a good amount of subscription fee.
Operational Market of Netflix
Netflix deals in a video streaming market which deals in video streaming services, generally
referred to as “Video on Demand” (VOD). VOD service refers to the system through which
users can watch the TV series, videos, movies, audios at any place at any point of time
without the constraint of watching the show at a fixed time. These shows are streamed
through internet and over the market (OTT) and are accessed through all kinds of internet
connected devices and set-top boxes.
Industry of Netflix
Netflix operates in the media industry where it has the competitors like Amazon, Disney and
HBO etc. All these companies are indulged into video streaming. The nature of the industry
is such that it allows the Netflix to carry out its business operation as vertically-integrated
company.
Strategic Business Unit (SBU) of Netflix
1 https://media.netflix.com/en/about-netflix
3
Paraphrase This Document
Need a fresh take? Get an instant paraphrase of this document with our AI Paraphraser
Strategic Finance Management
If we talk about the Strategic Business Unit (SBU) of Netflix then it includes domestic
streaming, and international streaming and domestic DVD. Netflix stream the videos only to
subscribed members of United States under domestic streaming. To the subscribed members
who reside outside the United States, the videos are streamed under International streaming.
Lastly, under Domestic DVD the company generates sales from the membership fees charged
for mailing the DVD’s.
2. Financial Analysis
2.1 Profitability Ratios
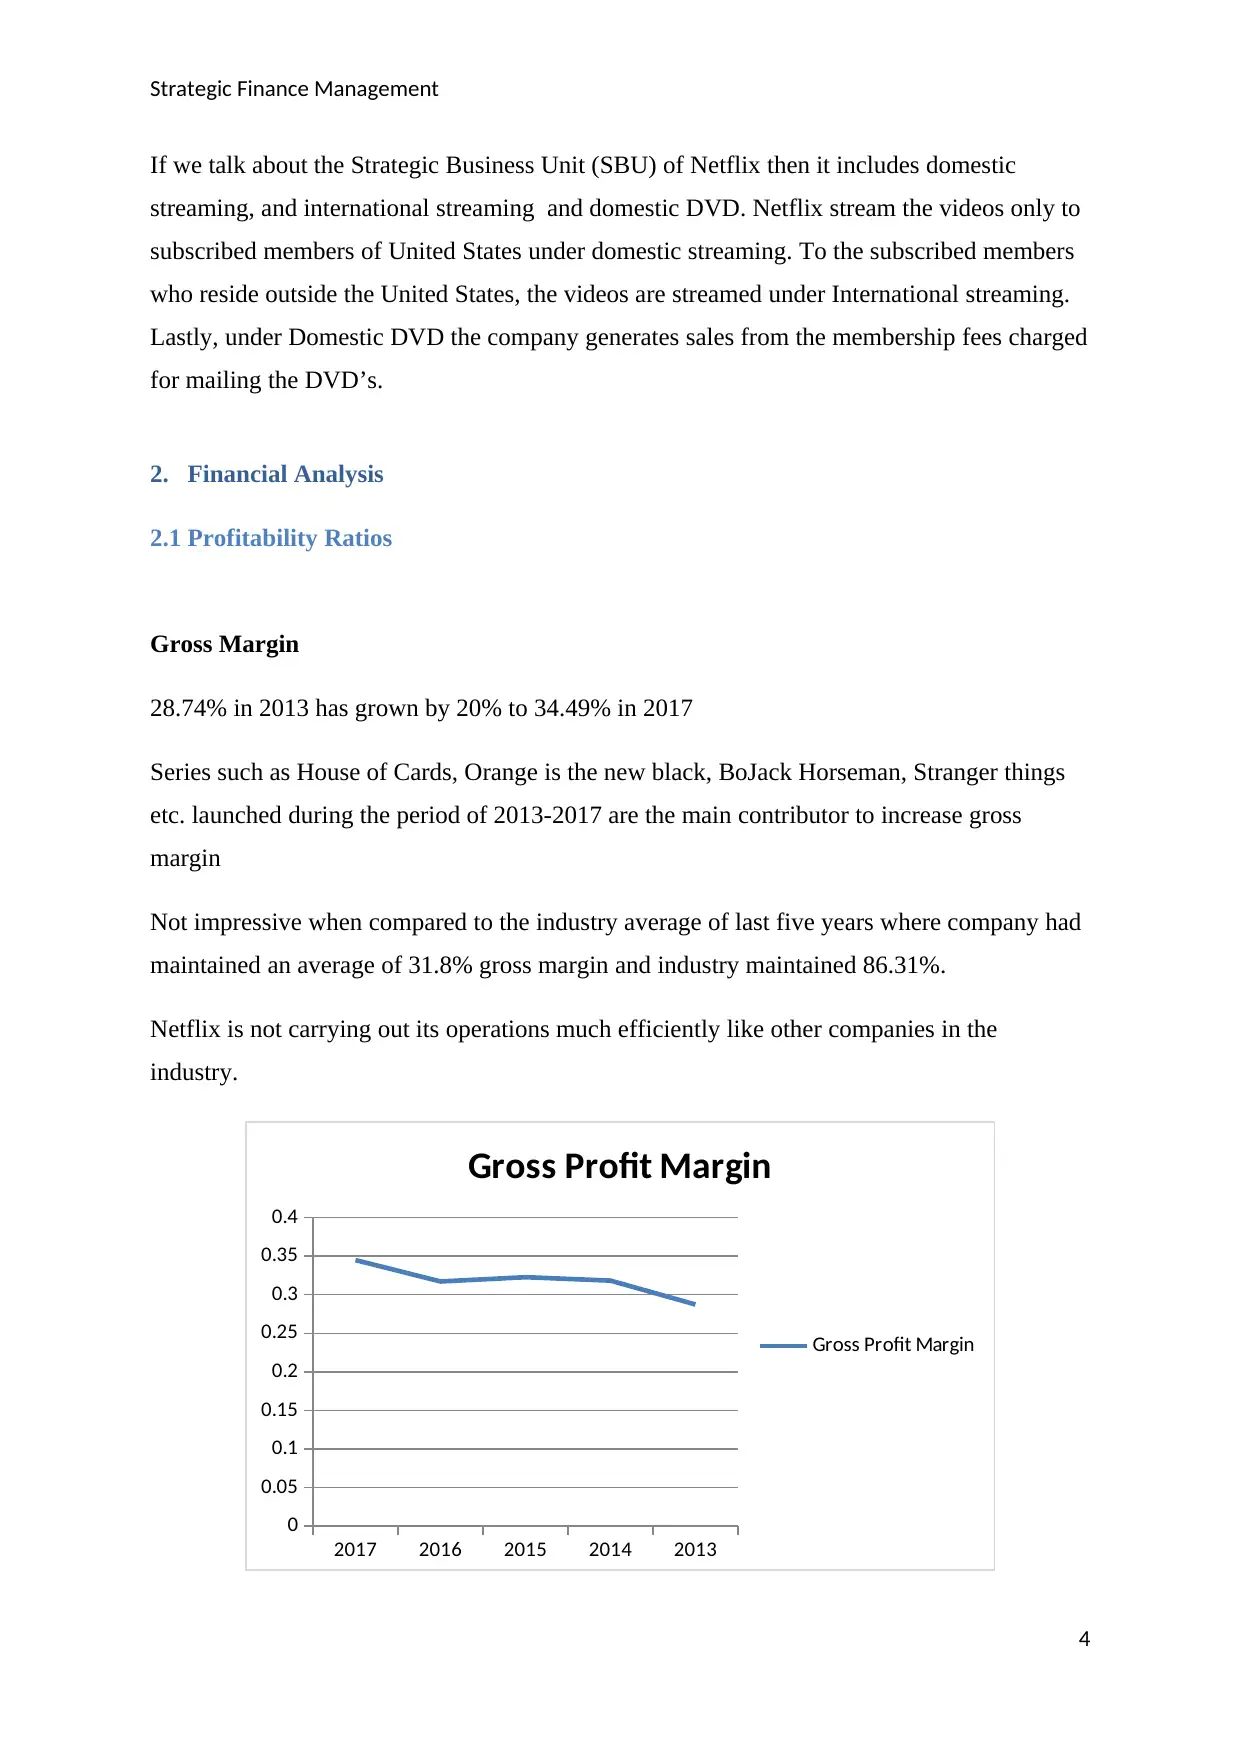
Gross Margin
28.74% in 2013 has grown by 20% to 34.49% in 2017
Series such as House of Cards, Orange is the new black, BoJack Horseman, Stranger things
etc. launched during the period of 2013-2017 are the main contributor to increase gross
margin
Not impressive when compared to the industry average of last five years where company had
maintained an average of 31.8% gross margin and industry maintained 86.31%.
Netflix is not carrying out its operations much efficiently like other companies in the
industry.
2017 2016 2015 2014 2013
0
0.05
0.1
0.15
0.2
0.25
0.3
0.35
0.4
Gross Profit Margin
Gross Profit Margin
4
If we talk about the Strategic Business Unit (SBU) of Netflix then it includes domestic
streaming, and international streaming and domestic DVD. Netflix stream the videos only to
subscribed members of United States under domestic streaming. To the subscribed members
who reside outside the United States, the videos are streamed under International streaming.
Lastly, under Domestic DVD the company generates sales from the membership fees charged
for mailing the DVD’s.
2. Financial Analysis
2.1 Profitability Ratios
Gross Margin
28.74% in 2013 has grown by 20% to 34.49% in 2017
Series such as House of Cards, Orange is the new black, BoJack Horseman, Stranger things
etc. launched during the period of 2013-2017 are the main contributor to increase gross
margin
Not impressive when compared to the industry average of last five years where company had
maintained an average of 31.8% gross margin and industry maintained 86.31%.
Netflix is not carrying out its operations much efficiently like other companies in the
industry.
2017 2016 2015 2014 2013
0
0.05
0.1
0.15
0.2
0.25
0.3
0.35
0.4
Gross Profit Margin
Gross Profit Margin
4
Strategic Finance Management
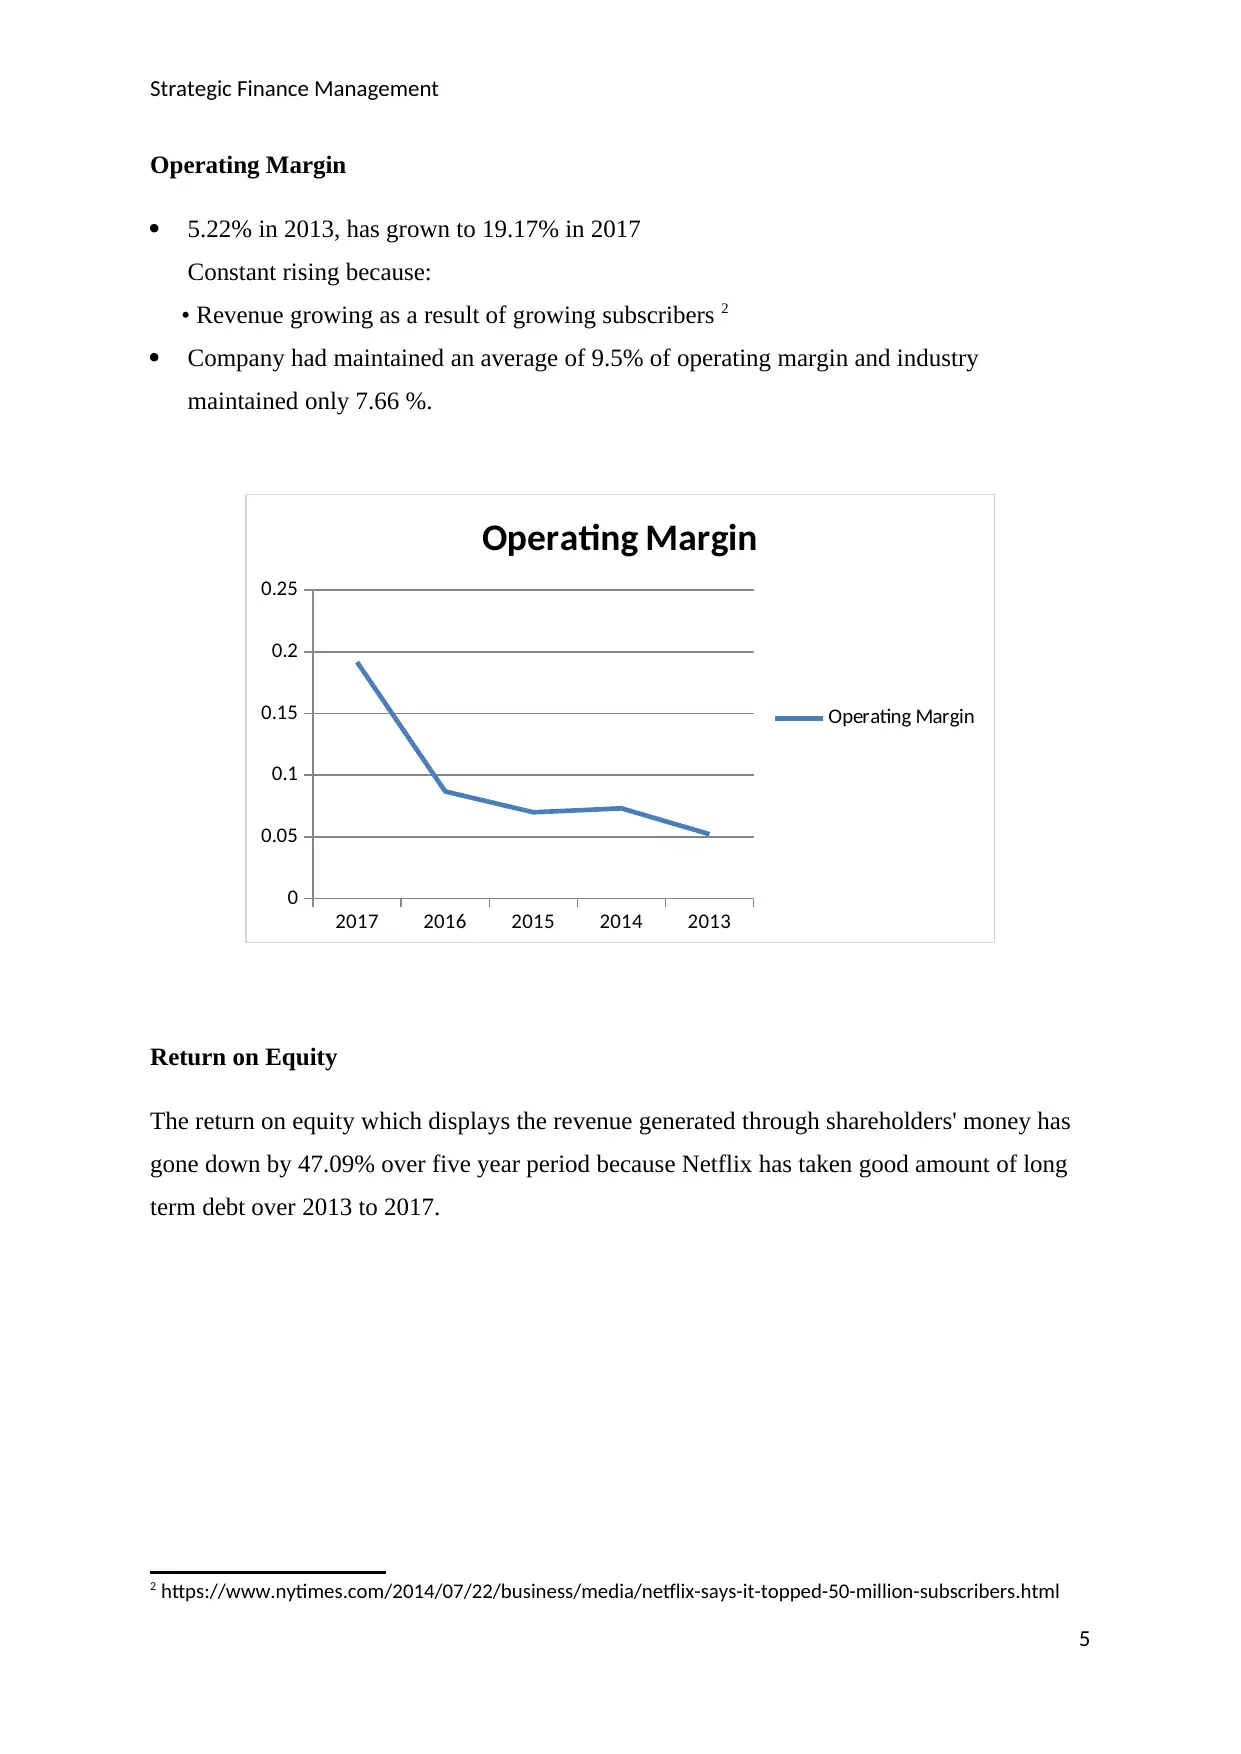
Operating Margin
5.22% in 2013, has grown to 19.17% in 2017
Constant rising because:
• Revenue growing as a result of growing subscribers 2
Company had maintained an average of 9.5% of operating margin and industry
maintained only 7.66 %.
2017 2016 2015 2014 2013
0
0.05
0.1
0.15
0.2
0.25
Operating Margin
Operating Margin
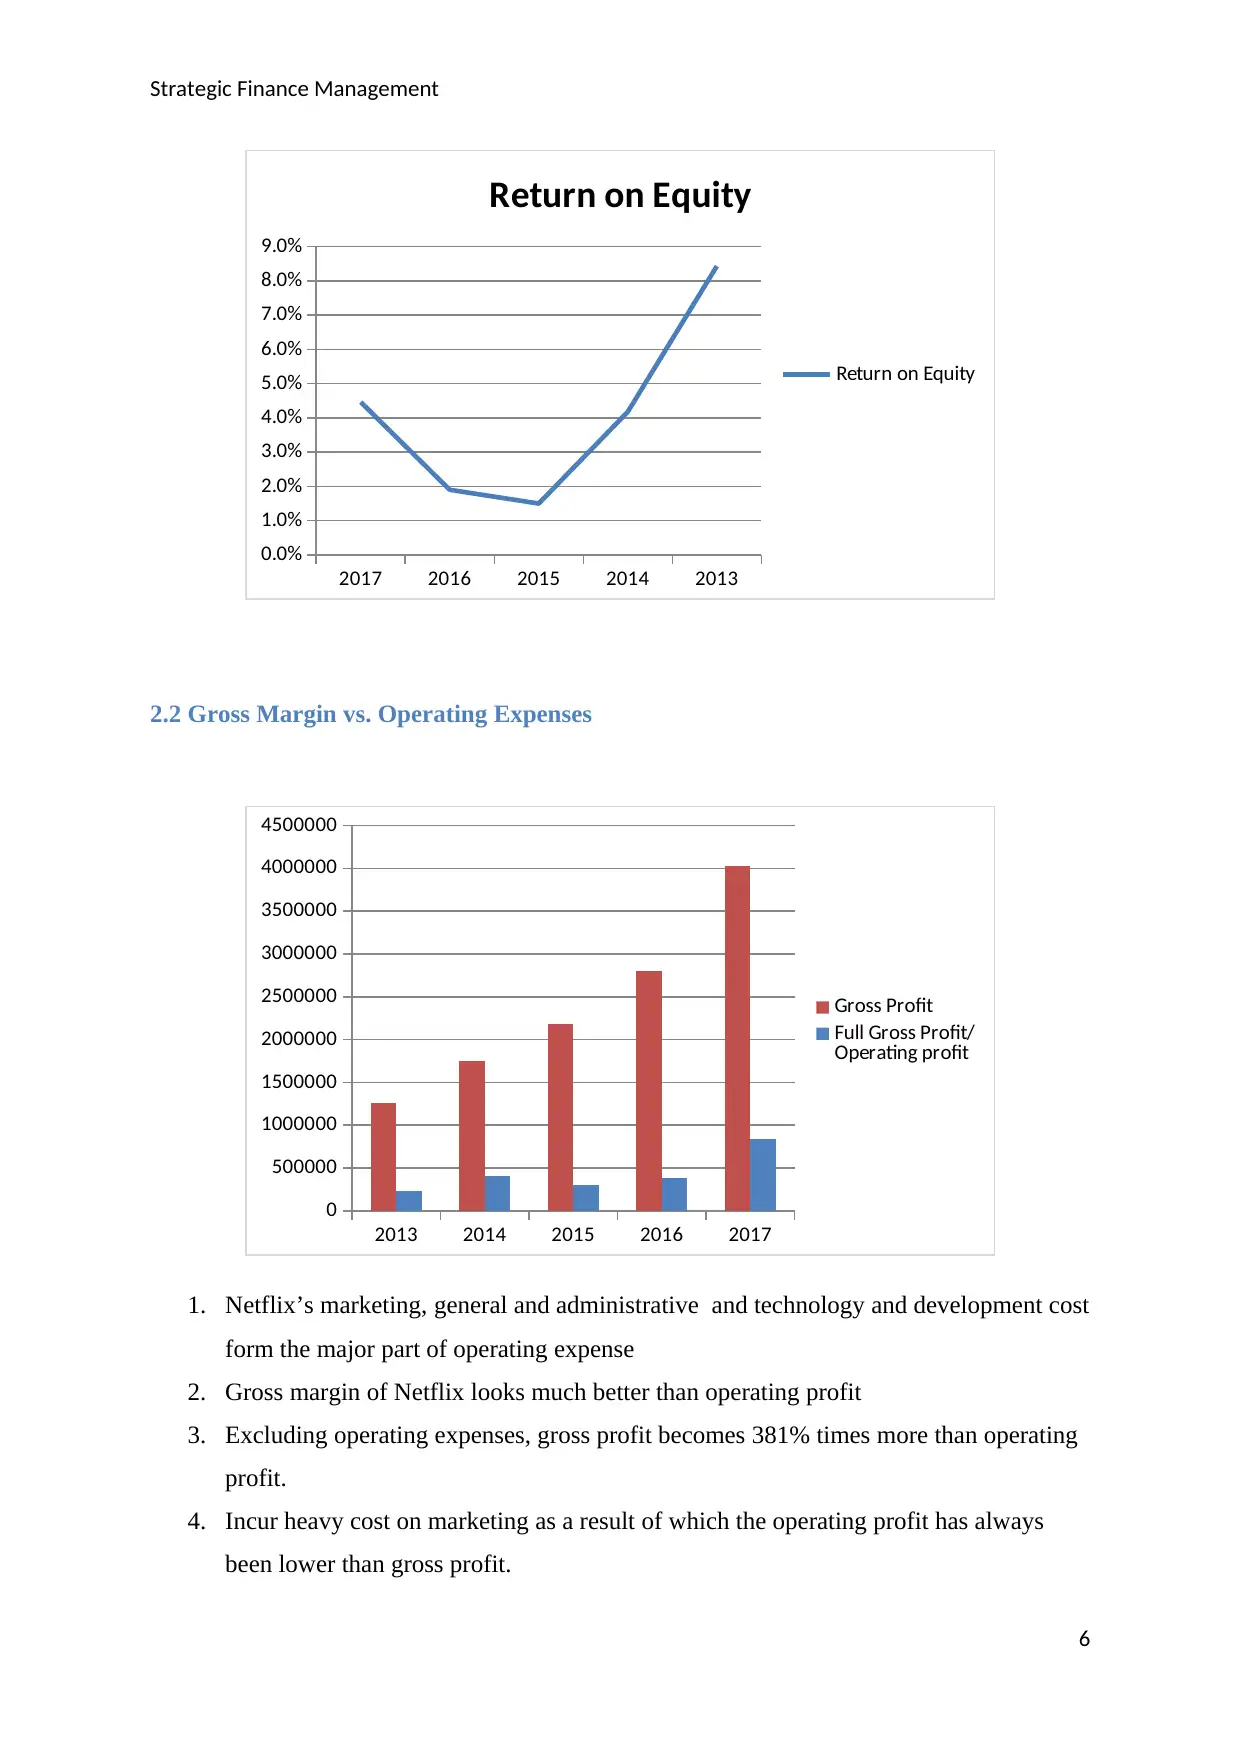
Return on Equity
The return on equity which displays the revenue generated through shareholders' money has
gone down by 47.09% over five year period because Netflix has taken good amount of long
term debt over 2013 to 2017.
2 https://www.nytimes.com/2014/07/22/business/media/netflix-says-it-topped-50-million-subscribers.html
5
Operating Margin
5.22% in 2013, has grown to 19.17% in 2017
Constant rising because:
• Revenue growing as a result of growing subscribers 2
Company had maintained an average of 9.5% of operating margin and industry
maintained only 7.66 %.
2017 2016 2015 2014 2013
0
0.05
0.1
0.15
0.2
0.25
Operating Margin
Operating Margin
Return on Equity
The return on equity which displays the revenue generated through shareholders' money has
gone down by 47.09% over five year period because Netflix has taken good amount of long
term debt over 2013 to 2017.
2 https://www.nytimes.com/2014/07/22/business/media/netflix-says-it-topped-50-million-subscribers.html
5
⊘ This is a preview!⊘
Do you want full access?
Subscribe today to unlock all pages.
Trusted by 1+ million students worldwide
Strategic Finance Management
2017 2016 2015 2014 2013
0.0%
1.0%
2.0%
3.0%
4.0%
5.0%
6.0%
7.0%
8.0%
9.0%
Return on Equity
Return on Equity
2.2 Gross Margin vs. Operating Expenses
2013 2014 2015 2016 2017
0
500000
1000000
1500000
2000000
2500000
3000000
3500000
4000000
4500000
Gross Profit
Full Gross Profit/
Operating profit
1. Netflix’s marketing, general and administrative and technology and development cost
form the major part of operating expense
2. Gross margin of Netflix looks much better than operating profit
3. Excluding operating expenses, gross profit becomes 381% times more than operating
profit.
4. Incur heavy cost on marketing as a result of which the operating profit has always
been lower than gross profit.
6
Paraphrase This Document
Need a fresh take? Get an instant paraphrase of this document with our AI Paraphraser
Strategic Finance Management
2.3 Liquidity Ratios
The liquidity ratios which mainly include current and quick ratios help to check the
company's efficiency in meeting its short term liabilities with the short term assets3.
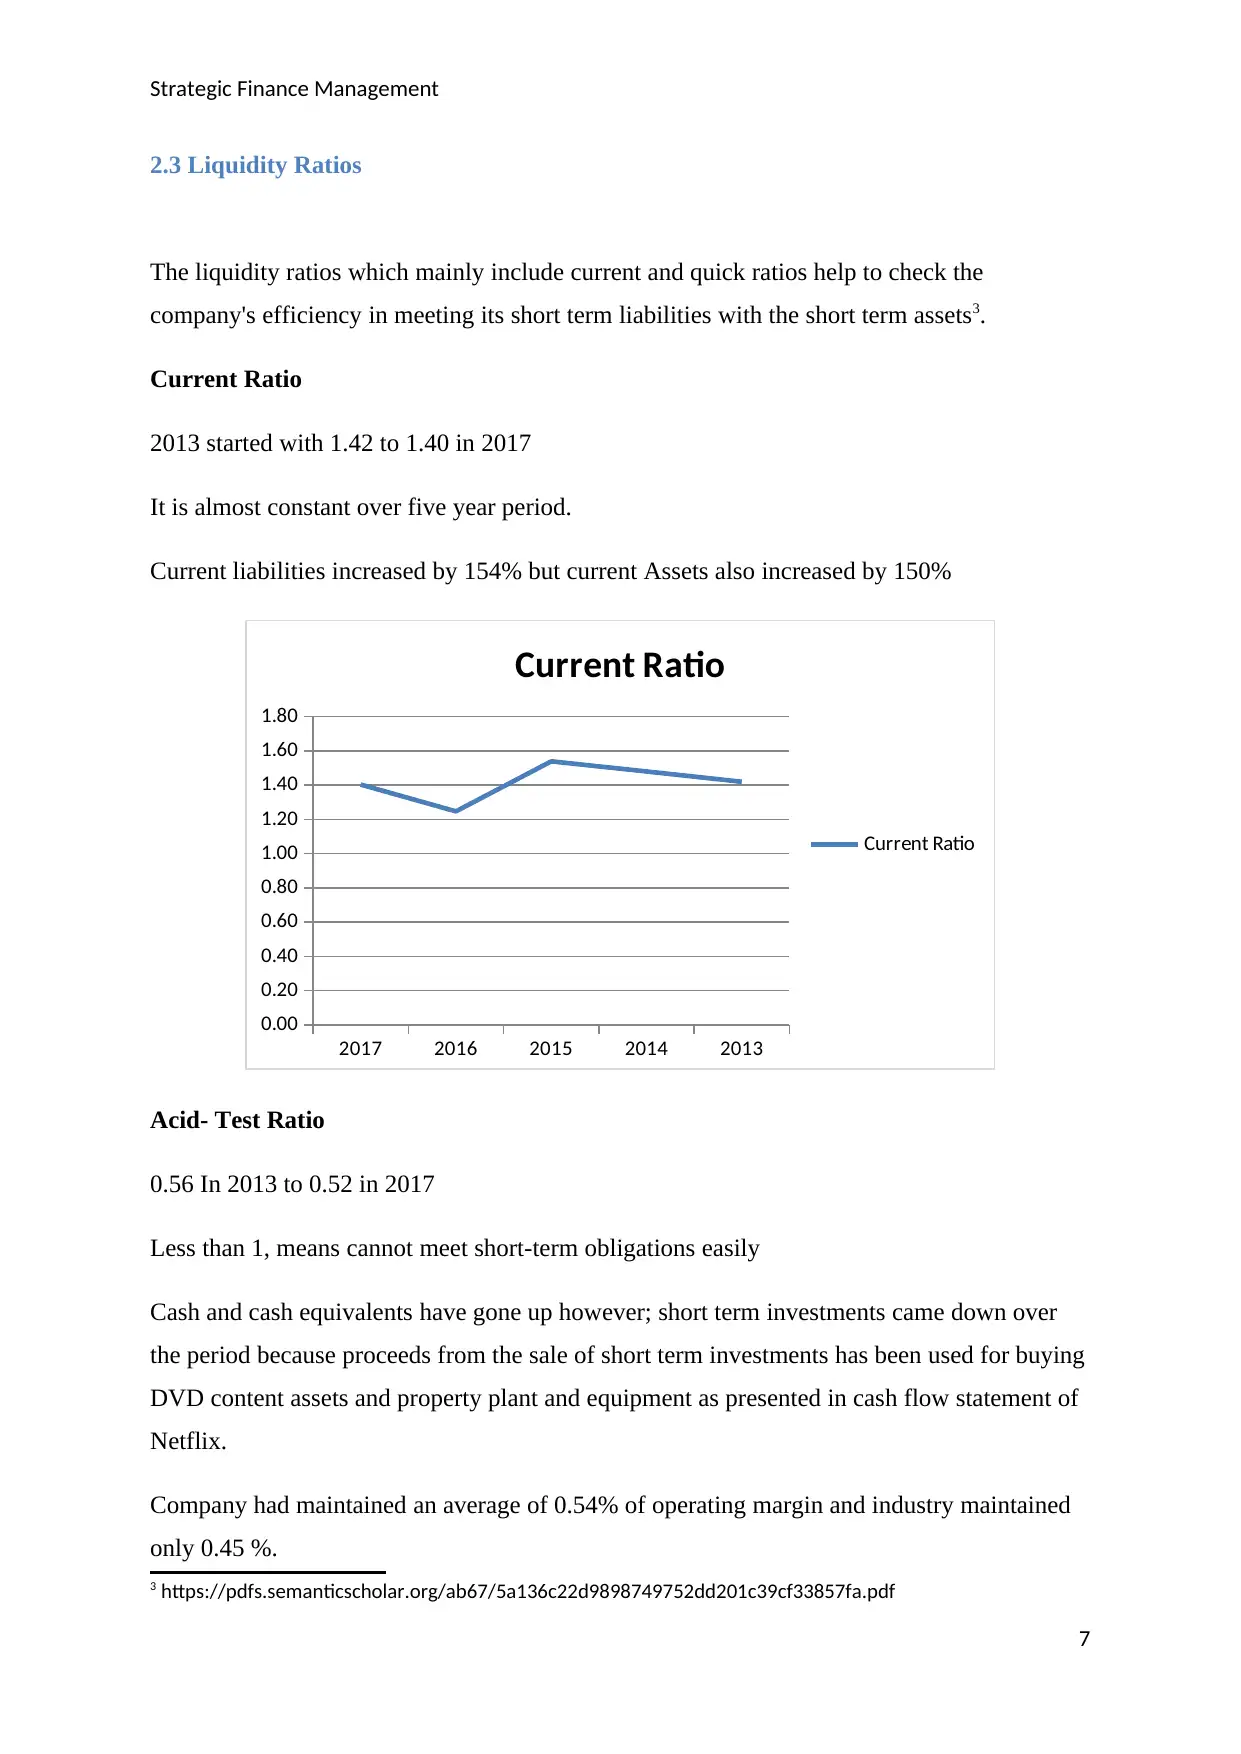
Current Ratio
2013 started with 1.42 to 1.40 in 2017
It is almost constant over five year period.
Current liabilities increased by 154% but current Assets also increased by 150%
2017 2016 2015 2014 2013
0.00
0.20
0.40
0.60
0.80
1.00
1.20
1.40
1.60
1.80
Current Ratio
Current Ratio
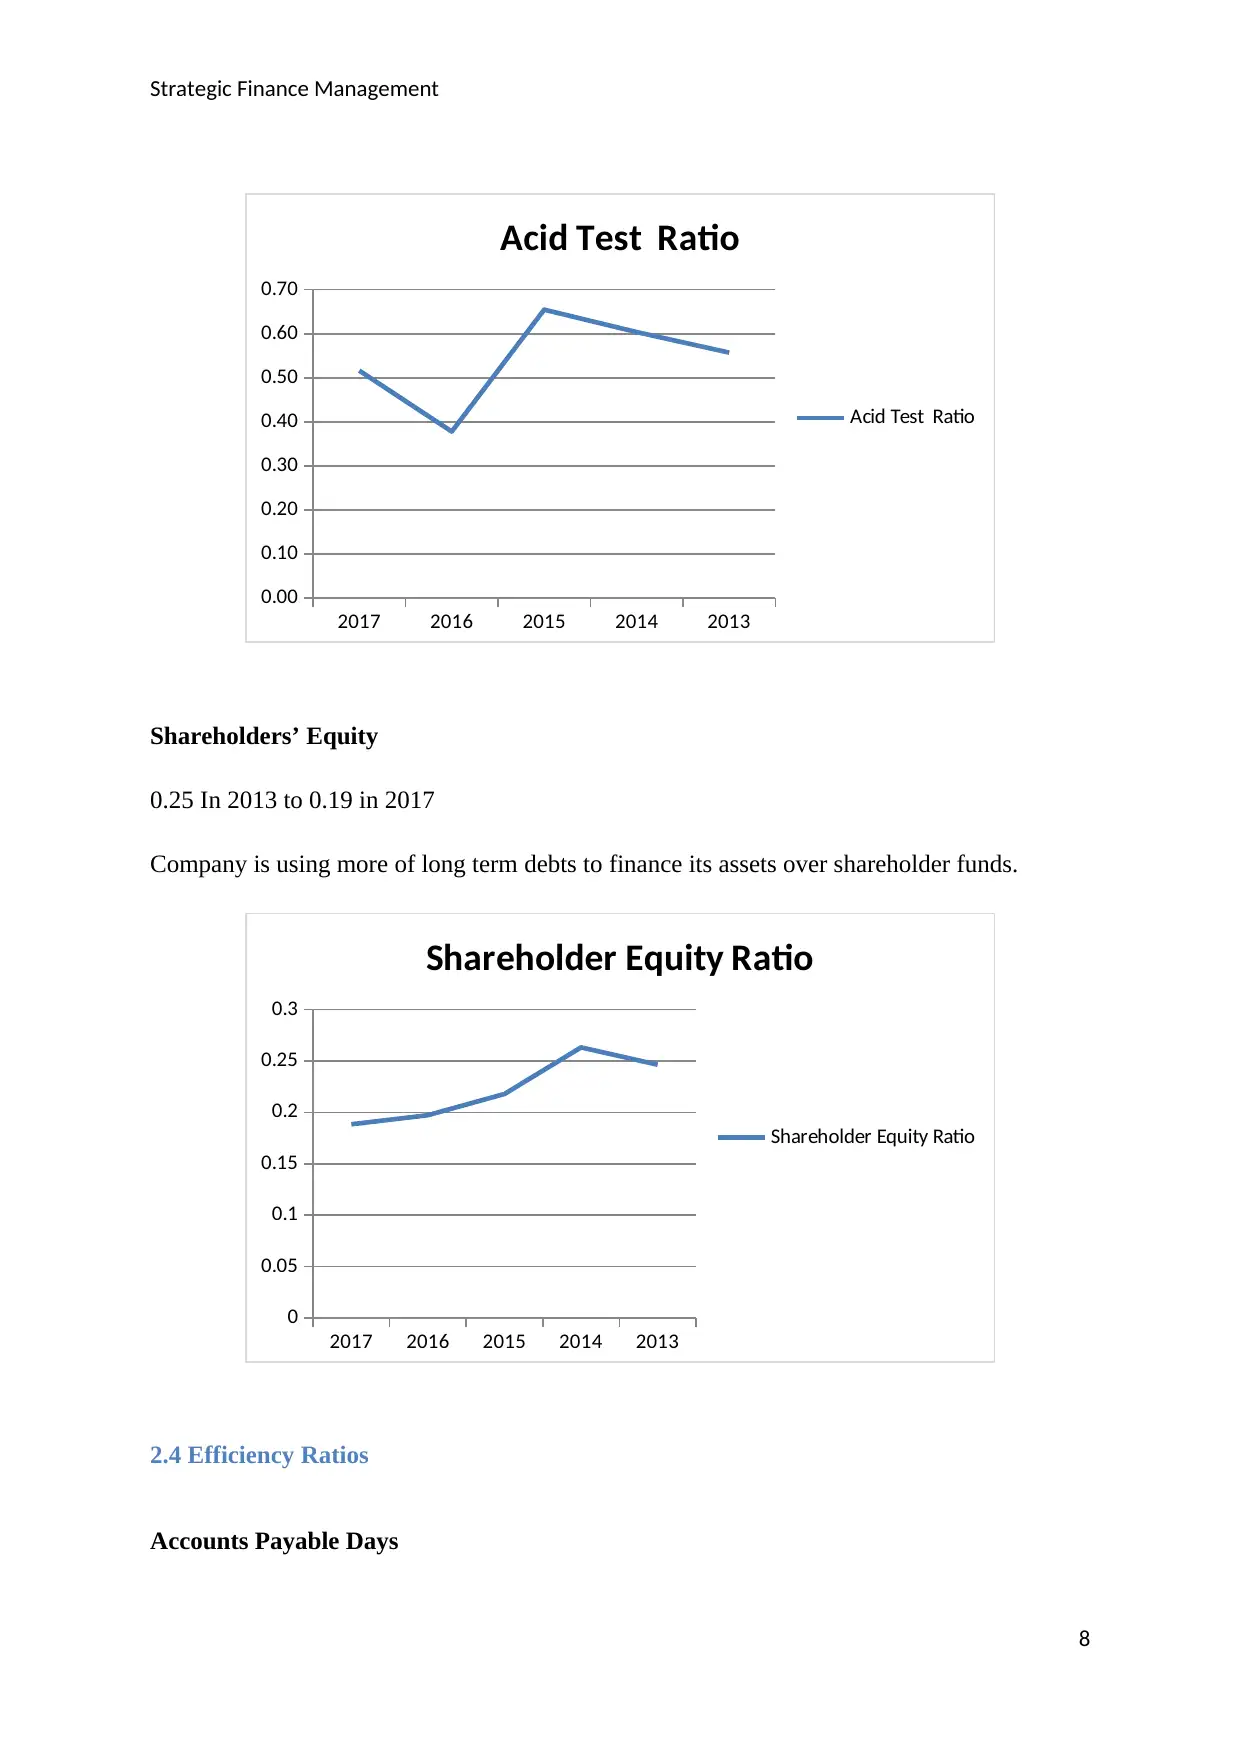
Acid- Test Ratio
0.56 In 2013 to 0.52 in 2017
Less than 1, means cannot meet short-term obligations easily
Cash and cash equivalents have gone up however; short term investments came down over
the period because proceeds from the sale of short term investments has been used for buying
DVD content assets and property plant and equipment as presented in cash flow statement of
Netflix.
Company had maintained an average of 0.54% of operating margin and industry maintained
only 0.45 %.
3 https://pdfs.semanticscholar.org/ab67/5a136c22d9898749752dd201c39cf33857fa.pdf
7
2.3 Liquidity Ratios
The liquidity ratios which mainly include current and quick ratios help to check the
company's efficiency in meeting its short term liabilities with the short term assets3.
Current Ratio
2013 started with 1.42 to 1.40 in 2017
It is almost constant over five year period.
Current liabilities increased by 154% but current Assets also increased by 150%
2017 2016 2015 2014 2013
0.00
0.20
0.40
0.60
0.80
1.00
1.20
1.40
1.60
1.80
Current Ratio
Current Ratio
Acid- Test Ratio
0.56 In 2013 to 0.52 in 2017
Less than 1, means cannot meet short-term obligations easily
Cash and cash equivalents have gone up however; short term investments came down over
the period because proceeds from the sale of short term investments has been used for buying
DVD content assets and property plant and equipment as presented in cash flow statement of
Netflix.
Company had maintained an average of 0.54% of operating margin and industry maintained
only 0.45 %.
3 https://pdfs.semanticscholar.org/ab67/5a136c22d9898749752dd201c39cf33857fa.pdf
7
Strategic Finance Management
2017 2016 2015 2014 2013
0.00
0.10
0.20
0.30
0.40
0.50
0.60
0.70
Acid Test Ratio
Acid Test Ratio
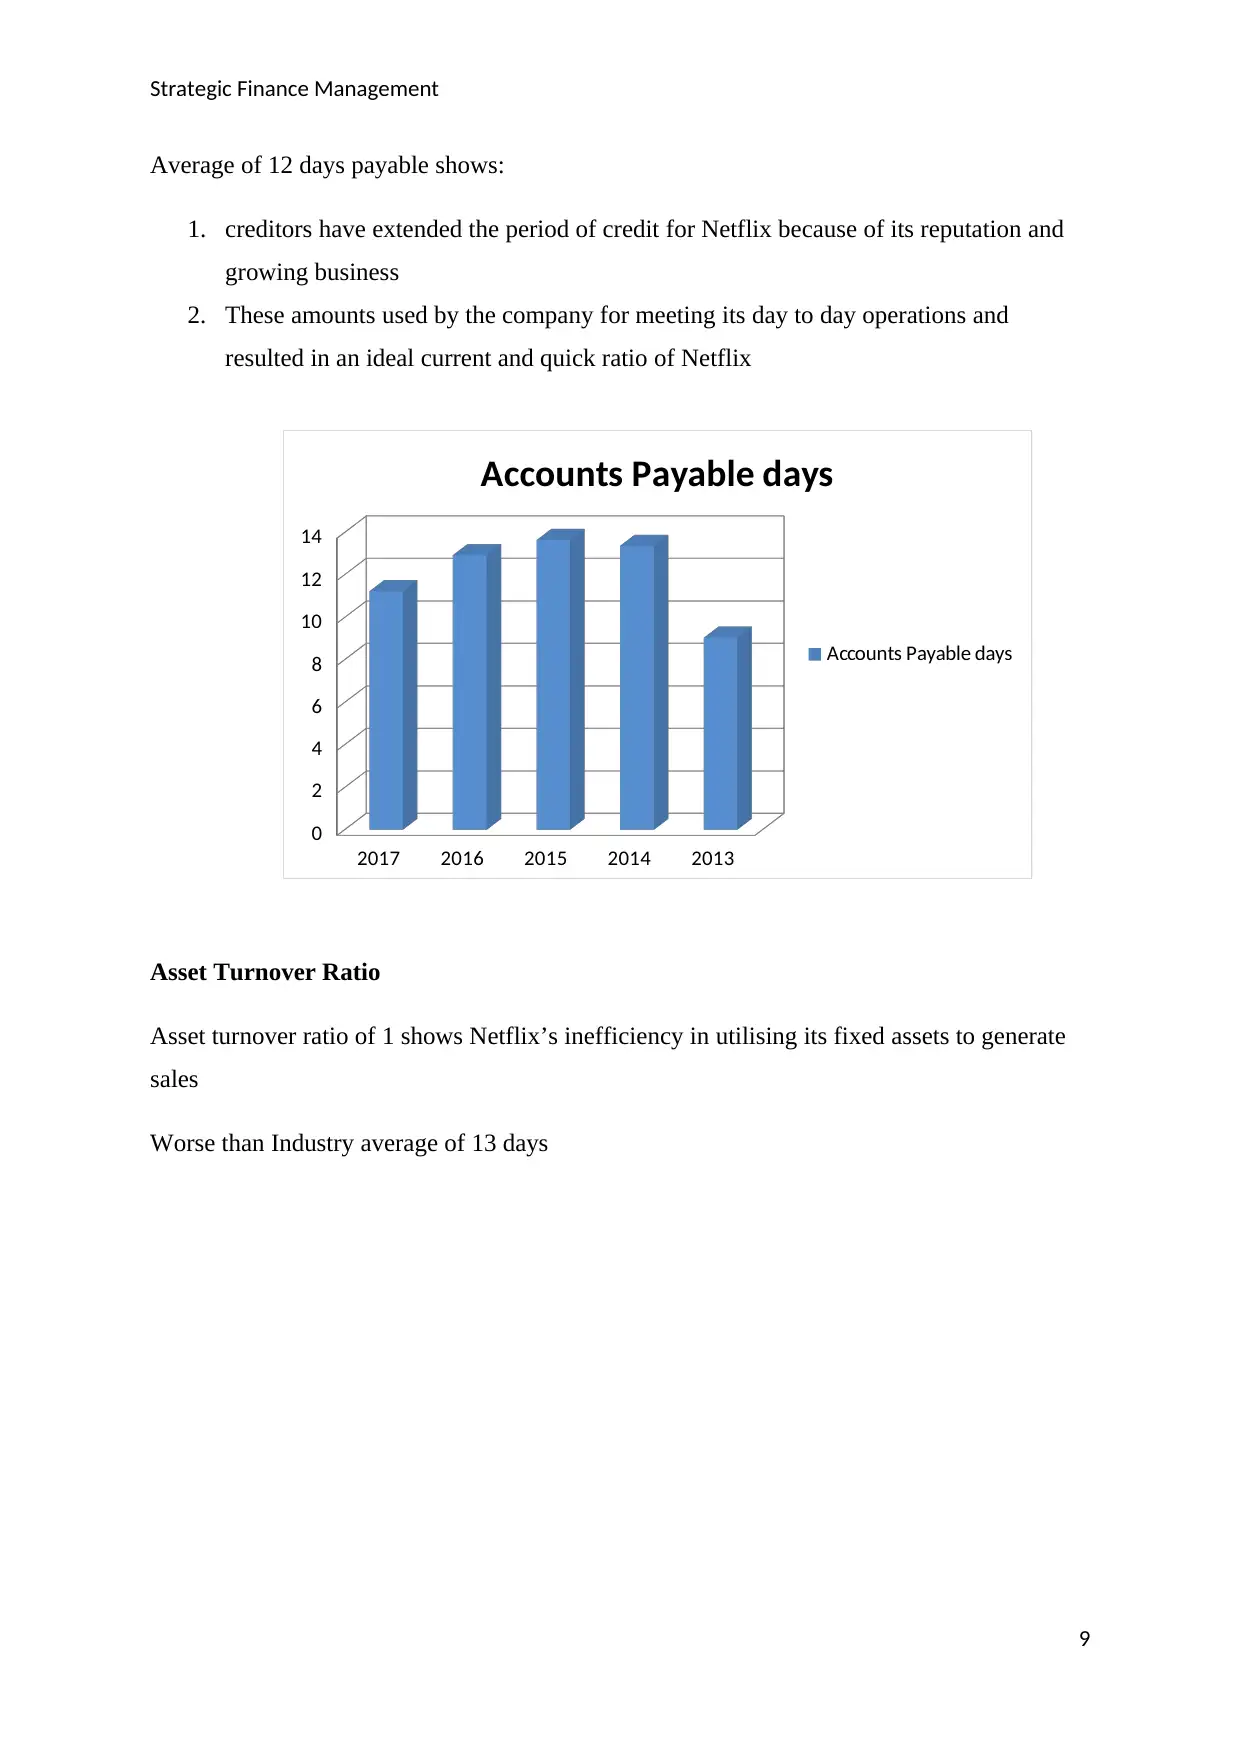
Shareholders’ Equity
0.25 In 2013 to 0.19 in 2017
Company is using more of long term debts to finance its assets over shareholder funds.
2017 2016 2015 2014 2013
0
0.05
0.1
0.15
0.2
0.25
0.3
Shareholder Equity Ratio
Shareholder Equity Ratio
2.4 Efficiency Ratios
Accounts Payable Days
8
2017 2016 2015 2014 2013
0.00
0.10
0.20
0.30
0.40
0.50
0.60
0.70
Acid Test Ratio
Acid Test Ratio
Shareholders’ Equity
0.25 In 2013 to 0.19 in 2017
Company is using more of long term debts to finance its assets over shareholder funds.
2017 2016 2015 2014 2013
0
0.05
0.1
0.15
0.2
0.25
0.3
Shareholder Equity Ratio
Shareholder Equity Ratio
2.4 Efficiency Ratios
Accounts Payable Days
8
⊘ This is a preview!⊘
Do you want full access?
Subscribe today to unlock all pages.
Trusted by 1+ million students worldwide
Strategic Finance Management
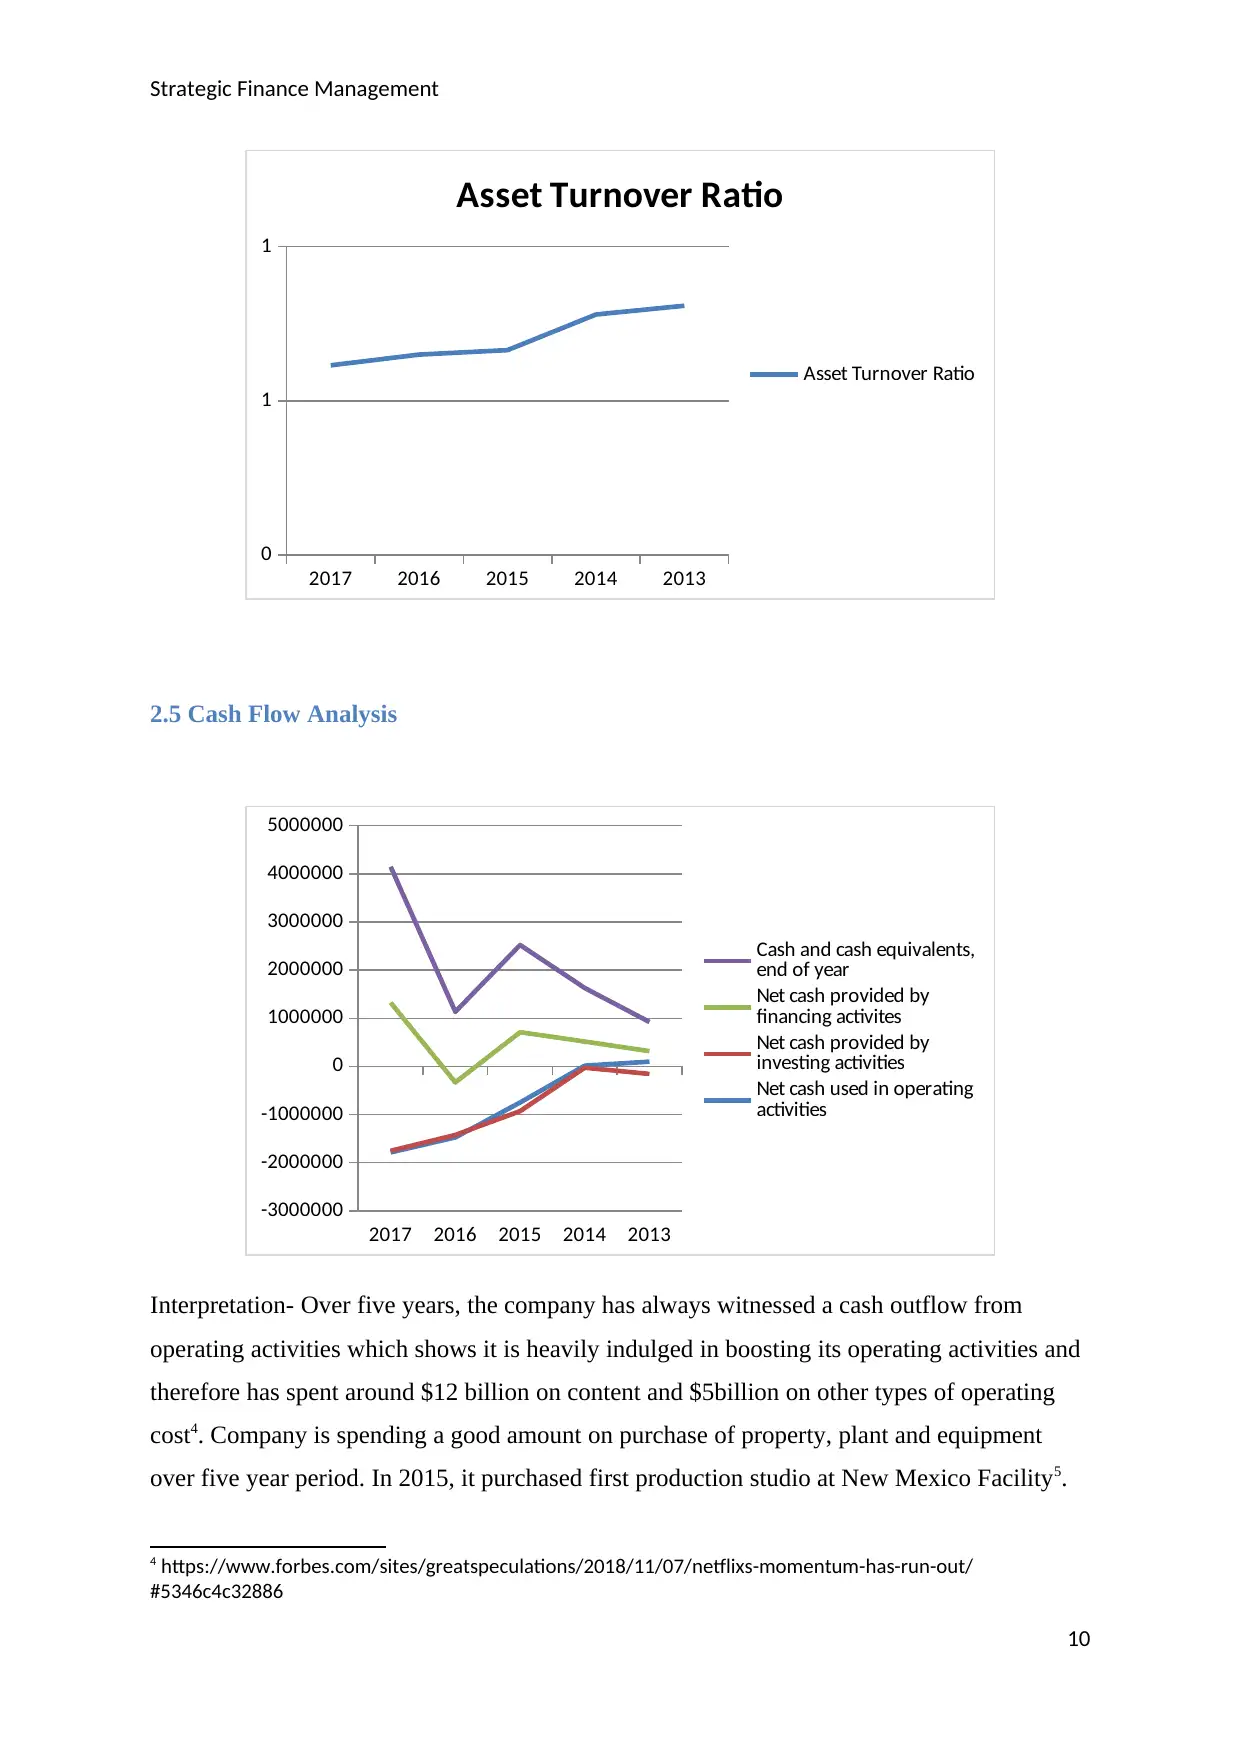
Average of 12 days payable shows:
1. creditors have extended the period of credit for Netflix because of its reputation and
growing business
2. These amounts used by the company for meeting its day to day operations and
resulted in an ideal current and quick ratio of Netflix
2017 2016 2015 2014 2013
0
2
4
6
8
10
12
14
Accounts Payable days
Accounts Payable days
Asset Turnover Ratio
Asset turnover ratio of 1 shows Netflix’s inefficiency in utilising its fixed assets to generate
sales
Worse than Industry average of 13 days
9
Paraphrase This Document
Need a fresh take? Get an instant paraphrase of this document with our AI Paraphraser
Strategic Finance Management
2017 2016 2015 2014 2013
0
1
1
Asset Turnover Ratio
Asset Turnover Ratio
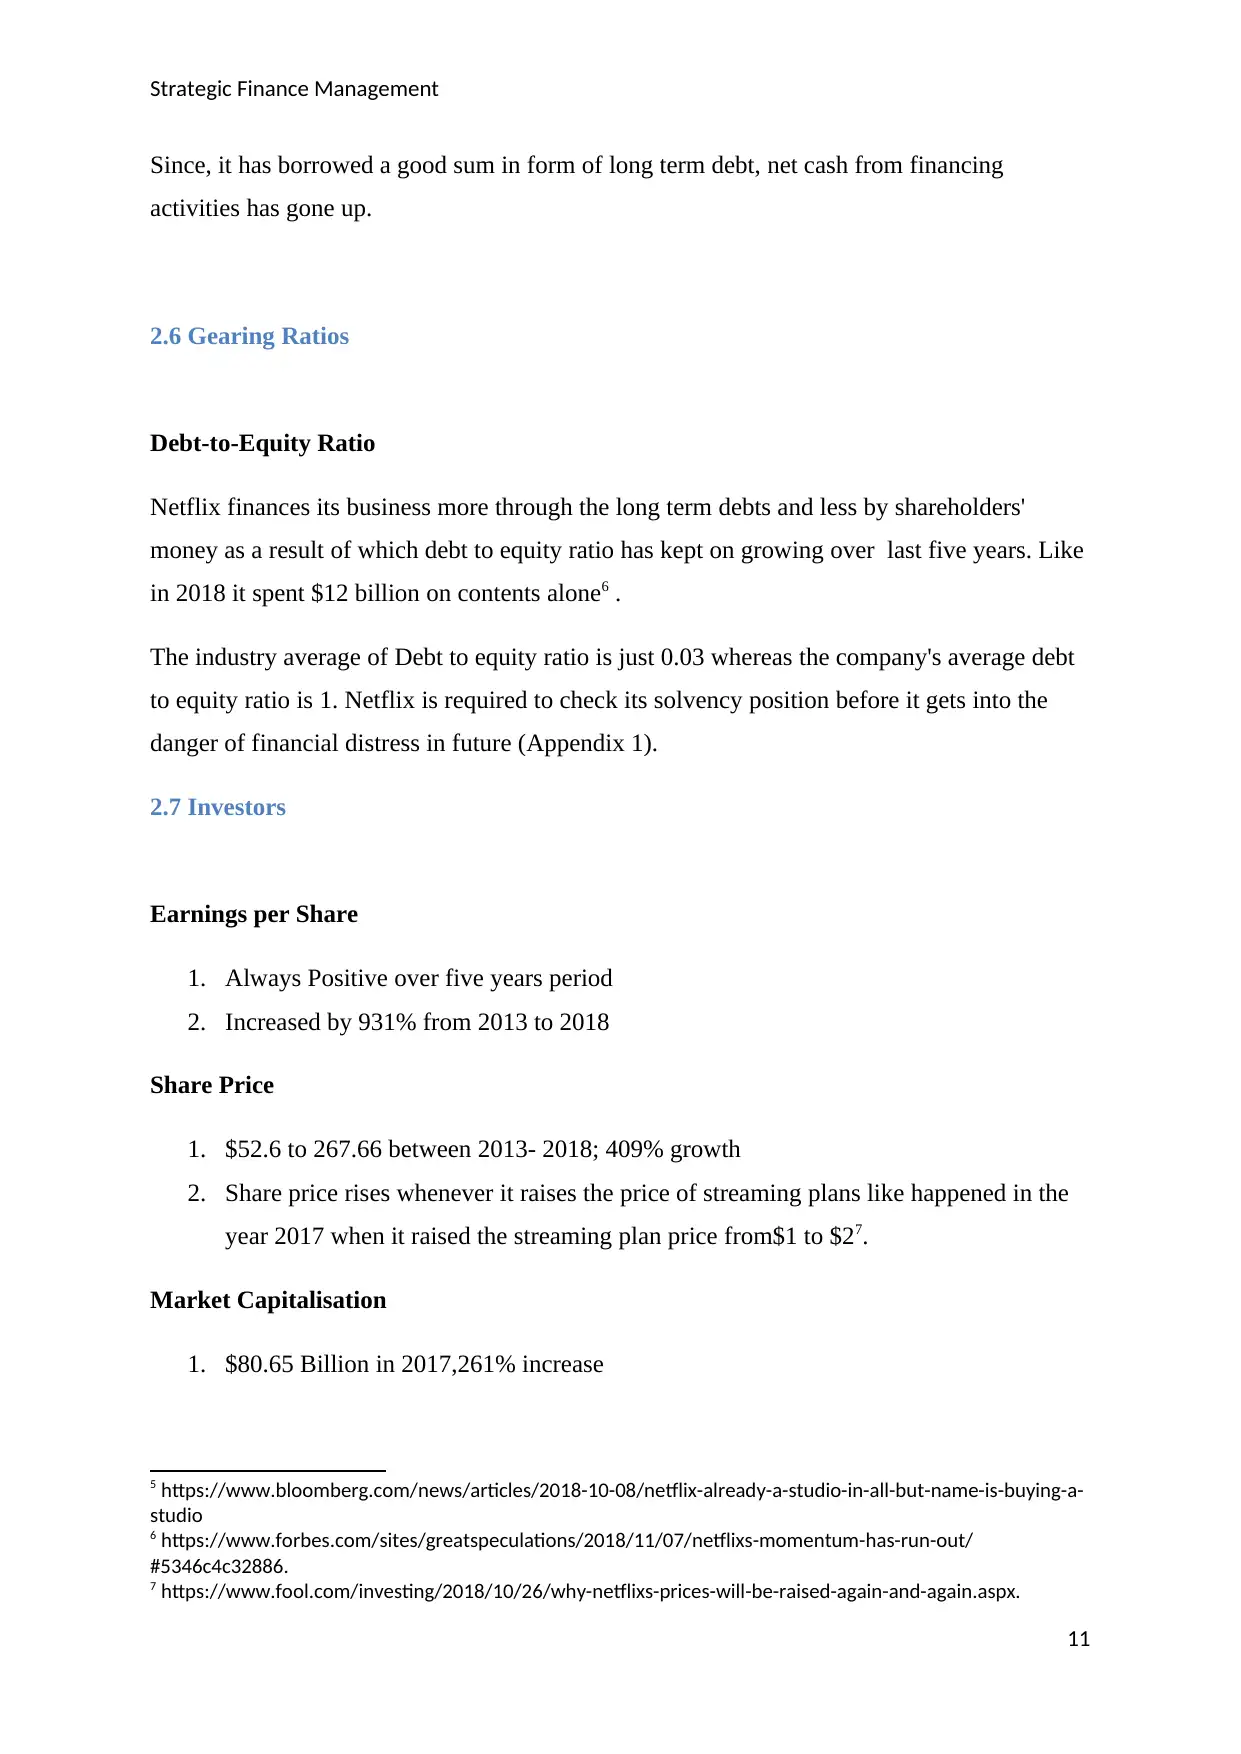
2.5 Cash Flow Analysis
2017 2016 2015 2014 2013
-3000000
-2000000
-1000000
0
1000000
2000000
3000000
4000000
5000000
Cash and cash equivalents,
end of year
Net cash provided by
financing activites
Net cash provided by
investing activities
Net cash used in operating
activities
Interpretation- Over five years, the company has always witnessed a cash outflow from
operating activities which shows it is heavily indulged in boosting its operating activities and
therefore has spent around $12 billion on content and $5billion on other types of operating
cost4. Company is spending a good amount on purchase of property, plant and equipment
over five year period. In 2015, it purchased first production studio at New Mexico Facility5.
4 https://www.forbes.com/sites/greatspeculations/2018/11/07/netflixs-momentum-has-run-out/
#5346c4c32886
10
2017 2016 2015 2014 2013
0
1
1
Asset Turnover Ratio
Asset Turnover Ratio
2.5 Cash Flow Analysis
2017 2016 2015 2014 2013
-3000000
-2000000
-1000000
0
1000000
2000000
3000000
4000000
5000000
Cash and cash equivalents,
end of year
Net cash provided by
financing activites
Net cash provided by
investing activities
Net cash used in operating
activities
Interpretation- Over five years, the company has always witnessed a cash outflow from
operating activities which shows it is heavily indulged in boosting its operating activities and
therefore has spent around $12 billion on content and $5billion on other types of operating
cost4. Company is spending a good amount on purchase of property, plant and equipment
over five year period. In 2015, it purchased first production studio at New Mexico Facility5.
4 https://www.forbes.com/sites/greatspeculations/2018/11/07/netflixs-momentum-has-run-out/
#5346c4c32886
10
Strategic Finance Management
Since, it has borrowed a good sum in form of long term debt, net cash from financing
activities has gone up.
2.6 Gearing Ratios
Debt-to-Equity Ratio
Netflix finances its business more through the long term debts and less by shareholders'
money as a result of which debt to equity ratio has kept on growing over last five years. Like
in 2018 it spent $12 billion on contents alone6 .
The industry average of Debt to equity ratio is just 0.03 whereas the company's average debt
to equity ratio is 1. Netflix is required to check its solvency position before it gets into the
danger of financial distress in future (Appendix 1).
2.7 Investors
Earnings per Share
1. Always Positive over five years period
2. Increased by 931% from 2013 to 2018
Share Price
1. $52.6 to 267.66 between 2013- 2018; 409% growth
2. Share price rises whenever it raises the price of streaming plans like happened in the
year 2017 when it raised the streaming plan price from$1 to $27.
Market Capitalisation
1. $80.65 Billion in 2017,261% increase
5 https://www.bloomberg.com/news/articles/2018-10-08/netflix-already-a-studio-in-all-but-name-is-buying-a-
studio
6 https://www.forbes.com/sites/greatspeculations/2018/11/07/netflixs-momentum-has-run-out/
#5346c4c32886.
7 https://www.fool.com/investing/2018/10/26/why-netflixs-prices-will-be-raised-again-and-again.aspx.
11
⊘ This is a preview!⊘
Do you want full access?
Subscribe today to unlock all pages.
Trusted by 1+ million students worldwide
1 out of 37
Related Documents


Your All-in-One AI-Powered Toolkit for Academic Success.
+13062052269
info@desklib.com
Available 24*7 on WhatsApp / Email
![[object Object]](/_next/static/media/star-bottom.7253800d.svg)
Unlock your academic potential
Copyright © 2020–2026 A2Z Services. All Rights Reserved. Developed and managed by ZUCOL.