Financial Analysis Report: Liquidity, Ratios, and Stakeholder Analysis
VerifiedAdded on 2020/03/04
|5
|1748
|59
Report
AI Summary
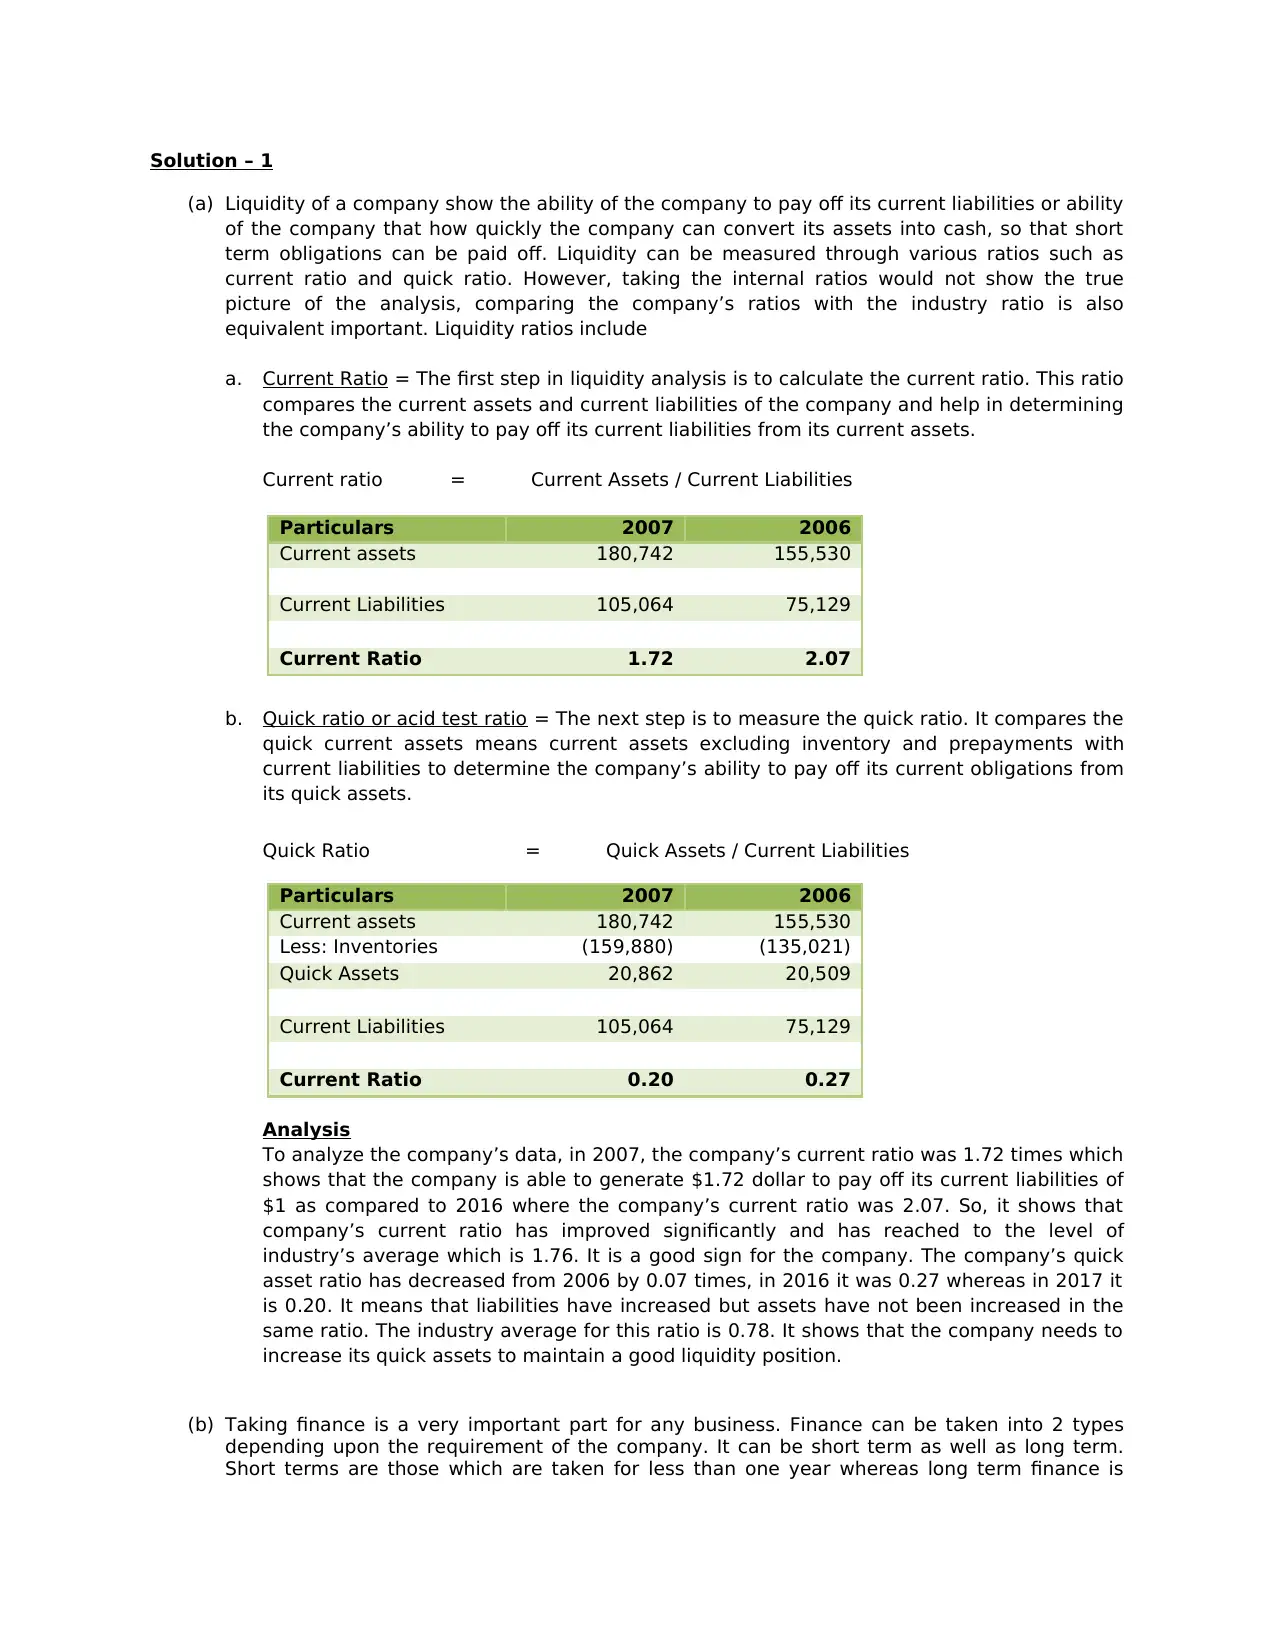
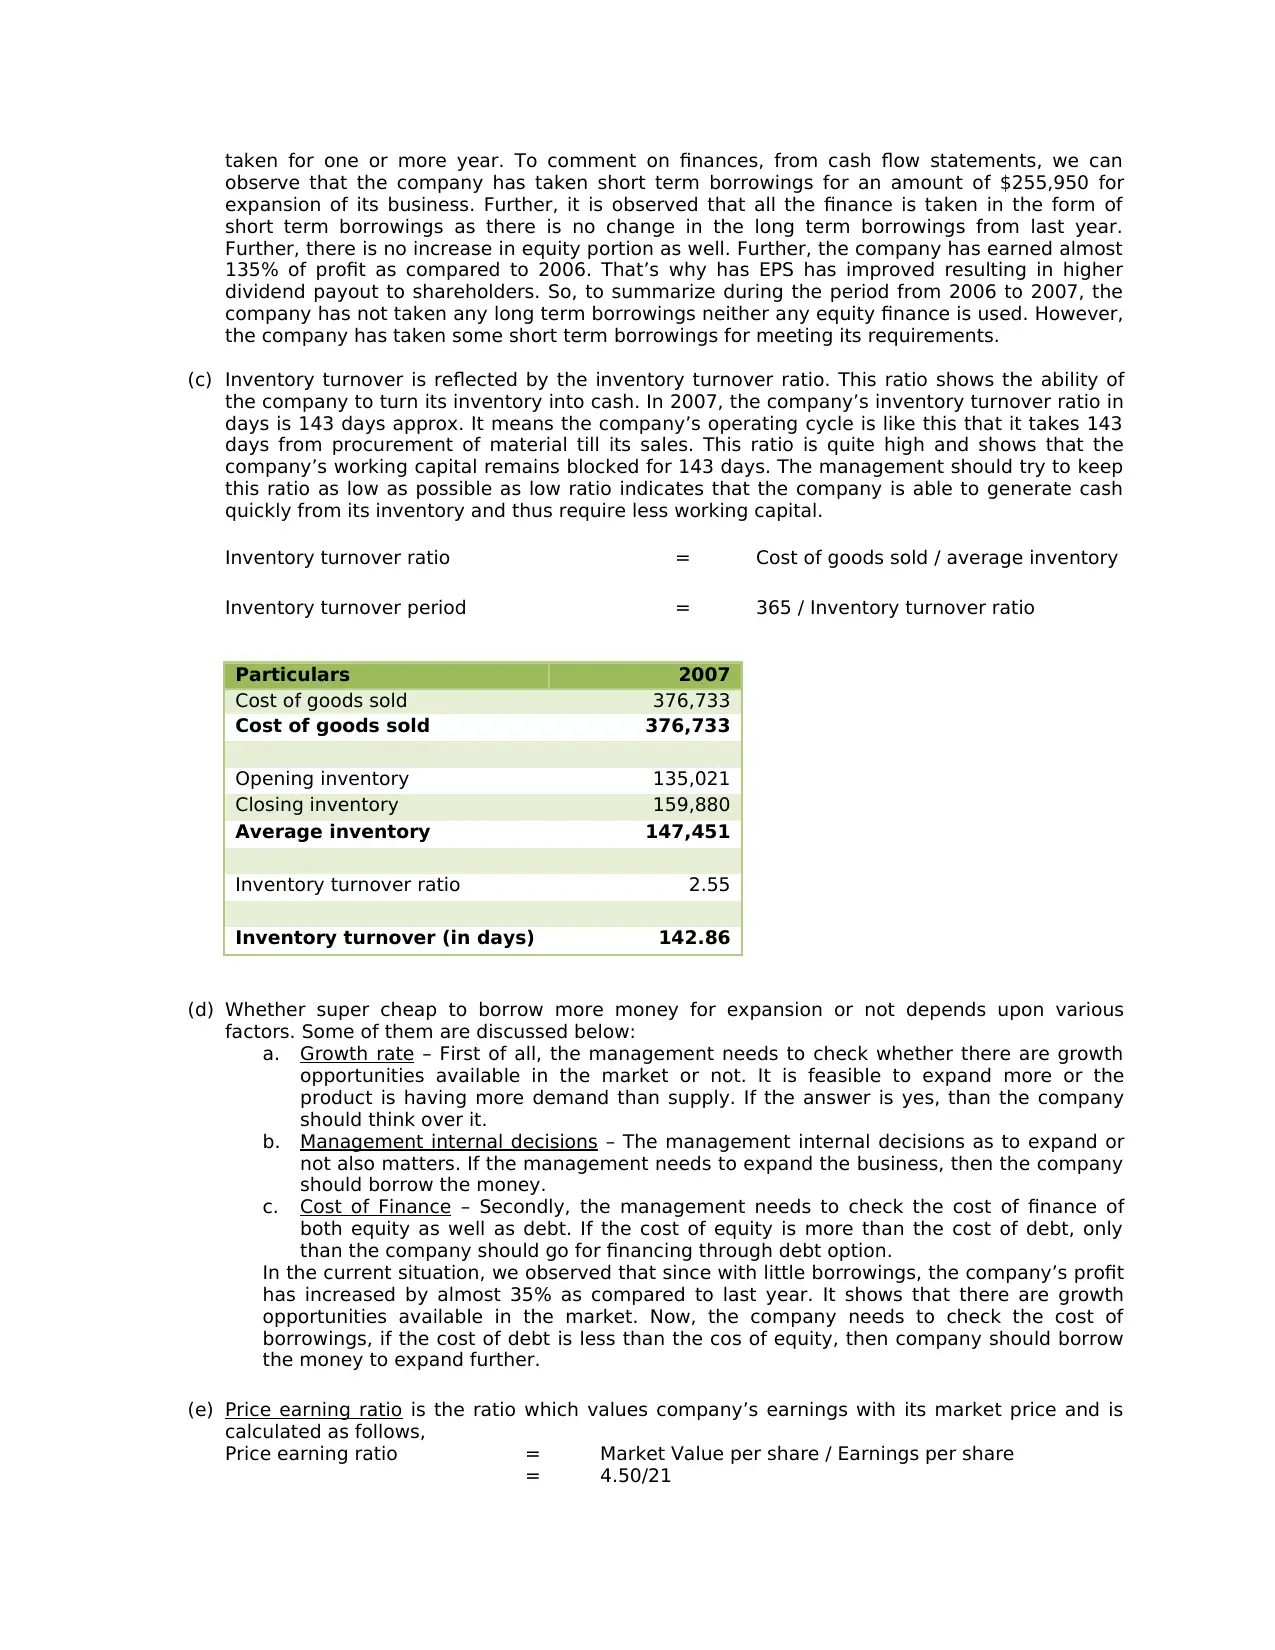
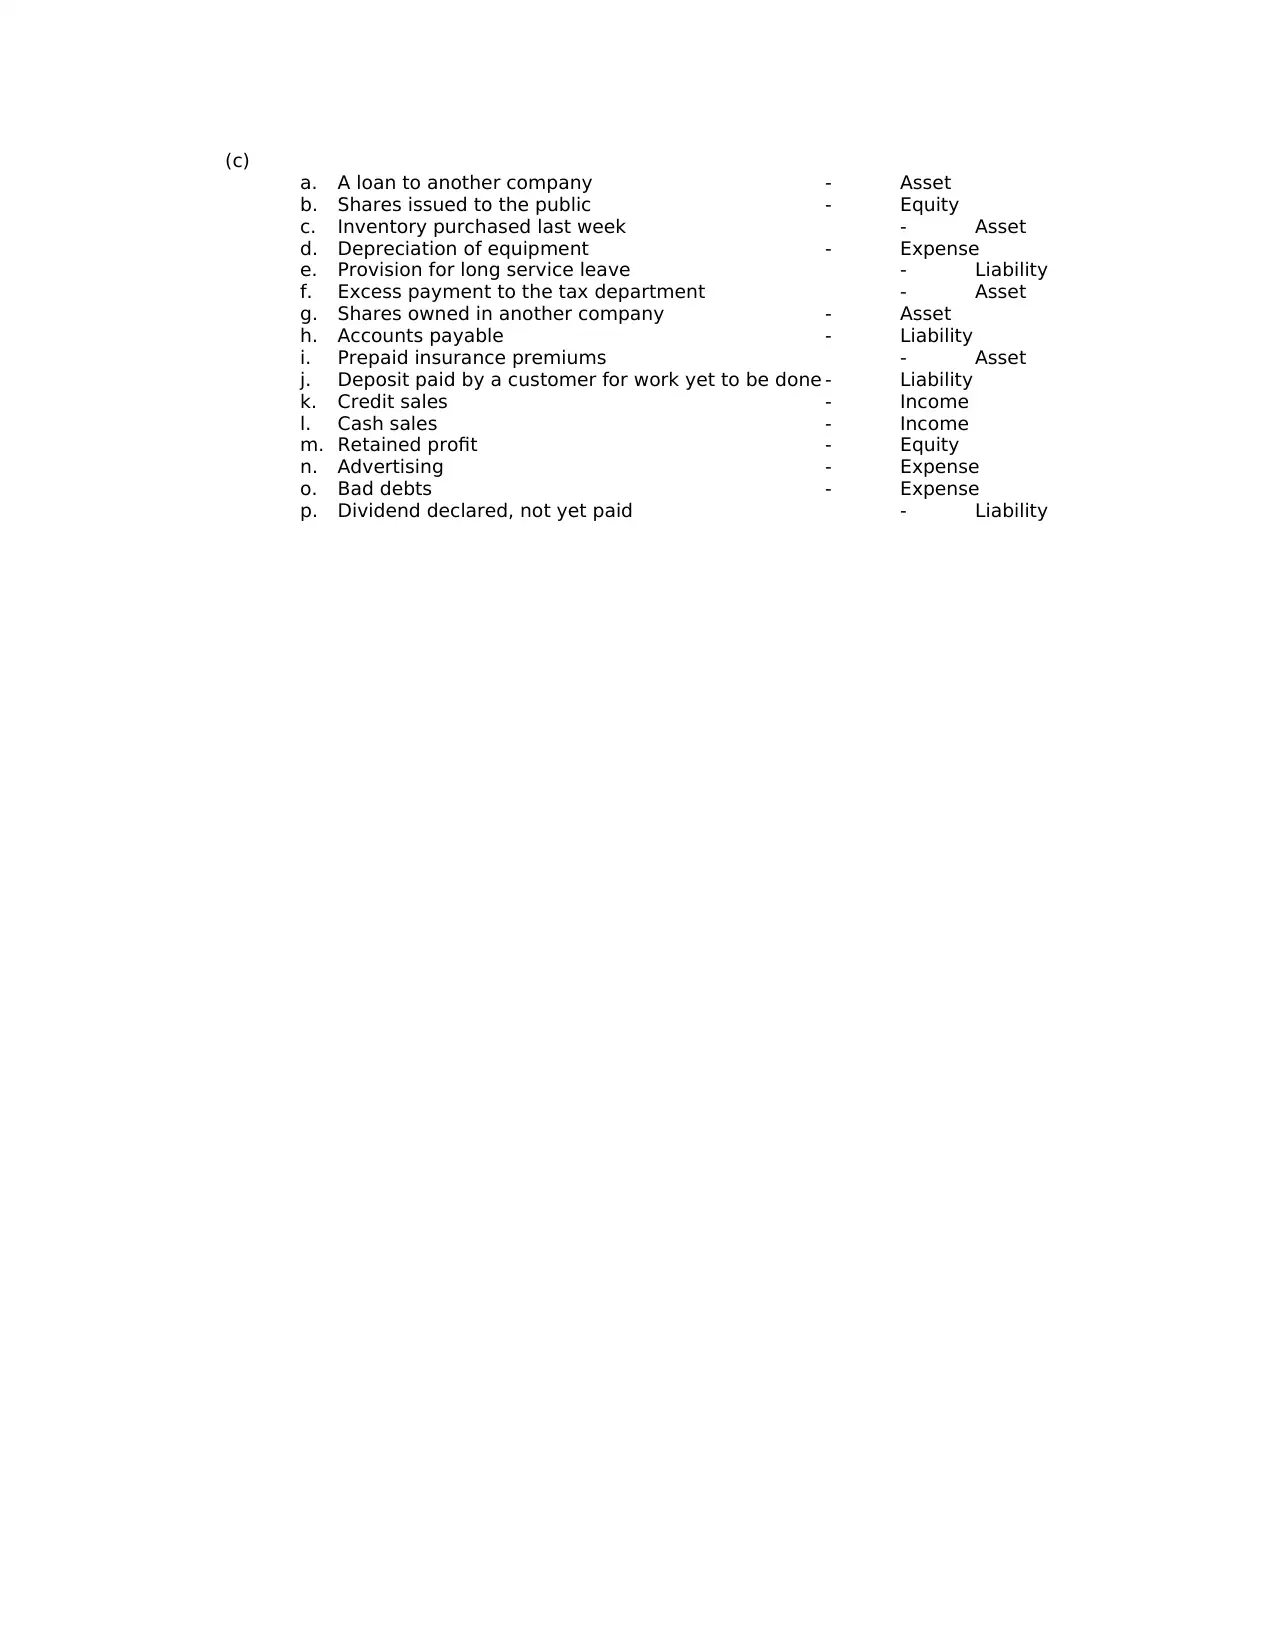
This report provides a financial analysis of a company, focusing on liquidity and key financial ratios. The analysis includes the calculation and interpretation of the current ratio, quick ratio, and inventory turnover ratio to assess the company's ability to meet its short-term obligations and manage its working capital. The report also examines the company's financing strategies, including short-term borrowings and the use of equity, and discusses the impact of these decisions on profitability and shareholder value. Furthermore, the report evaluates the company's price-earnings ratio and dividend yield ratio to assess its market valuation and attractiveness to investors. The report also identifies and explains the information needs of different users of financial statements, including equity shareholders, investors/lenders, potential investors/creditors/suppliers, and government agencies. Finally, the report categorizes various financial transactions as assets, liabilities, equity, income, or expenses, providing a comprehensive overview of the company's financial position and performance.

Solution – 1
(a) Liquidity of a company show the ability of the company to pay off its current liabilities or ability
of the company that how quickly the company can convert its assets into cash, so that short
term obligations can be paid off. Liquidity can be measured through various ratios such as
current ratio and quick ratio. However, taking the internal ratios would not show the true
picture of the analysis, comparing the company’s ratios with the industry ratio is also
equivalent important. Liquidity ratios include
a. Current Ratio = The first step in liquidity analysis is to calculate the current ratio. This ratio
compares the current assets and current liabilities of the company and help in determining
the company’s ability to pay off its current liabilities from its current assets.
Current ratio = Current Assets / Current Liabilities
Particulars 2007 2006
Current assets 180,742 155,530
Current Liabilities 105,064 75,129
Current Ratio 1.72 2.07
b. Quick ratio or acid test ratio = The next step is to measure the quick ratio. It compares the
quick current assets means current assets excluding inventory and prepayments with
current liabilities to determine the company’s ability to pay off its current obligations from
its quick assets.
Quick Ratio = Quick Assets / Current Liabilities
Particulars 2007 2006
Current assets 180,742 155,530
Less: Inventories (159,880) (135,021)
Quick Assets 20,862 20,509
Current Liabilities 105,064 75,129
Current Ratio 0.20 0.27
Analysis
To analyze the company’s data, in 2007, the company’s current ratio was 1.72 times which
shows that the company is able to generate $1.72 dollar to pay off its current liabilities of
$1 as compared to 2016 where the company’s current ratio was 2.07. So, it shows that
company’s current ratio has improved significantly and has reached to the level of
industry’s average which is 1.76. It is a good sign for the company. The company’s quick
asset ratio has decreased from 2006 by 0.07 times, in 2016 it was 0.27 whereas in 2017 it
is 0.20. It means that liabilities have increased but assets have not been increased in the
same ratio. The industry average for this ratio is 0.78. It shows that the company needs to
increase its quick assets to maintain a good liquidity position.
(b) Taking finance is a very important part for any business. Finance can be taken into 2 types
depending upon the requirement of the company. It can be short term as well as long term.
Short terms are those which are taken for less than one year whereas long term finance is
Paraphrase This Document
Need a fresh take? Get an instant paraphrase of this document with our AI Paraphraser

taken for one or more year. To comment on finances, from cash flow statements, we can
observe that the company has taken short term borrowings for an amount of $255,950 for
expansion of its business. Further, it is observed that all the finance is taken in the form of
short term borrowings as there is no change in the long term borrowings from last year.
Further, there is no increase in equity portion as well. Further, the company has earned almost
135% of profit as compared to 2006. That’s why has EPS has improved resulting in higher
dividend payout to shareholders. So, to summarize during the period from 2006 to 2007, the
company has not taken any long term borrowings neither any equity finance is used. However,
the company has taken some short term borrowings for meeting its requirements.
(c) Inventory turnover is reflected by the inventory turnover ratio. This ratio shows the ability of
the company to turn its inventory into cash. In 2007, the company’s inventory turnover ratio in
days is 143 days approx. It means the company’s operating cycle is like this that it takes 143
days from procurement of material till its sales. This ratio is quite high and shows that the
company’s working capital remains blocked for 143 days. The management should try to keep
this ratio as low as possible as low ratio indicates that the company is able to generate cash
quickly from its inventory and thus require less working capital.
Inventory turnover ratio = Cost of goods sold / average inventory
Inventory turnover period = 365 / Inventory turnover ratio
Particulars 2007
Cost of goods sold 376,733
Opening inventory 135,021
Closing inventory 159,880
Average inventory 147,451
Inventory turnover ratio 2.55
Inventory turnover (in days) 142.86
(d) Whether super cheap to borrow more money for expansion or not depends upon various
factors. Some of them are discussed below:
a. Growth rate – First of all, the management needs to check whether there are growth
opportunities available in the market or not. It is feasible to expand more or the
product is having more demand than supply. If the answer is yes, than the company
should think over it.
b. Management internal decisions – The management internal decisions as to expand or
not also matters. If the management needs to expand the business, then the company
should borrow the money.
c. Cost of Finance – Secondly, the management needs to check the cost of finance of
both equity as well as debt. If the cost of equity is more than the cost of debt, only
than the company should go for financing through debt option.
In the current situation, we observed that since with little borrowings, the company’s profit
has increased by almost 35% as compared to last year. It shows that there are growth
opportunities available in the market. Now, the company needs to check the cost of
borrowings, if the cost of debt is less than the cos of equity, then company should borrow
the money to expand further.
(e) Price earning ratio is the ratio which values company’s earnings with its market price and is
calculated as follows,
Price earning ratio = Market Value per share / Earnings per share
= 4.50/21

= 0.214 times
The company’s PE ratio for 2007 is 0.214 times whereas the industry average is 16.70 times. It
shows that the company’s shares are undervalued in the market. In books, they are showing a
value of $21 whereas in market these are at $4.50.
Dividend yield ratio shows the dividend in comparison to its market price. It is calculated as,
Dividend Yield Ratio = Dividend Per share / Market Price per share
= 10.5 / 4.50
= 2.33 %
Dividend yield ratio shows that how much an investor is getting with an investment of $1. For
217, the dividend yield ratio is 2.33 % which means that an investor is getting $2.33 against
$1 invested in the business. The sector average for this ratio is 3.7%. This shows that the
company should improve its dividend yield further.
⊘ This is a preview!⊘
Do you want full access?
Subscribe today to unlock all pages.

Trusted by 1+ million students worldwide

Answer-2
(a) The four different users of the financial statements are listed below:
a. Equity Shareholders
b. Investors / Lenders
c. Potential Investors / creditors / suppliers
d. Government agencies and institutions
(b) Equity Shareholders are the owners of the company. They Require following information
from the financials:
a. Net Profit earned by the company
b. Earnings per share / book value per share to determine their value of investments
c. Details regarding cash flow to check the liquidity issues
d. Investment made / borrowings taken etc.
The benefit of reading financials by the shareholder is to make the long term investment
decisions and to gain the overall information about the company so that they can take
decisions as to they want to stay invested in the company or not. Further, it helps in
analyzing the growth prospects in their investments.
The limitation of this source of information is that the most of the shareholders are
individual retail investors with minimal knowledge of accounts/ financials. This might result
in improper understanding of results which might create chaos in their minds. Further, the
financials can be window dressed by the management, so they might not reflect the true
picture of the company.
Investors / Lenders are those peoples who have provided the money for running
business to the company, so they always remain concerned about their money. That’s why
they need financials to check the health of the company. They require the information to
check the following:
a. Uses of money provided and its safety
b. Liquidity status of the company
c. Repaying capacity or credit worthiness of the company
d. Solvency position of the company
e. Fulfillment of covenants or breach of covenants
The benefit of reading financials is to check the performance and profitability of the
company and to ascertain the safety of finance prided by them and can decide whether to
lend the funds to the company or not. Further, the covenants on which loan was provided
to the company are getting fulfilled or not. As in the case of breach of covenants the
lenders are eligible to take the money back from the company.
The limitation of this source of information is that the financials can be window dressed by
the management and might not reflect the true picture of the business. Further, non-
financials events are not covered by the financials and thus, the readers might not be able
to know about these facts.
Paraphrase This Document
Need a fresh take? Get an instant paraphrase of this document with our AI Paraphraser

(c)
a. A loan to another company - Asset
b. Shares issued to the public - Equity
c. Inventory purchased last week - Asset
d. Depreciation of equipment - Expense
e. Provision for long service leave - Liability
f. Excess payment to the tax department - Asset
g. Shares owned in another company - Asset
h. Accounts payable - Liability
i. Prepaid insurance premiums - Asset
j. Deposit paid by a customer for work yet to be done - Liability
k. Credit sales - Income
l. Cash sales - Income
m. Retained profit - Equity
n. Advertising - Expense
o. Bad debts - Expense
p. Dividend declared, not yet paid - Liability
1 out of 5
Related Documents

Your All-in-One AI-Powered Toolkit for Academic Success.
+13062052269
info@desklib.com
Available 24*7 on WhatsApp / Email
Unlock your academic potential
Copyright © 2020–2025 A2Z Services. All Rights Reserved. Developed and managed by ZUCOL.