Financial Reporting Analysis: Company Performance and Improvement
VerifiedAdded on 2022/12/26
|13
|2854
|32
Report
AI Summary
This report provides an analysis of financial reporting, focusing on a company's performance through its financial statements. The report covers the introduction to financial management, the financial statements (income statement, balance sheet, and cash flow statement), and ratio analysis. It evaluates the company's profitability, liquidity, and efficiency based on the provided data, calculating key ratios for 2015 and 2016. The analysis includes profitability ratios (net and gross profit margin), liquidity ratios (current and quick ratios), and efficiency ratios (sales to capital employed, sales per employee). Based on the analysis, the report identifies areas of strength and weakness in the company's financial performance and suggests strategies for improvement, emphasizing the importance of aligning performance evaluation with the organization's strategic goals. The report concludes with a summary of findings and recommendations for enhancing financial performance.

FINANCIAL REPORTING
Page 1 of 13
Page 1 of 13
Paraphrase This Document
Need a fresh take? Get an instant paraphrase of this document with our AI Paraphraser
Table of Contents
1.0 Introduction................................................................................................................................3
2.0 The concept of Financial Management......................................................................................3
3.0 The financial statements............................................................................................................4
3.1 Income statement...................................................................................................................4
3.2 Balance Sheet.........................................................................................................................5
3.3 Cash Flow Statement.............................................................................................................6
3.4 Ratio Analysis........................................................................................................................6
4.0 Profitability, Liquidity and Efficiency of the company.............................................................7
5.0 How the company can improve the performance......................................................................9
6.0 Conclusion...............................................................................................................................10
7.0 References................................................................................................................................11
Appendices....................................................................................................................................12
Page 2 of 13
1.0 Introduction
A large trading company needs to gather resources from a variety of sources and must use those
resources in selected profitability openings. To ensure that funds are used more wisely and to
bring a reasonable level of profit from profitability, hard cash strategies and plans are required.
Crisis financing can lead a company to liquidation just like an inoperable element, crude
promotion, or high creation costs.
In addition, adequate and sensible funding can bring a variety of benefits to the industry in the
mall. The performance of a commercial enterprise is largely controlled by the way capital goods
are collected, used and distributed. In the modern money-driven economy, the importance of
money has expanded again due to the scale of asset growth and capital creation and movement
strategies.
2.0 The concept of Financial Management
Financial management can be defined as the process of arranging, planning, coordinating, and
managing an organization's financial transactions. Financial management, according to Gutman
and Dougal, is "the act of organizing, acquiring, managing, and monitoring assets used in a
business." He is worried on asset acquisition and utilization.
Understanding, managing, assigning, and receiving an organization's resources and obligations is
part of financial management, as is managing operational financial parameters like consumption,
income, cash payments, income, and benefits.
All of the above, as well as ongoing evaluation, simplification, and adjustment as you work
toward your long-term objectives, are part of practical financial management. As soon as the
company realizes there is an issue, it improves problem solving in a way that does not jeopardies
the long-term objective. The capital structure of an organization, which combines debt and value
accounts to insure the business's long-term liquidity, is evaluated and worked with by a key
manager.
Page 3 of 13
⊘ This is a preview!⊘
Do you want full access?
Subscribe today to unlock all pages.
Trusted by 1+ million students worldwide
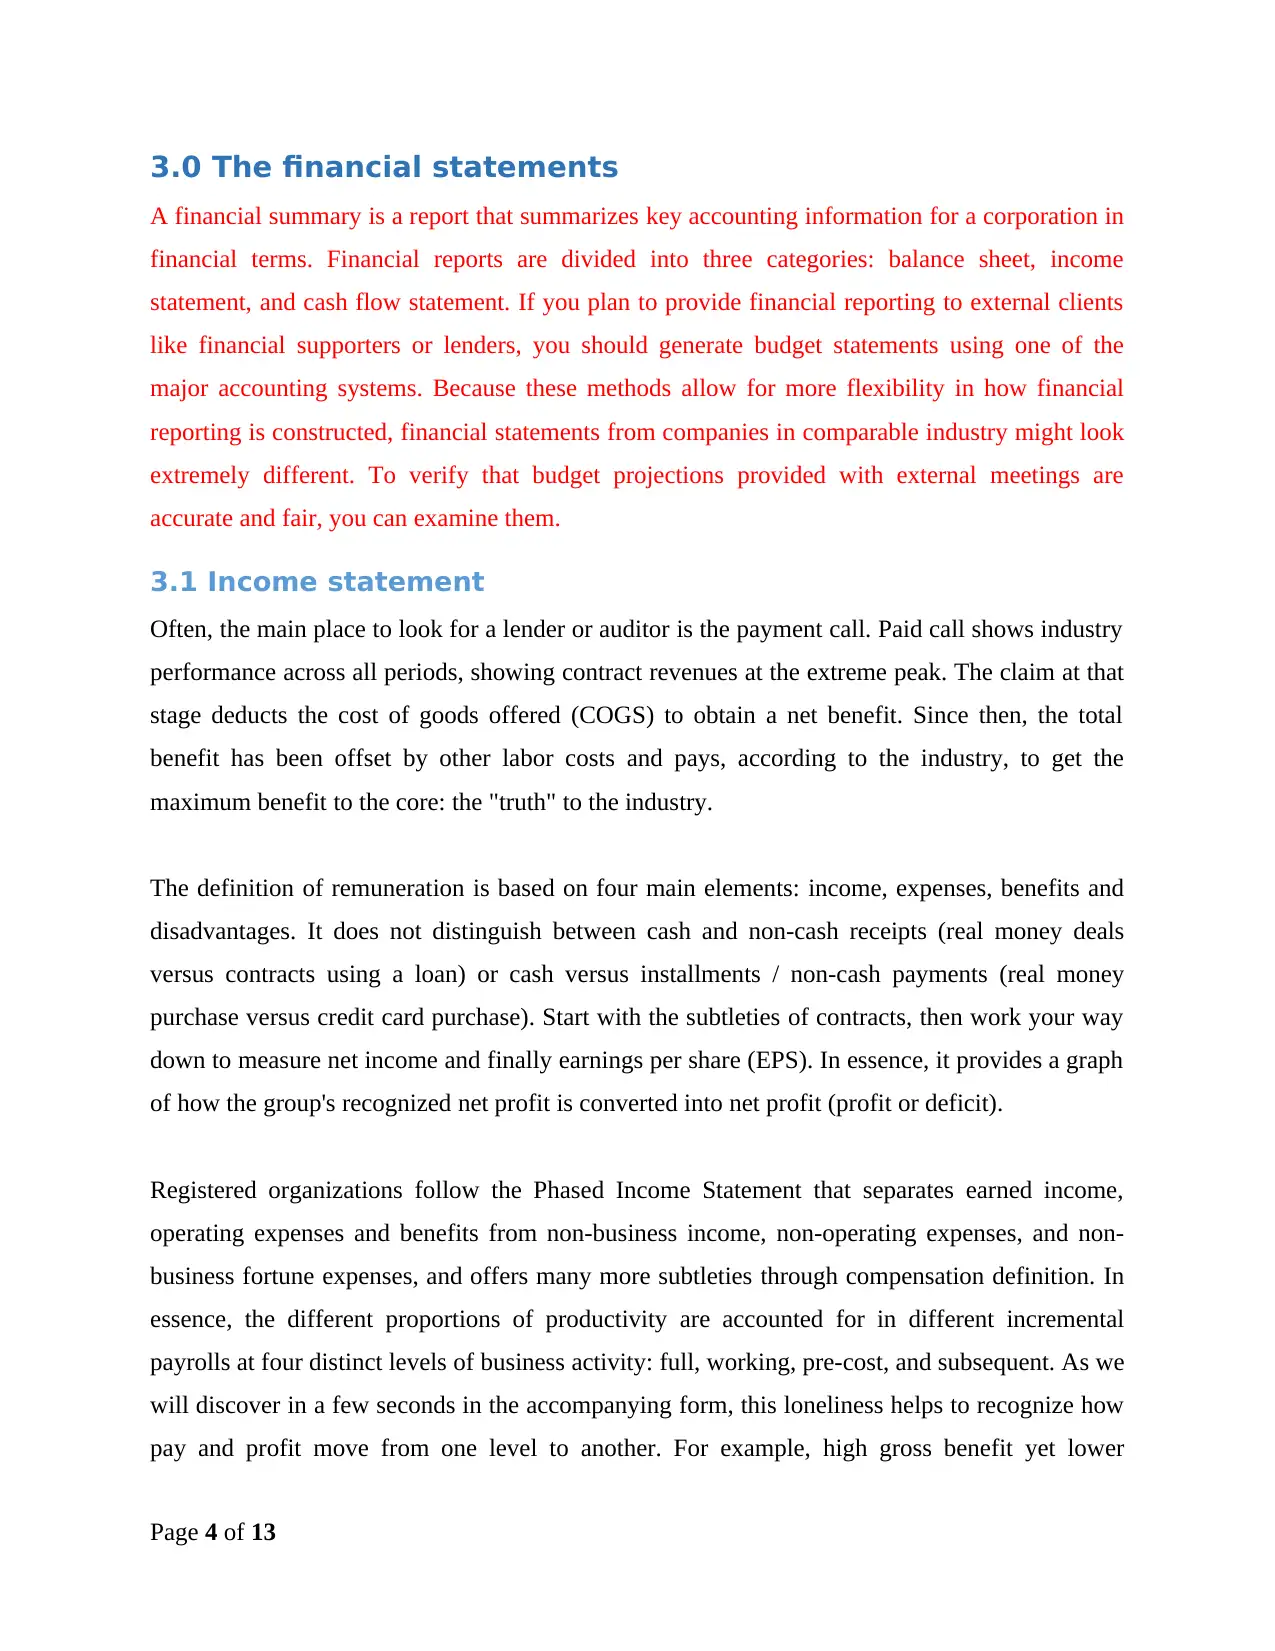
3.0 The financial statements
A financial summary is a report that summarizes key accounting information for a corporation in
financial terms. Financial reports are divided into three categories: balance sheet, income
statement, and cash flow statement. If you plan to provide financial reporting to external clients
like financial supporters or lenders, you should generate budget statements using one of the
major accounting systems. Because these methods allow for more flexibility in how financial
reporting is constructed, financial statements from companies in comparable industry might look
extremely different. To verify that budget projections provided with external meetings are
accurate and fair, you can examine them.
3.1 Income statement
Often, the main place to look for a lender or auditor is the payment call. Paid call shows industry
performance across all periods, showing contract revenues at the extreme peak. The claim at that
stage deducts the cost of goods offered (COGS) to obtain a net benefit. Since then, the total
benefit has been offset by other labor costs and pays, according to the industry, to get the
maximum benefit to the core: the "truth" to the industry.
The definition of remuneration is based on four main elements: income, expenses, benefits and
disadvantages. It does not distinguish between cash and non-cash receipts (real money deals
versus contracts using a loan) or cash versus installments / non-cash payments (real money
purchase versus credit card purchase). Start with the subtleties of contracts, then work your way
down to measure net income and finally earnings per share (EPS). In essence, it provides a graph
of how the group's recognized net profit is converted into net profit (profit or deficit).
Registered organizations follow the Phased Income Statement that separates earned income,
operating expenses and benefits from non-business income, non-operating expenses, and non-
business fortune expenses, and offers many more subtleties through compensation definition. In
essence, the different proportions of productivity are accounted for in different incremental
payrolls at four distinct levels of business activity: full, working, pre-cost, and subsequent. As we
will discover in a few seconds in the accompanying form, this loneliness helps to recognize how
pay and profit move from one level to another. For example, high gross benefit yet lower
Page 4 of 13
Paraphrase This Document
Need a fresh take? Get an instant paraphrase of this document with our AI Paraphraser
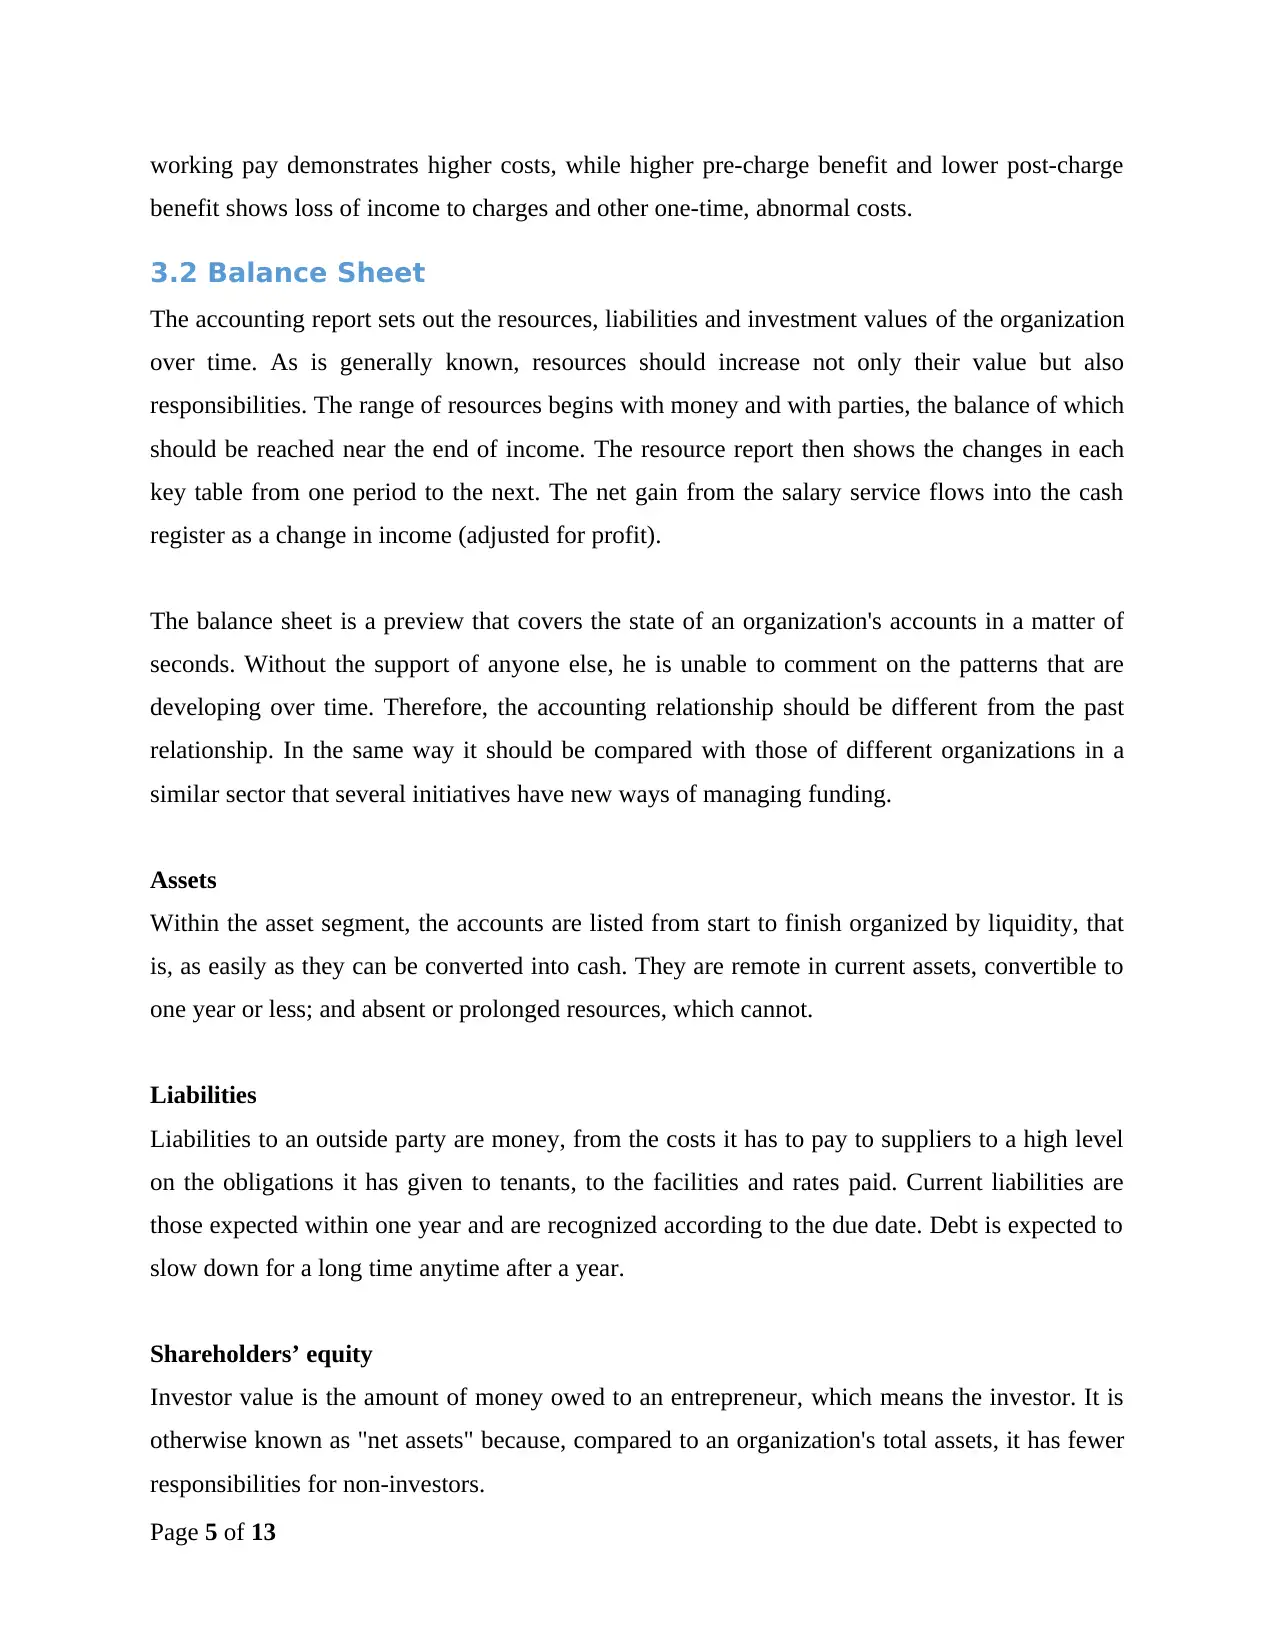
working pay demonstrates higher costs, while higher pre-charge benefit and lower post-charge
benefit shows loss of income to charges and other one-time, abnormal costs.
3.2 Balance Sheet
The accounting report sets out the resources, liabilities and investment values of the organization
over time. As is generally known, resources should increase not only their value but also
responsibilities. The range of resources begins with money and with parties, the balance of which
should be reached near the end of income. The resource report then shows the changes in each
key table from one period to the next. The net gain from the salary service flows into the cash
register as a change in income (adjusted for profit).
The balance sheet is a preview that covers the state of an organization's accounts in a matter of
seconds. Without the support of anyone else, he is unable to comment on the patterns that are
developing over time. Therefore, the accounting relationship should be different from the past
relationship. In the same way it should be compared with those of different organizations in a
similar sector that several initiatives have new ways of managing funding.
Assets
Within the asset segment, the accounts are listed from start to finish organized by liquidity, that
is, as easily as they can be converted into cash. They are remote in current assets, convertible to
one year or less; and absent or prolonged resources, which cannot.
Liabilities
Liabilities to an outside party are money, from the costs it has to pay to suppliers to a high level
on the obligations it has given to tenants, to the facilities and rates paid. Current liabilities are
those expected within one year and are recognized according to the due date. Debt is expected to
slow down for a long time anytime after a year.
Shareholders’ equity
Investor value is the amount of money owed to an entrepreneur, which means the investor. It is
otherwise known as "net assets" because, compared to an organization's total assets, it has fewer
responsibilities for non-investors.
Page 5 of 13
Retained earnings are the net income that an organization reinvests in business or uses to pay
attention to a liability; the rest is distributed to investors as profits. Treasury stock is the stock
that an organization has repurchased. It tends to be sold in the future without being too long to
raise or hold money to detect an acquisition.
Some organizations withdraw their preferred stock, listed independently of normal stock below
investor value. Preferred stock is referred to as a self-determined average value - as well as,
sometimes, normal stock - which doesn't make much of a difference to the market estimate of
offers (on average, the average value is only $ 0.01). The "regular stock" and "preferred stock"
accounts are determined by increasing the average incentive based on the volume of offers made.
3.3 Cash Flow Statement
The cash flow statement deducts the net profit and adjusts it for any non-cash expenses. At that
point, using the changes not yet explained, you can get the page, use it and get rid of the money.
The income statement shows the change in real money over time, just like the initial balance and
the last cash balance.
CFS allows financial backers to see how an organization's activities are performed, where its
money comes from, and how the money is spent. CFS is important because it helps lenders
decide if an organization has a strong cash balance. Banks can then use the CFS to determine the
amount of money available (known as liquidity) to fund the organization’s operating costs and
meet its obligations.
3.4 Ratio Analysis
Ratio analysis is an analysis of the details in company budget reports. Quota analysis is used
to evaluate various factors based on content, such as liquidity, business productivity, and
profitability. This type of analysis is particularly useful for non-business analysts, since the
necessary summary of the association data is the budget summary. A rational study is less
valuable to physical psychologists, who have better access to more detailed data about
society.
Page 6 of 13
⊘ This is a preview!⊘
Do you want full access?
Subscribe today to unlock all pages.
Trusted by 1+ million students worldwide
Financial statement analysis is the way to understand a company's risk and profit through an
analysis of quoted cash data. An audit ration as a center for assessing and assessing credit
risk and for conducting organizational assessment is essential. A cash allowance, or
accounting allowance, is derived from an organization's tax records and is an account that
shows the general level of selected mathematical characteristics extracted from these budget
reports. It is especially useful when used in two different ways:
• Trend line: Work out each segment over a large number of detailed times to see if there
is a pattern in the data provided. The model can reveal financial problems that would not
be apparent in any case if the allowances were monitored for a lone period. Similarly, you
can use the model lines to evaluate the running end of the future allowances.
• Industry comparison: Calculate equal allowances for competitors in a similar industry
and analyze the results across all groups surveyed. Given that these groups tend to
operate with relative profitability of fixed assets and have a comparable capital build-up,
the side effects of a quota survey should be comparable. If this does not happen, it can
reveal an expected problem, or vice versa - the ability of a company to create a profit that
is far greater than the rest of the industry. The business analysis method is used for the
area survey, to understand which organizations within an industry are most important
(and least).
Ratio analysis may be expected to be published in the future, however. Fertile groups for the
most part shine in strong proportions bringing it all together in areas, where an unseen
detection of scarcity in an area can trigger a critical stock market auction. Lenders can use
allowance analysis effectively and all figures that should determine the allowances can be
found in group tax reports.
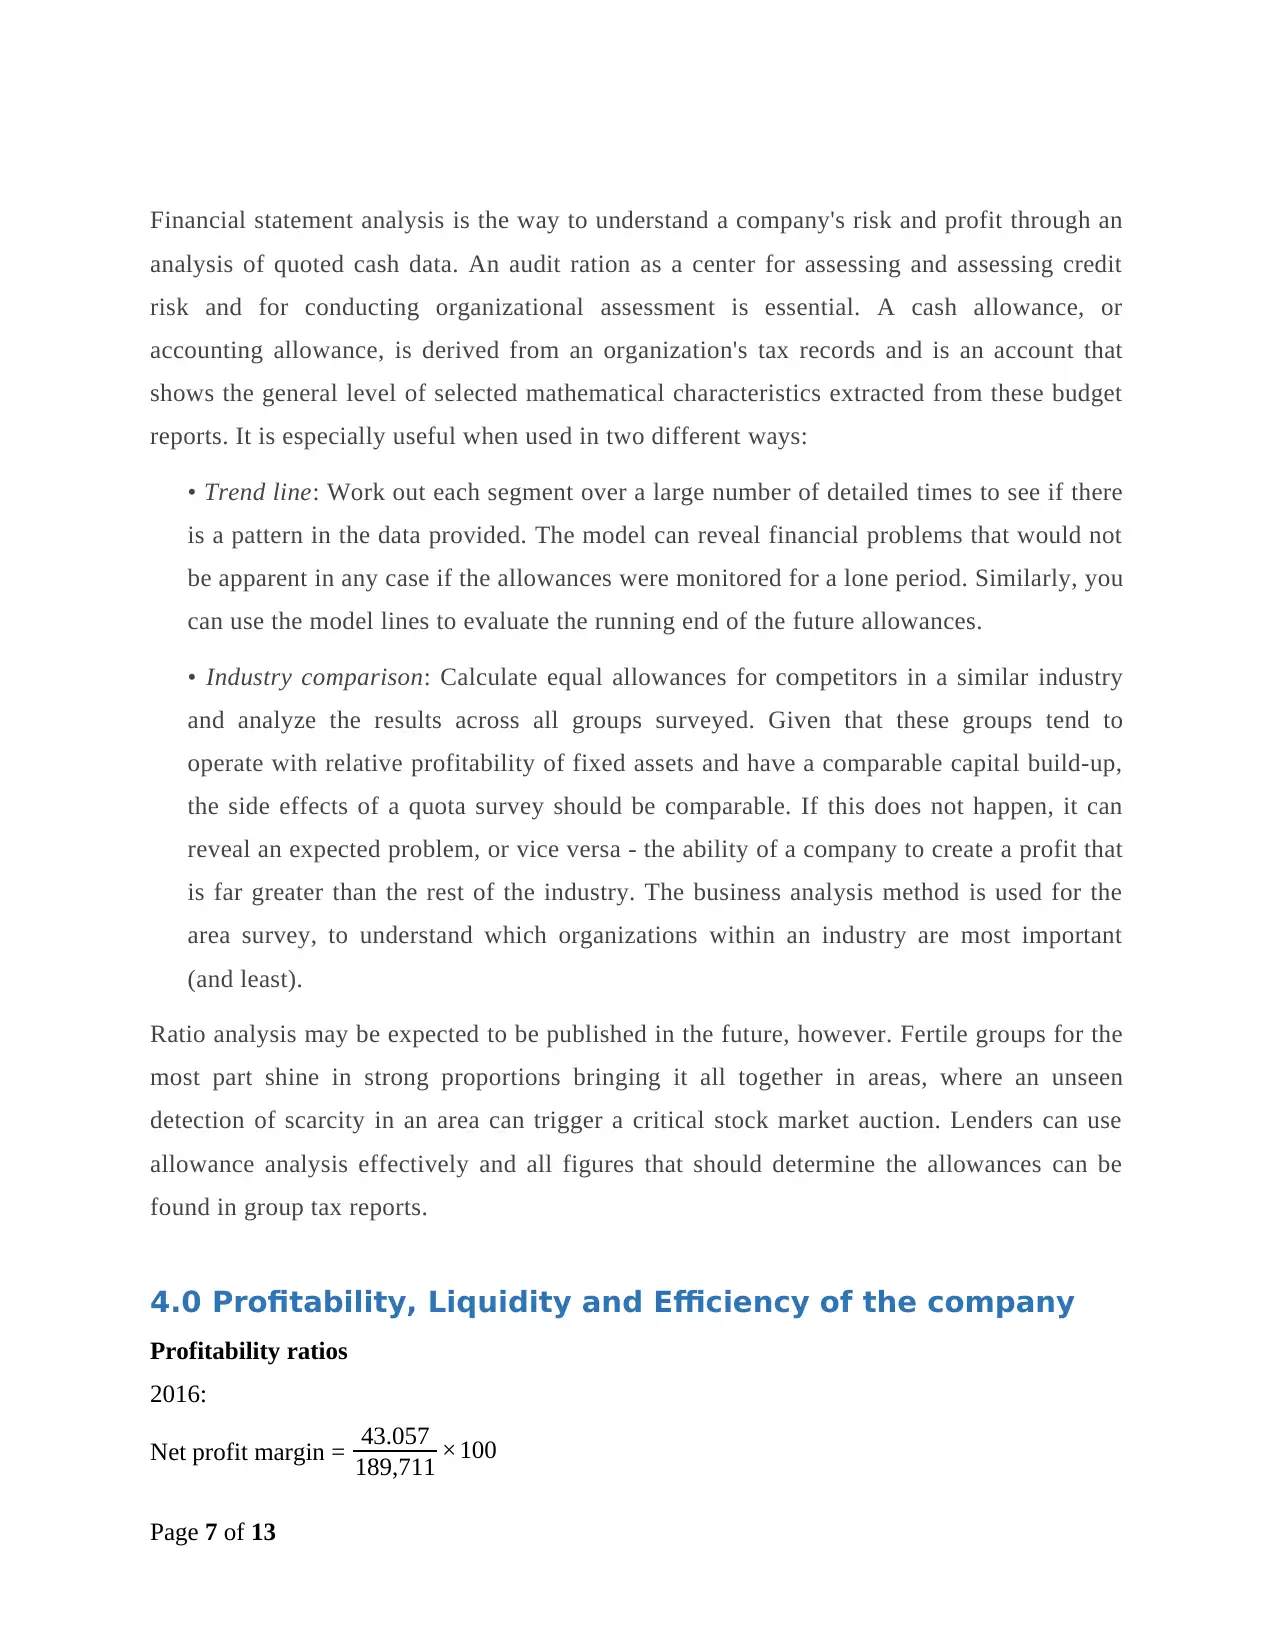
4.0 Profitability, Liquidity and Efficiency of the company
Profitability ratios
2016:
Net profit margin = 43.057
189,711 ×100
Page 7 of 13
analysis of quoted cash data. An audit ration as a center for assessing and assessing credit
risk and for conducting organizational assessment is essential. A cash allowance, or
accounting allowance, is derived from an organization's tax records and is an account that
shows the general level of selected mathematical characteristics extracted from these budget
reports. It is especially useful when used in two different ways:
• Trend line: Work out each segment over a large number of detailed times to see if there
is a pattern in the data provided. The model can reveal financial problems that would not
be apparent in any case if the allowances were monitored for a lone period. Similarly, you
can use the model lines to evaluate the running end of the future allowances.
• Industry comparison: Calculate equal allowances for competitors in a similar industry
and analyze the results across all groups surveyed. Given that these groups tend to
operate with relative profitability of fixed assets and have a comparable capital build-up,
the side effects of a quota survey should be comparable. If this does not happen, it can
reveal an expected problem, or vice versa - the ability of a company to create a profit that
is far greater than the rest of the industry. The business analysis method is used for the
area survey, to understand which organizations within an industry are most important
(and least).
Ratio analysis may be expected to be published in the future, however. Fertile groups for the
most part shine in strong proportions bringing it all together in areas, where an unseen
detection of scarcity in an area can trigger a critical stock market auction. Lenders can use
allowance analysis effectively and all figures that should determine the allowances can be
found in group tax reports.
4.0 Profitability, Liquidity and Efficiency of the company
Profitability ratios
2016:
Net profit margin = 43.057
189,711 ×100
Page 7 of 13
Paraphrase This Document
Need a fresh take? Get an instant paraphrase of this document with our AI Paraphraser
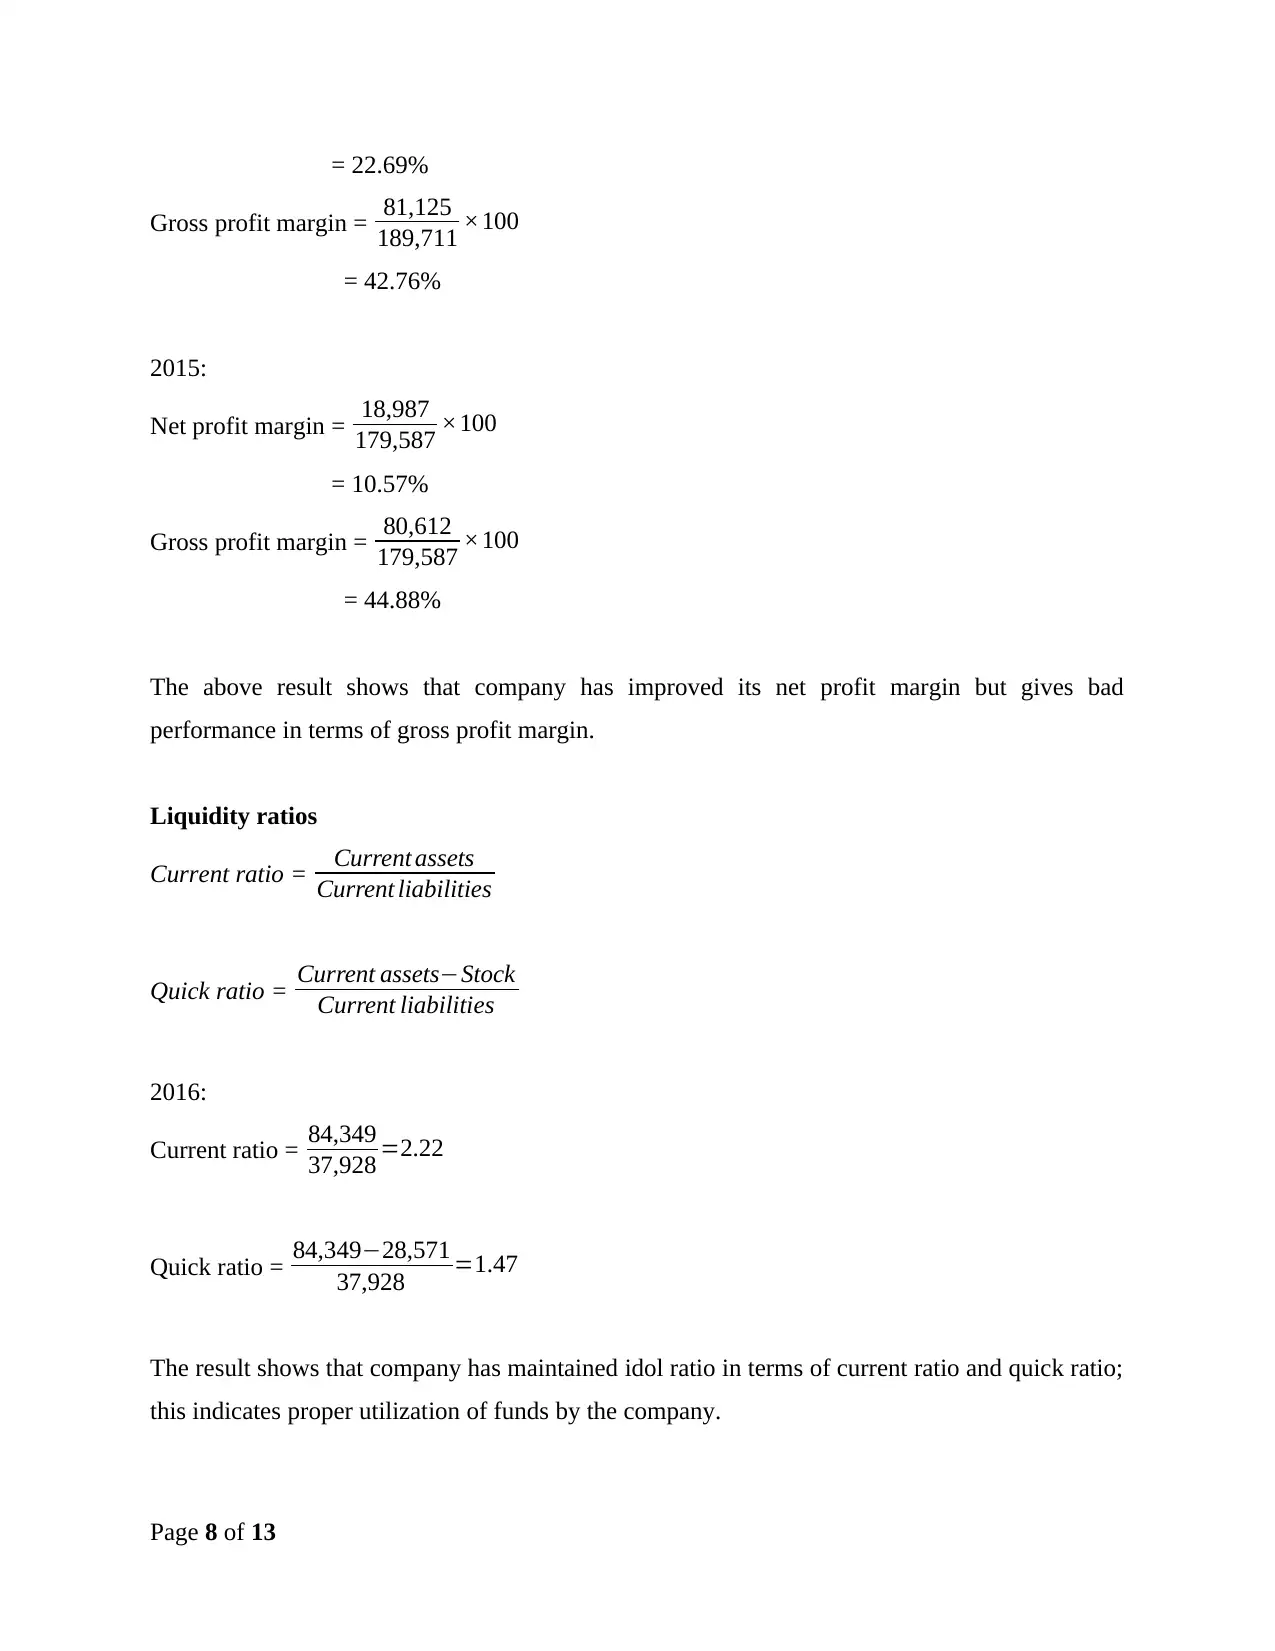
= 22.69%
Gross profit margin = 81,125
189,711 ×100
= 42.76%
2015:
Net profit margin = 18,987
179,587 ×100
= 10.57%
Gross profit margin = 80,612
179,587 ×100
= 44.88%
The above result shows that company has improved its net profit margin but gives bad
performance in terms of gross profit margin.
Liquidity ratios
Current ratio = Current assets
Current liabilities
Quick ratio = Current assets−Stock
Current liabilities
2016:
Current ratio = 84,349
37,928 =2.22
Quick ratio = 84,349−28,571
37,928 =1.47
The result shows that company has maintained idol ratio in terms of current ratio and quick ratio;
this indicates proper utilization of funds by the company.
Page 8 of 13
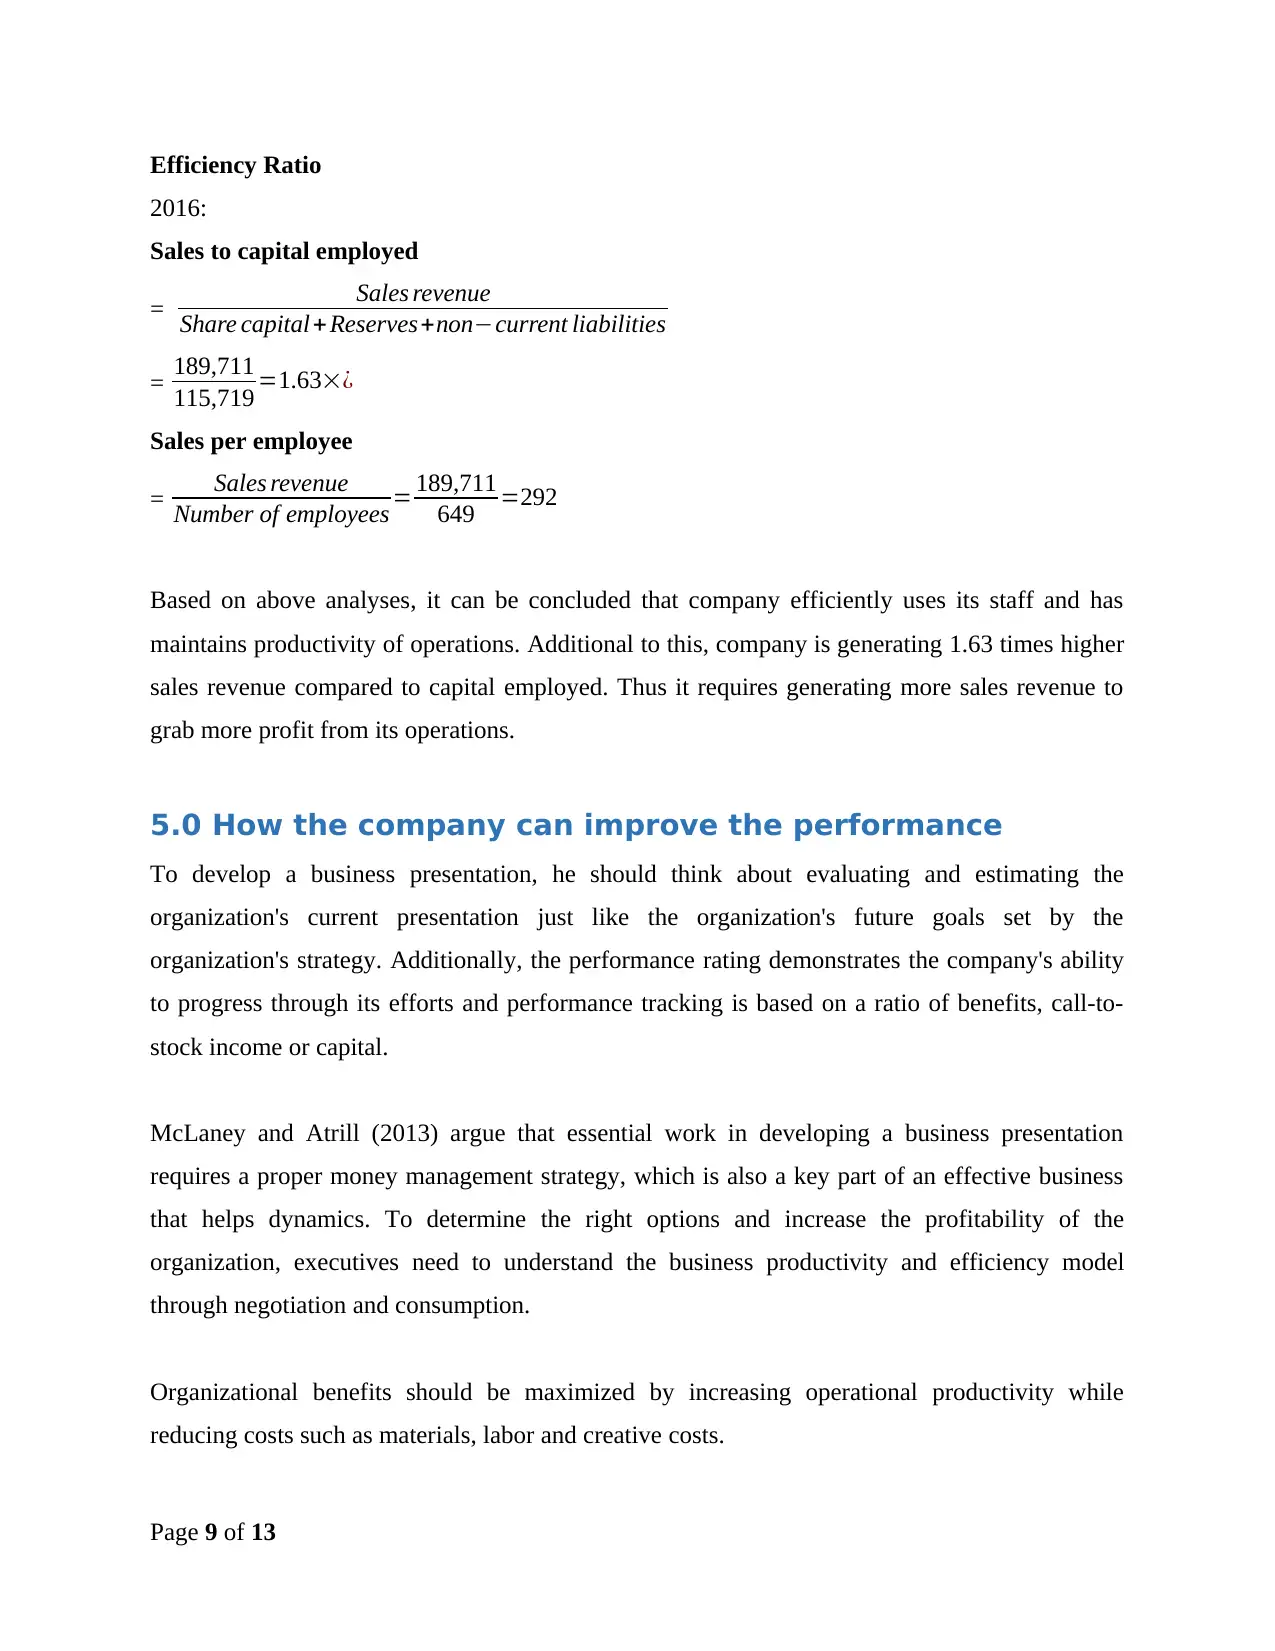
Efficiency Ratio
2016:
Sales to capital employed
= Sales revenue
Share capital +Reserves+non−current liabilities
= 189,711
115,719 =1.63׿
Sales per employee
= Sales revenue
Number of employees = 189,711
649 =292
Based on above analyses, it can be concluded that company efficiently uses its staff and has
maintains productivity of operations. Additional to this, company is generating 1.63 times higher
sales revenue compared to capital employed. Thus it requires generating more sales revenue to
grab more profit from its operations.
5.0 How the company can improve the performance
To develop a business presentation, he should think about evaluating and estimating the
organization's current presentation just like the organization's future goals set by the
organization's strategy. Additionally, the performance rating demonstrates the company's ability
to progress through its efforts and performance tracking is based on a ratio of benefits, call-to-
stock income or capital.
McLaney and Atrill (2013) argue that essential work in developing a business presentation
requires a proper money management strategy, which is also a key part of an effective business
that helps dynamics. To determine the right options and increase the profitability of the
organization, executives need to understand the business productivity and efficiency model
through negotiation and consumption.
Organizational benefits should be maximized by increasing operational productivity while
reducing costs such as materials, labor and creative costs.
Page 9 of 13
⊘ This is a preview!⊘
Do you want full access?
Subscribe today to unlock all pages.
Trusted by 1+ million students worldwide

6.0 Conclusion
Based on above analysis, it can be concluded that; financial management is an essential part of
every company’s accounting report. It helps an organization to measure its performance within
industry or past year perspectives.
Page 10 of 13
Based on above analysis, it can be concluded that; financial management is an essential part of
every company’s accounting report. It helps an organization to measure its performance within
industry or past year perspectives.
Page 10 of 13
Paraphrase This Document
Need a fresh take? Get an instant paraphrase of this document with our AI Paraphraser
7.0 References
Atrill, P. and McLaney, E., 2013. Financial accounting for decision makers. Pearson Higher Ed.
Jain, P.K., Singh, S. and Yadav, S.S., 2013. Financial management practices. In An empirical
study of Indian corporates (Vol. 3, pp. 265-278). Springer New Delhi.
Hunjra, A.I., Butt, B.Z. and Rehman, K.U., 2010. Financial management practices and their
impact on organizational performance. World Applied Sciences Journal, 9(9), pp.997-1002.
Fraser, L.M., Ormiston, A. and Fraser, L.M., 2016. Understanding financial statements. Boston:
Pearson.
Higgins, R.C. and Reimers, M., 1995. Analysis for financial management (No. s 53). Chicago:
Irwin.
Peterson, P.P. and Fabozzi, F.J., 1999. Analysis of financial statements (Vol. 54). John Wiley &
Sons.
Lessambo, F.I., 2018. Financial Statements. Analysis and Reporting.
Palepu, K.G., Healy, P.M., Wright, S., Bradbury, M. and Coulton, J., 2020. Business analysis
and valuation: Using financial statements. Cengage AU.
Page 11 of 13
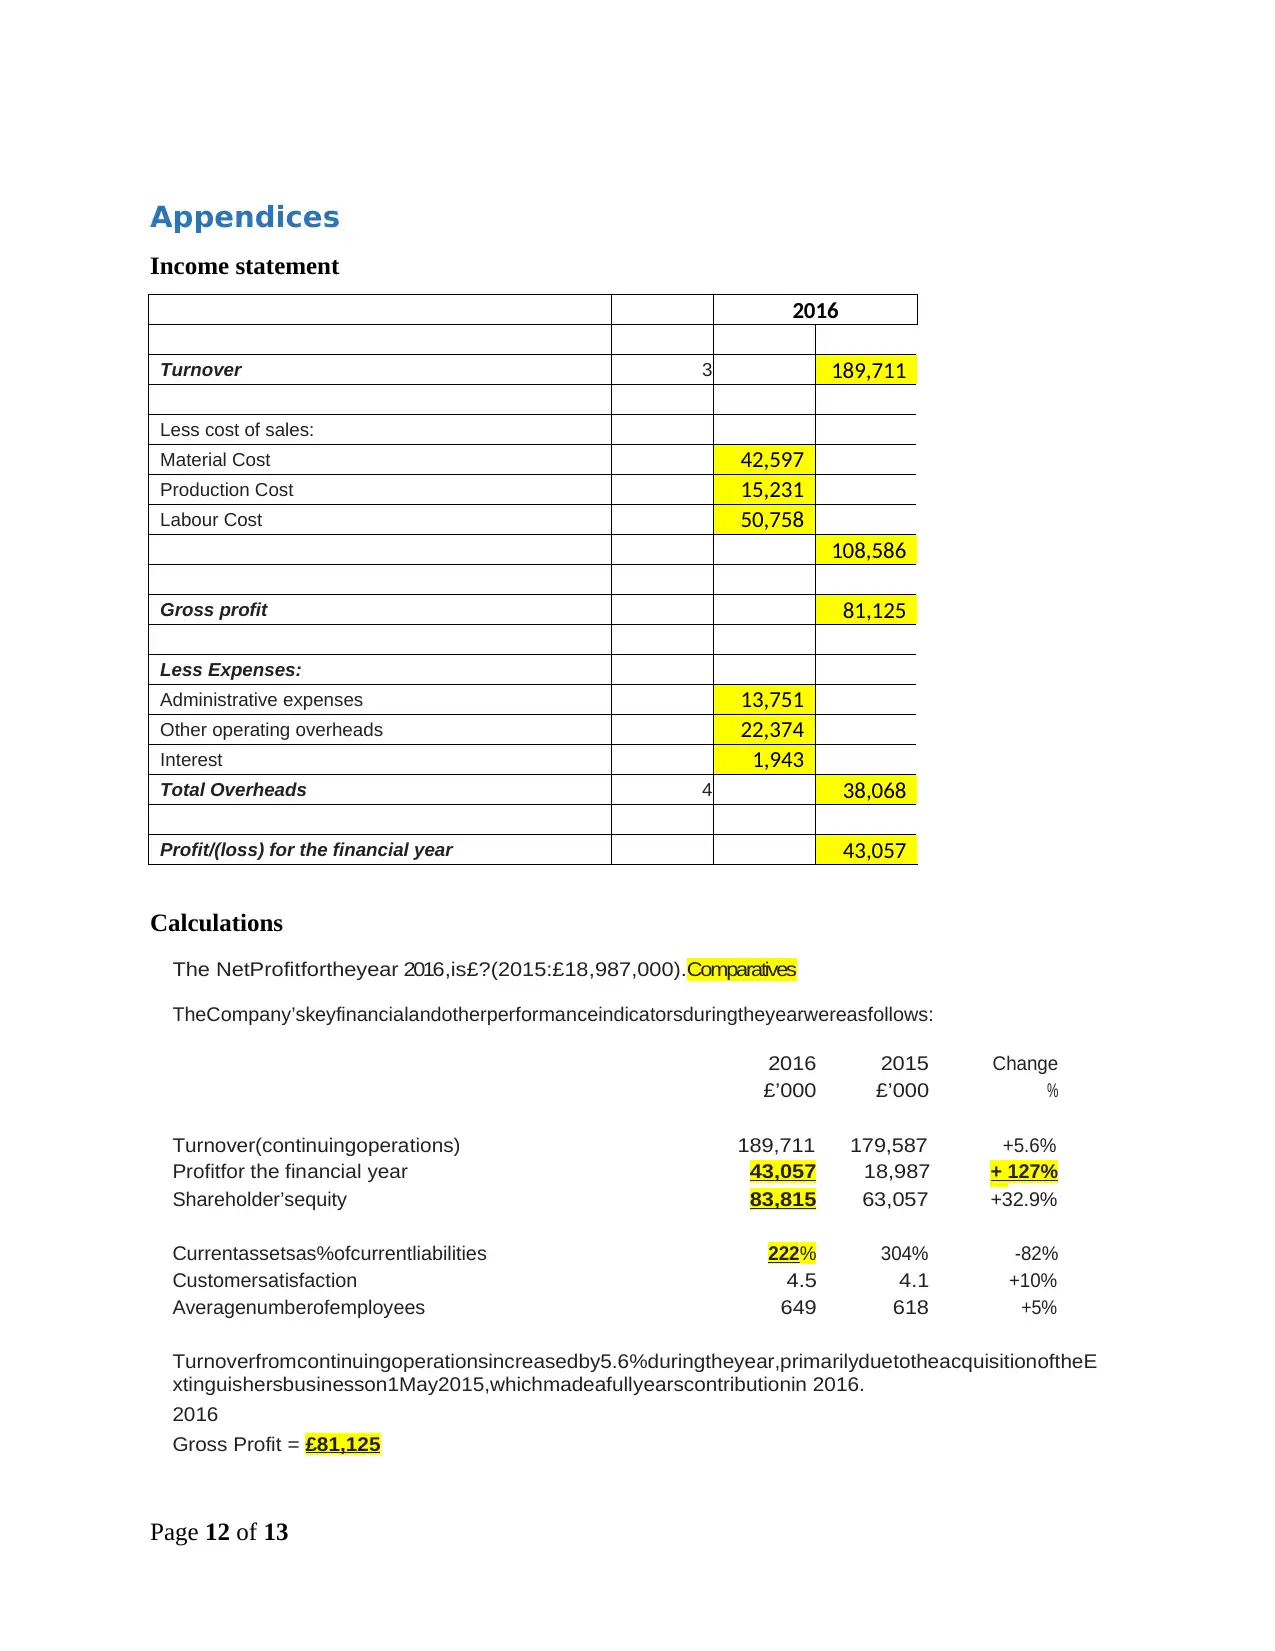
Appendices
Income statement
2016
Turnover 3 189,711
Less cost of sales:
Material Cost 42,597
Production Cost 15,231
Labour Cost 50,758
108,586
Gross profit 81,125
Less Expenses:
Administrative expenses 13,751
Other operating overheads 22,374
Interest 1,943
Total Overheads 4 38,068
Profit/(loss) for the financial year 43,057
Calculations
The NetProfitfortheyear 2016,is£?(2015:£18,987,000).Comparatives
TheCompany’skeyfinancialandotherperformanceindicatorsduringtheyearwereasfollows:
2016
£’000
2015
£’000
Change
%
Turnover(continuingoperations) 189,711 179,587 +5.6%
Profitfor the financial year 43,057 18,987 + 127%
%Shareholder’sequity 83,815 63,057 +32.9%
Currentassetsas%ofcurrentliabilities 222% 304% -82%
Customersatisfaction 4.5 4.1 +10%
Averagenumberofemployees 649 618 +5%
Turnoverfromcontinuingoperationsincreasedby5.6%duringtheyear,primarilyduetotheacquisitionoftheE
xtinguishersbusinesson1May2015,whichmadeafullyearscontributionin 2016.
2016
Gross Profit = £81,125
Page 12 of 13
⊘ This is a preview!⊘
Do you want full access?
Subscribe today to unlock all pages.
Trusted by 1+ million students worldwide
1 out of 13
Related Documents


Your All-in-One AI-Powered Toolkit for Academic Success.
+13062052269
info@desklib.com
Available 24*7 on WhatsApp / Email
![[object Object]](/_next/static/media/star-bottom.7253800d.svg)
Unlock your academic potential
Copyright © 2020–2026 A2Z Services. All Rights Reserved. Developed and managed by ZUCOL.