Financial Analysis Report: Farsons and Heiniken Performance

Verified

Added on  2023/01/18

|24
|3731
|81
Report
AI Summary
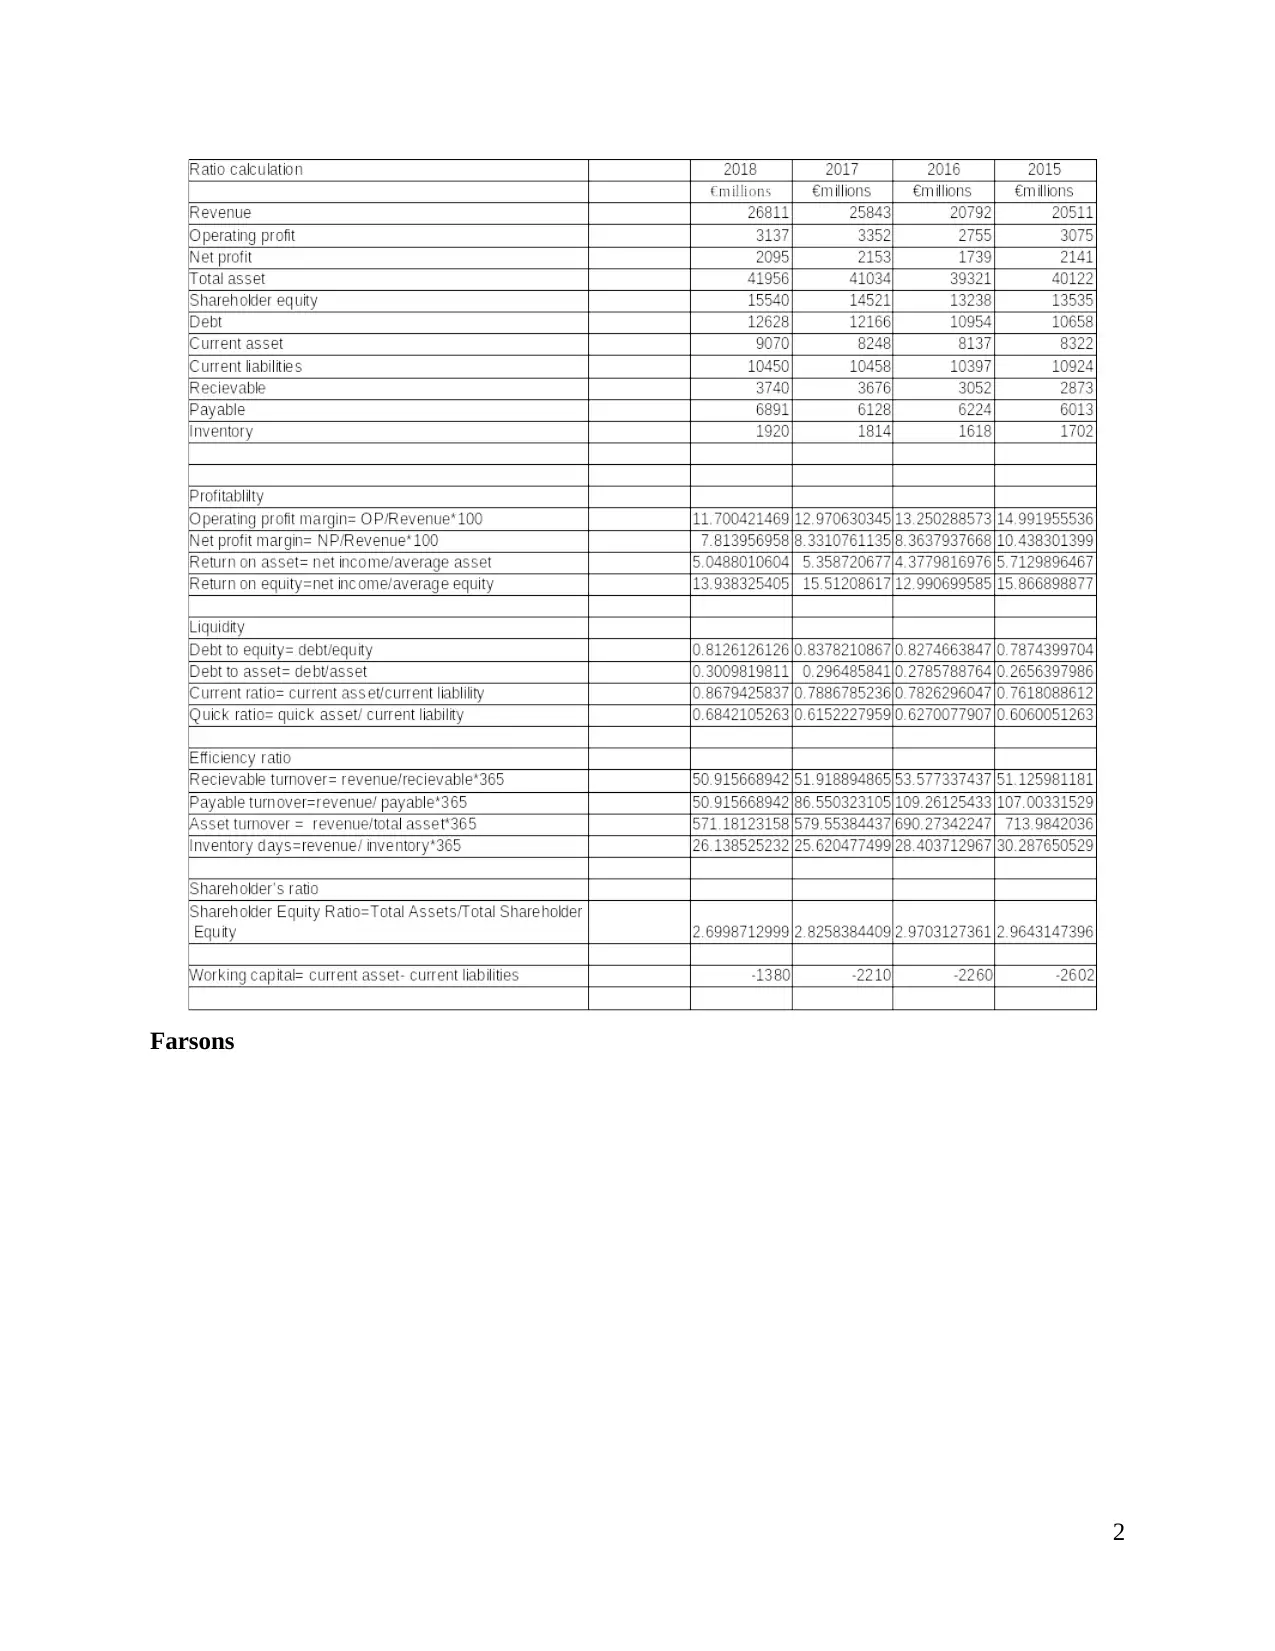
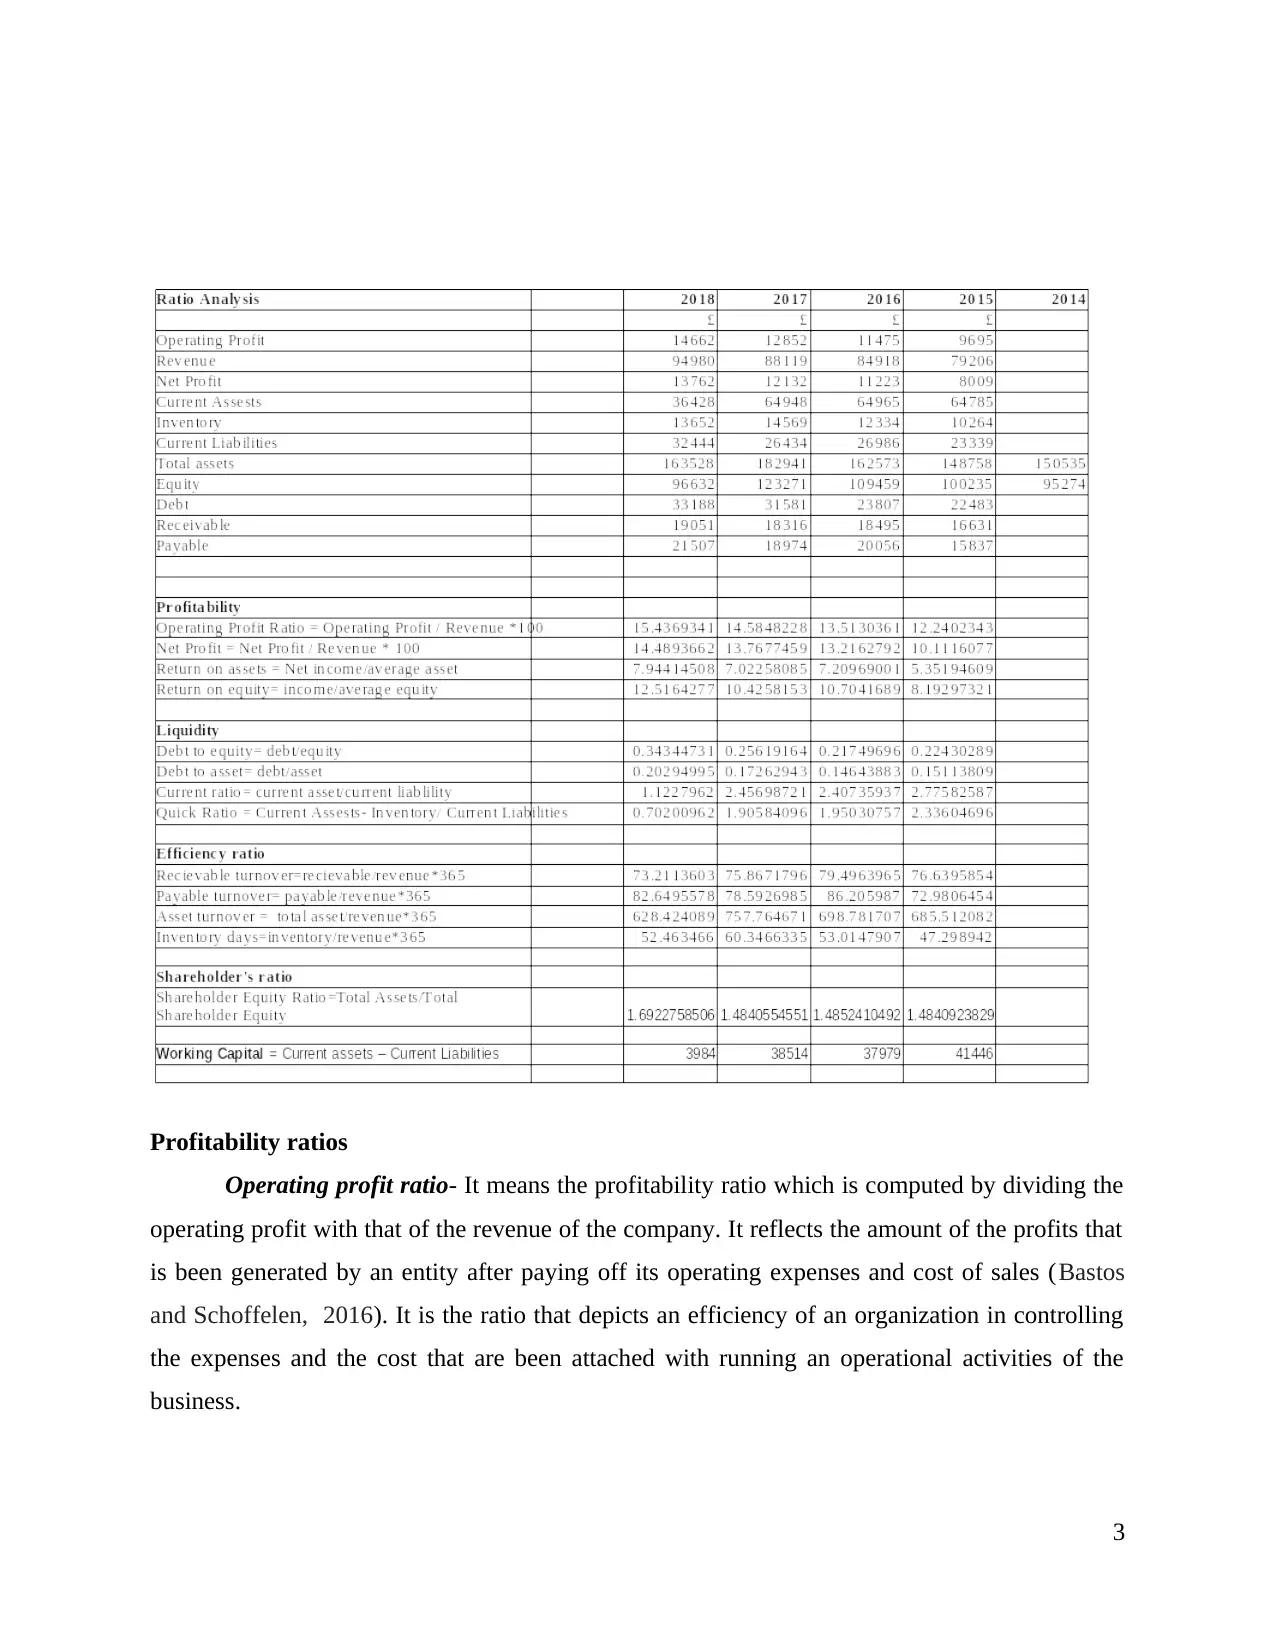
This report provides a comprehensive financial analysis comparing Farsons and Heiniken, two companies in the beverage industry. The analysis employs various financial techniques including ratio analysis (profitability, liquidity, leverage, and turnover ratios), horizontal and vertical analysis, to assess the companies' financial performance and position over a specific period. The report delves into the significance of working capital and cash flow statements for both companies, highlighting their impact on decision-making. The analysis offers insights into each company's strengths and weaknesses, providing a comparative view of their financial health and operational efficiency. The report evaluates key financial metrics such as operating profit ratio, net profit ratio, ROA, ROE, current ratio, quick ratio, debt-to-equity ratio, and asset turnover, among others. The findings offer valuable insights into the companies' ability to manage assets, meet obligations, and generate returns for shareholders. The report's conclusion summarizes the key findings and offers perspectives on the overall financial performance of Farsons and Heiniken.
Document Page
Financial Analysis Management
& Enterprise
tabler-icon-diamond-filled.svg

Paraphrase This Document

Need a fresh take? Get an instant paraphrase of this document with our AI Paraphraser
Document Page
TABLE OF CONTENTS
INTRODUCTION...........................................................................................................................1
1. Explaining detailed analysis of the final reports by employing different techniques.............1
2. Outlining an importance of assessing working capital prior in making the decision...........19
3. Critically analysing cash flow statement of the companies in past two years .....................20
CONCLUSION..............................................................................................................................21
REFERENCES..............................................................................................................................22
Document Page
INTRODUCTION
Financial analysis refers to the practice of evaluating the businesses, budgets, projects
and the other business transactions regarding finance for the purpose of determining the
suitability and the performance. Financial analysis is been used for assessing that an enterprise is
liquid, solvent, profitable, efficient and stable enough in warranting the monetary investment.
The present report focuses on Farsons that his engaged in production, brewing, distribution and
the sale of the branded beverages and the beers. Heiniken is seen as the number one as the
brewer in the Europe and stands as number two across the world. Furthermore, the report
includes ratio analysis, horizontal and vertical analysis of the both the companies financial
statements in order to facilitate comparison of the performance and position of the firms.
Moreover, the study highlights significance of the working capital and the cash flow analysis of
Farsons and Heiniken.
1. Explaining detailed analysis of the final reports by employing different techniques
Heiniken
Farsons
1
Document Page
Farsons
2
tabler-icon-diamond-filled.svg

Paraphrase This Document

Need a fresh take? Get an instant paraphrase of this document with our AI Paraphraser
Document Page
Profitability ratios
Operating profit ratio- It means the profitability ratio which is computed by dividing the
operating profit with that of the revenue of the company. It reflects the amount of the profits that
is been generated by an entity after paying off its operating expenses and cost of sales (Bastos
and Schoffelen, 2016). It is the ratio that depicts an efficiency of an organization in controlling
the expenses and the cost that are been attached with running an operational activities of the
business.
3
Document Page
Interpretation- From the above evaluation it has been interpreted that the ratio of Farsons
is showing a better results as compared to Heiniken. A higher ratio of the operating margin tends
to be favourable than the lower ratio as it clearly shows that an enterprise is been making
sufficient amount of the money from their ongoing operations for fixed and the variable cost. As
operating margin of Farsons over the years is indicating a rising trend because its profits and
revenue is increasing so this shows that firm is performing better from one accounting period to
another but the percentage ratio of Heiniken is declining which shows its poor performance from
the previous years.
Net profit ratio- This ratio indicates the amount of the profits gained as the percentage of
the revenue. It is calculated by dividing the net profit by revenue which depicts the profit earned
by the company after making payment of tax obligation, costs and expenses (Aktas, Croci and
Petmezas, 2015). It means the percentage value of the sales that is been left after paying off all
the expenses that are deducted from sales. It is counted as an indicator of an entity's profitability
and depicts the proportion of the revenue which is translated into the net profit.
Interpretation- The results generated shows that the profit margin ratio of Heiniken is
reflecting a decreasing trend over the years which clearly depicts bad performance of the
company. On the other hand, the NP ratio of Farosns is seen as better than Heiniken as it
increasing with passage of one financial year to another (Ramiah and et.al., 2016). This shows
that Heiniken needs to take corrective measure in order to improve its NP margin as it should
reduce utilities, insurance premium, labour cost, operation cost and must focus on increasing the
sales revenue.
ROA- It is the ratio that tells about profits that is been earned by the company in relation
to its total assets. It gives an idea to the analyst, manager and an investor is efficiently managing
an enterprise by making the use of tits assets for the purpose of generating more and more
returns. It is computed by dividing the profits with total assets of the firm (Baker and et.al.,
2017). This ratio is used for comparing the similar companies with that of their previous
performance. It takes into account the debt of the company and the other related metrics like
ROE.
Interpretation- Positive value of the ROA indicates upwards trend of the profits,
however, negative or low ratio reflects ineffective use of the company's assets with respect to
generating larger returns. The ROA of Heiniken is seen as stable in the past 4 years which clearly
4
Document Page
depicts that it is not making an efficient use of its assets for the purpose of generating profits.
However, ROA of Farsons is increasing during the past four years and resulting higher ratio than
its competitors Heiniken that in turn means that it is making an effective use of the assets so that
he higher profitability could be attained.
ROE- It is also one of the major profitability measure of the business relating to an equity
and is accounted by dividing the net income to that of the shareholders funds (Afrifa and
Tingbani, 2018). It is counted as the measure that reflects the way in which company makes use
of an investment for generating growth in its earnings.
Interpretation- Higher ROE considered to be better than the lower ratios so as seen in the
results generated return on equity of Farsons within the 4 years has been increased which means
that the company is generating increased profits by using the money received from its
shareholders in order to achieve growing success in the long run. However, the ROE of Heiniken
is declining as the year passes which incubates that company does not performs well in gaining
returns from the investment made by their shareholders.
Liquidity ratios
Current ratio- It is the financial ratio which shows proportion of an enterprise current
assets over its current obligations. It is the ratio that is classified in terms of the liquidity ratio
and larger value of the current ratio is seen as better than lower value (Biswas and et.al., 2015).
The liquidity of an entity highly depends on converting the assets into the cash with an objective
of making payment for fulfilling an obligation.
Interpretation-An ideal current ratio is said to be 2:1 and higher the ratio seems to show a
better liquidity position of the company. The current ratio of Heiniken and Farsons is increasing
which means that both the firms are capable of the meeting their short term obligations
effectively and efficiently. Moreover, it has been reflected that liquidity position of Farsons is
better than Heiniken because it had attained an ideal ratio and the higher results in comparison to
its rivalry which in turn depicts an ideal liquidity position of the firm as compared to its
competitors.
Quick ratio- It is been defined as the acid-test ratio which reveals an ability of the
company in meeting its current obligation by making use of the immediate assets or the most
liquid assets (Farrés and et.al., 2015). It is been computed by dividing the quick assets with the
5
tabler-icon-diamond-filled.svg

Paraphrase This Document

Need a fresh take? Get an instant paraphrase of this document with our AI Paraphraser
Document Page
current liabilities where the quick assets are been attained as deducting an inventory from the
current assets.
Interpretation- From the analysis, it has been highlighted that the quick ratio of Farsons
is increasing over the years and equates to 1 which means that company is having sufficient cash
for paying its current obligations. However, the QR of Heiniken is also incraesing but is lower
than Farsons which states that it is also having adequate cash but resulted a poor liquid position
in comparison to its rivalry.
Leverage ratios
D/E ratio- It shows the percentage of financing made by an entity from an investors and
the creditors. It is been computed by dividing the total liabilities with that of the shareholders
funds.
Interpretation- This ratio is been utilized for evaluating the leverage position of the
company and is counted as an essential metric that is used in the corporate finance. High value of
the ratio indicates the firm or the stock with higher risk towards the shareholders. The analysis
shows that the ratio of the two companies is showing an increasing trend and the ratio of
Heiniken is greater than Farson which means that leverage position of Farson is better than its
competitor as lower ratio is better.
Debt- to- asset ratio- It is the leverage ratio which measures an amount of the total assets
that is been financed by creditors rather than investors (Filbeck, Zhao and Knoll, 2017). It
shows the percentage of the assets that are been financed by the borrowing in comparison with
percentage of the resources funded by an investors.
Interpretation- Ratio that is equated to 1 states that a company is owing the same amount
of the liabilities as their assets and is seen as highly leveraged. Both the firms are resulting a ratio
that is lower than one which means that both are conducting its business with better leverage
position as it depicts the liabilities are lower than its assets.
Turnover ratios
Accounts receivable days- It is considered as an efficiency or activity ratio which
measures for the number of the times a business could turn their accounts receivables into the
cash during a particular period.
Interpretation- High ratio of receivable turnover indicates that the collection process of
the company in terms of the accounts receivable is seen as efficient and it has high proportion of
6
Document Page
the quality customers who pays their dent obligation on quick basis. As the ratio of Farsons is
higher than Heiniken which means that former company is more efficient than Heiniken and its
collection process is much better than its rivalry.
Accounts payable days- It means an efficiency ratio which measures an average number
of the days that the company takes in paying off to its suppliers.
Interpretation- In case the number of the days gets increases from one accounting period
to the another period which indicates that company is making the payment to its suppliers on
slow basis and might be an indicator of worsening the financial condition. As the ratio of Farsons
is increasing which means it is paying to its suppliers on slower basis while the ratio of Heiniken
is decreasing which depicts that it is making timely payment to the suppliers.
Asset turnover- It tells about an entity's ability in generating higher revenues by making
use of the company's assets (Mathuva, 2015). It is an efficiency ratio that indicates the use of
assets made by the firm for the producing sales.
Interpretation- The high ratio seems to be favourable and reflects an efficient use of the
assets. Lower value of the ratio indicates that the assets are not been used effectively. As per the
results ascertained, it is observed that Heiniken is making an efficient and optimum use of its
assets as its ratio resulted as greater than Farsons over the 4 years of analysis made.
Inventory turnover ratio- It acts as the crucial efficiency ratio that measures the way in
which an inventory of the company is effectively been managed by making comparison of the
COGS with respect to its average inventory for the particular period.
Interpretation- High ratio states that an inventory is getting converted into cash quickly
whereas low ratio results in maintaining the excessive level of an inventory. ITR of Farsons is
seen as higher and rising over the years as compared to Heiniken which in turn highlights that
former company is efficient comparing to latter.
Shareholders ratios
Shareholders funds ratio- It means the the amount to which the assets are been funded
by the shareholders fund of an organization.
Interpretation- Lower ratio indicated more and more debt that the company has used for
funding its assets. It shows the ratio that the shareholders would be receiving at the time winding
up of the company. The ratio of Farsons and Heiniken is declining during the last 4 years and the
7
Document Page
Former enterprise is having lower ratio than the latter company which directly indicates better
ratio of Heiniken.
Vertical analysis & Horizontal of Farsons
Interpretation-The vertical analysis of P&L account of the Farsons indicates that over the year
he the change in percentage of profitability of the company with respect to hits revenue is
increasing which depicts that the firm is performing better.
8
tabler-icon-diamond-filled.svg

Paraphrase This Document

Need a fresh take? Get an instant paraphrase of this document with our AI Paraphraser
Document Page
Interpretation- In accordance to the horizontal analysis of income statement, it has been seen
that the profits and revenue of the company is decreasing which means that as compared to past
year, in the current year the performance of the company is seen as poor.
9
Document Page
10
chevron_up_icon
1 out of 24
circle_padding
hide_on_mobile
zoom_out_icon
[object Object]