Managerial Finance Report: Financial Analysis of Tesco and Sainsburry
VerifiedAdded on 2022/12/30
|13
|3522
|24
Report
AI Summary
This report provides a detailed financial analysis of Tesco and Sainsburry, two major retail companies. It begins with an introduction to financial management and its importance for organizations. The report then delves into ratio analysis, calculating and comparing key financial ratios such as current ratio, quick ratio, gross profit ratio, P/E ratio, net profit ratio, capital gearing ratio, return on capital employed, inventory turnover, dividend payout ratio, and earnings per share for both companies for the years 2018 and 2019. The analysis highlights the strengths and weaknesses of each company based on these ratios. Furthermore, the report explores investment appraisal techniques, though details are limited in the provided text. Finally, it discusses the limitations of both ratio analysis and investment appraisal techniques. The report concludes with recommendations for the companies based on the financial analysis.

Managerial
Finance
Finance
Paraphrase This Document
Need a fresh take? Get an instant paraphrase of this document with our AI Paraphraser
Table of Contents
INTRODUCTION...........................................................................................................................3
PORTFOLIO 1.................................................................................................................................3
Ratio analysis for the company Tesco and Sainsburry:...............................................................3
Recommendations:.......................................................................................................................7
Limitations for ratio analysis in order to know financial position:..............................................8
PORTFOLIO 2.................................................................................................................................9
Investment appraisal techniques:.................................................................................................9
Limitations for investment appraisal techniques for knowing better investment options:........10
CONCLUSION..............................................................................................................................10
REFERENCES..............................................................................................................................11
INTRODUCTION
Finance is the important element for any organisation, it is about creating managing
money for the investments which helps firms for expanding business. Finance is about acquiring
funds and managing it for organisations activities. Money is essential thing for the organisations
for managing its activities. It helps firms for meeting monetary requirements which helps it to
organise its activities. Financial management is the process for managing financial activities for
the organisations. Financial management has various functions which includes planning,
organising, analysing, controlling, managing financial activities (Abor, 2016). Finance
department managing funds for the organisations activities by various sources includes debts,
equity etc. it is important for accomplish organisations objectives. The company which is
selected for this report is Tesco and Sainsburry. Tesco is the British multinational company for
general merchandise and retail based company. It was founded in 1919, headquarter situated in
UK. Sainsburry has largest chain for supermarkets for retail industry. It was established in 1869,
headquarter situated in UK. This report covers various topics which includes calculation for
ratios, analysis for ratio analysis for both companies, limitations for ratio analysis for knowing
financial position. Apart from this it also covers topics such as investment appraisal techniques,
limitations for investment appraisal techniques in order to know better investment options.
PORTFOLIO 1
Ratio analysis for the company Tesco and Sainsburry:
Ratios for Tesco:
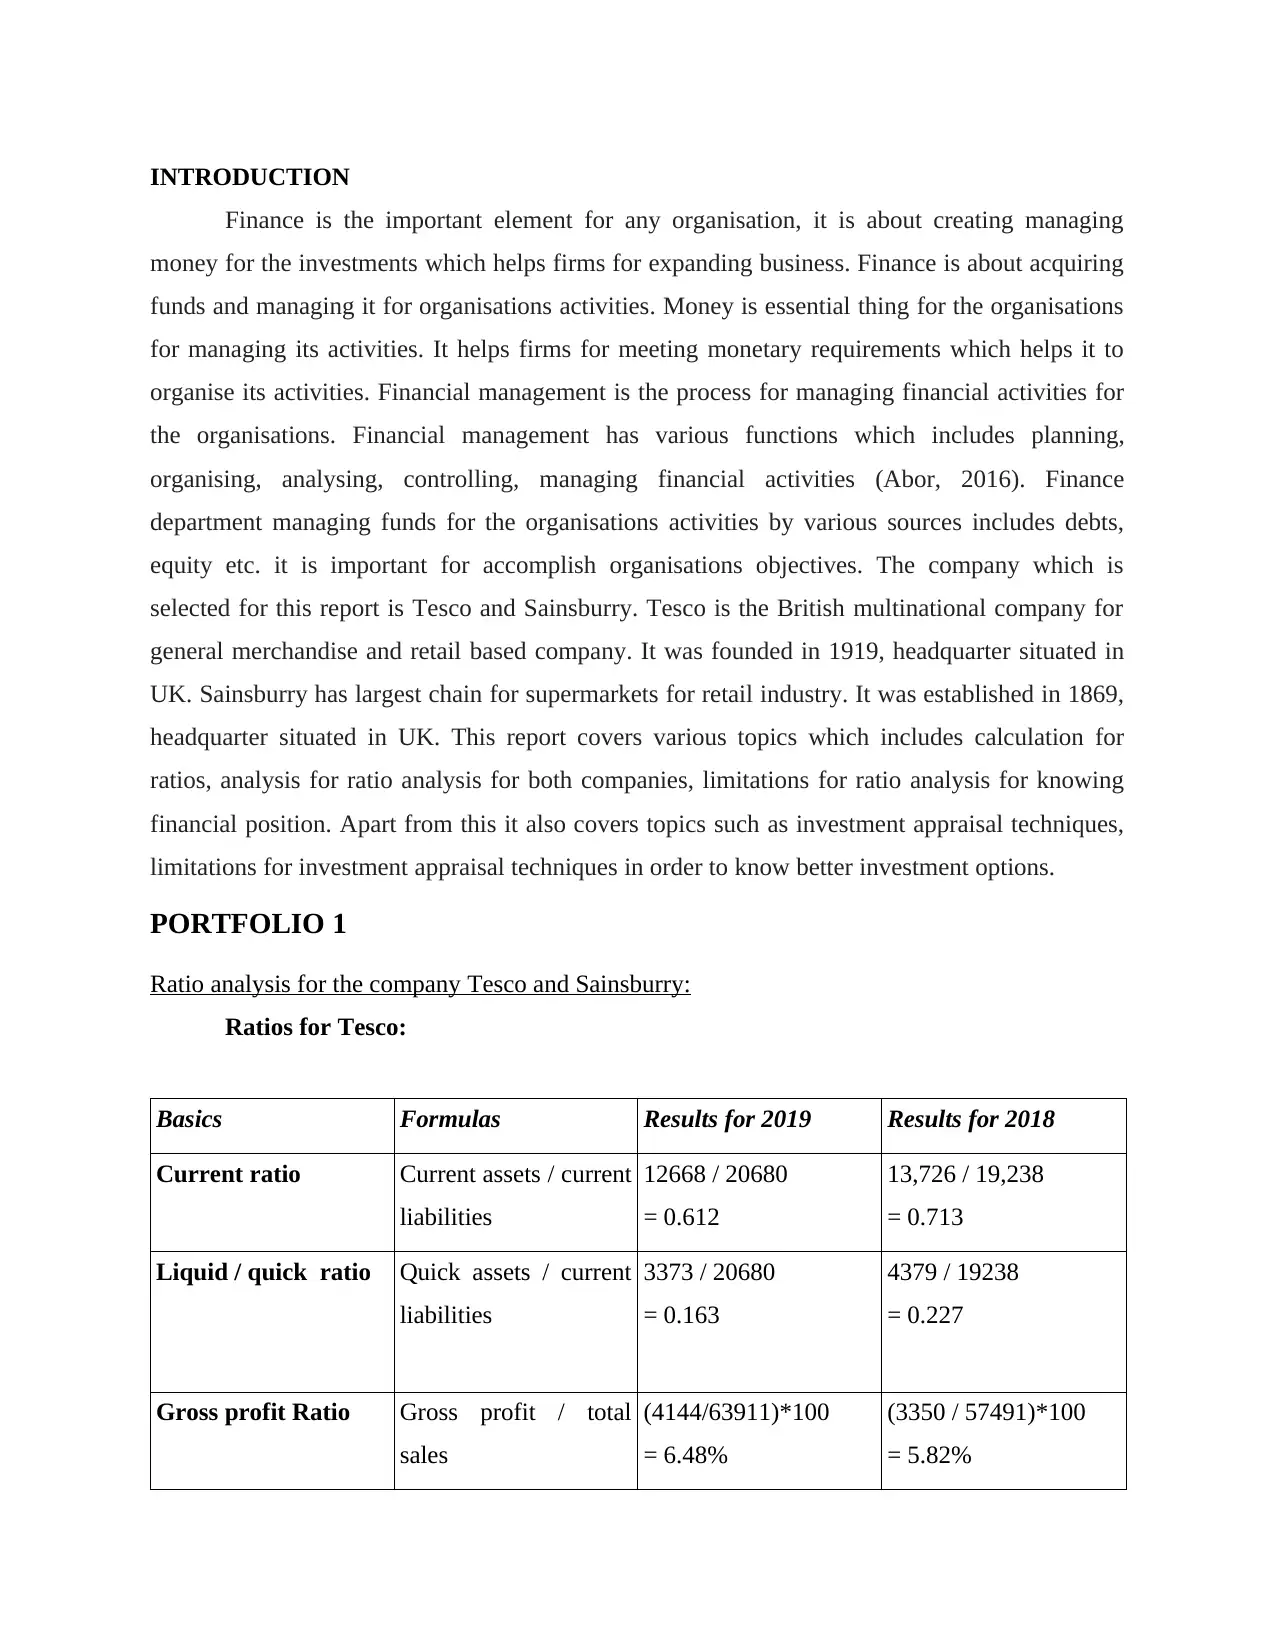
Basics Formulas Results for 2019 Results for 2018
Current ratio Current assets / current
liabilities
12668 / 20680
= 0.612
13,726 / 19,238
= 0.713
Liquid / quick ratio Quick assets / current
liabilities
3373 / 20680
= 0.163
4379 / 19238
= 0.227
Gross profit Ratio Gross profit / total
sales
(4144/63911)*100
= 6.48%
(3350 / 57491)*100
= 5.82%
Finance is the important element for any organisation, it is about creating managing
money for the investments which helps firms for expanding business. Finance is about acquiring
funds and managing it for organisations activities. Money is essential thing for the organisations
for managing its activities. It helps firms for meeting monetary requirements which helps it to
organise its activities. Financial management is the process for managing financial activities for
the organisations. Financial management has various functions which includes planning,
organising, analysing, controlling, managing financial activities (Abor, 2016). Finance
department managing funds for the organisations activities by various sources includes debts,
equity etc. it is important for accomplish organisations objectives. The company which is
selected for this report is Tesco and Sainsburry. Tesco is the British multinational company for
general merchandise and retail based company. It was founded in 1919, headquarter situated in
UK. Sainsburry has largest chain for supermarkets for retail industry. It was established in 1869,
headquarter situated in UK. This report covers various topics which includes calculation for
ratios, analysis for ratio analysis for both companies, limitations for ratio analysis for knowing
financial position. Apart from this it also covers topics such as investment appraisal techniques,
limitations for investment appraisal techniques in order to know better investment options.
PORTFOLIO 1
Ratio analysis for the company Tesco and Sainsburry:
Ratios for Tesco:
Basics Formulas Results for 2019 Results for 2018
Current ratio Current assets / current
liabilities
12668 / 20680
= 0.612
13,726 / 19,238
= 0.713
Liquid / quick ratio Quick assets / current
liabilities
3373 / 20680
= 0.163
4379 / 19238
= 0.227
Gross profit Ratio Gross profit / total
sales
(4144/63911)*100
= 6.48%
(3350 / 57491)*100
= 5.82%
⊘ This is a preview!⊘
Do you want full access?
Subscribe today to unlock all pages.
Trusted by 1+ million students worldwide
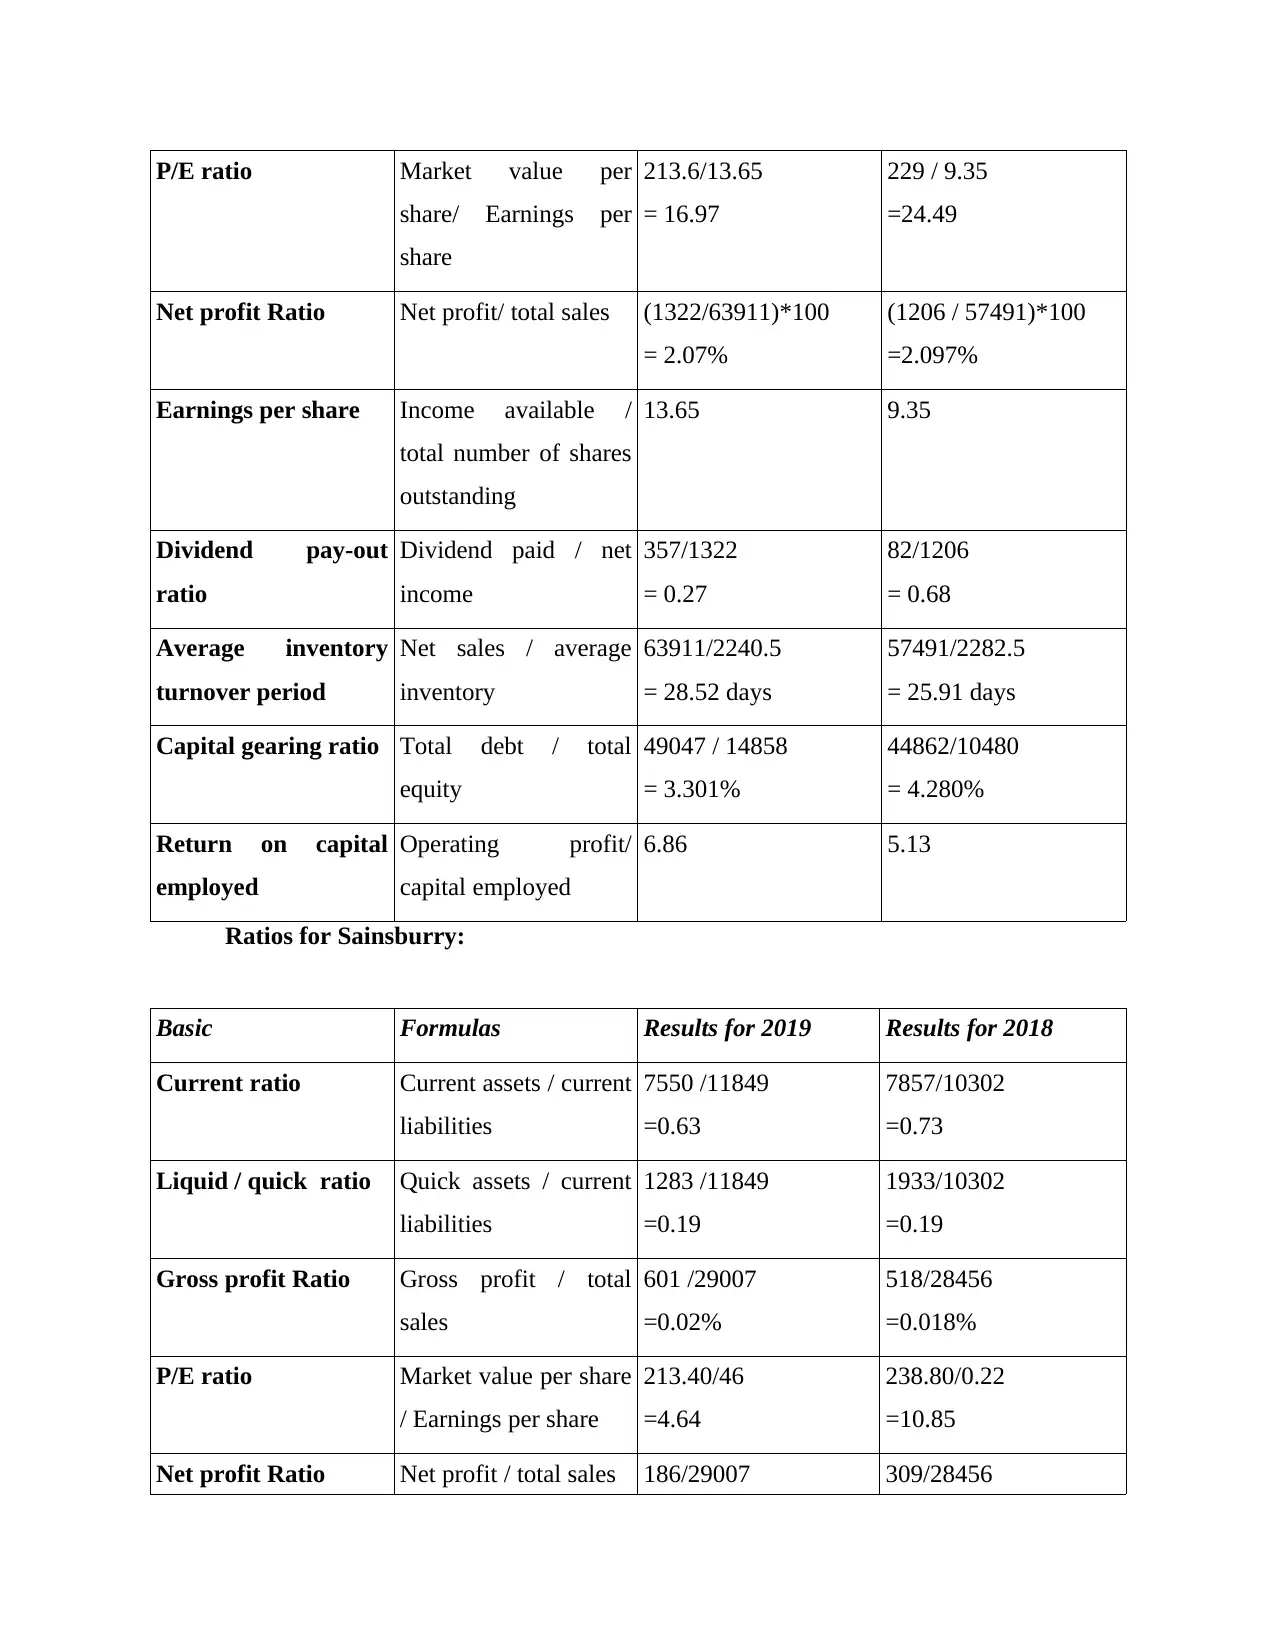
P/E ratio Market value per
share/ Earnings per
share
213.6/13.65
= 16.97
229 / 9.35
=24.49
Net profit Ratio Net profit/ total sales (1322/63911)*100
= 2.07%
(1206 / 57491)*100
=2.097%
Earnings per share Income available /
total number of shares
outstanding
13.65 9.35
Dividend pay-out
ratio
Dividend paid / net
income
357/1322
= 0.27
82/1206
= 0.68
Average inventory
turnover period
Net sales / average
inventory
63911/2240.5
= 28.52 days
57491/2282.5
= 25.91 days
Capital gearing ratio Total debt / total
equity
49047 / 14858
= 3.301%
44862/10480
= 4.280%
Return on capital
employed
Operating profit/
capital employed
6.86 5.13
Ratios for Sainsburry:
Basic Formulas Results for 2019 Results for 2018
Current ratio Current assets / current
liabilities
7550 /11849
=0.63
7857/10302
=0.73
Liquid / quick ratio Quick assets / current
liabilities
1283 /11849
=0.19
1933/10302
=0.19
Gross profit Ratio Gross profit / total
sales
601 /29007
=0.02%
518/28456
=0.018%
P/E ratio Market value per share
/ Earnings per share
213.40/46
=4.64
238.80/0.22
=10.85
Net profit Ratio Net profit / total sales 186/29007 309/28456
Paraphrase This Document
Need a fresh take? Get an instant paraphrase of this document with our AI Paraphraser
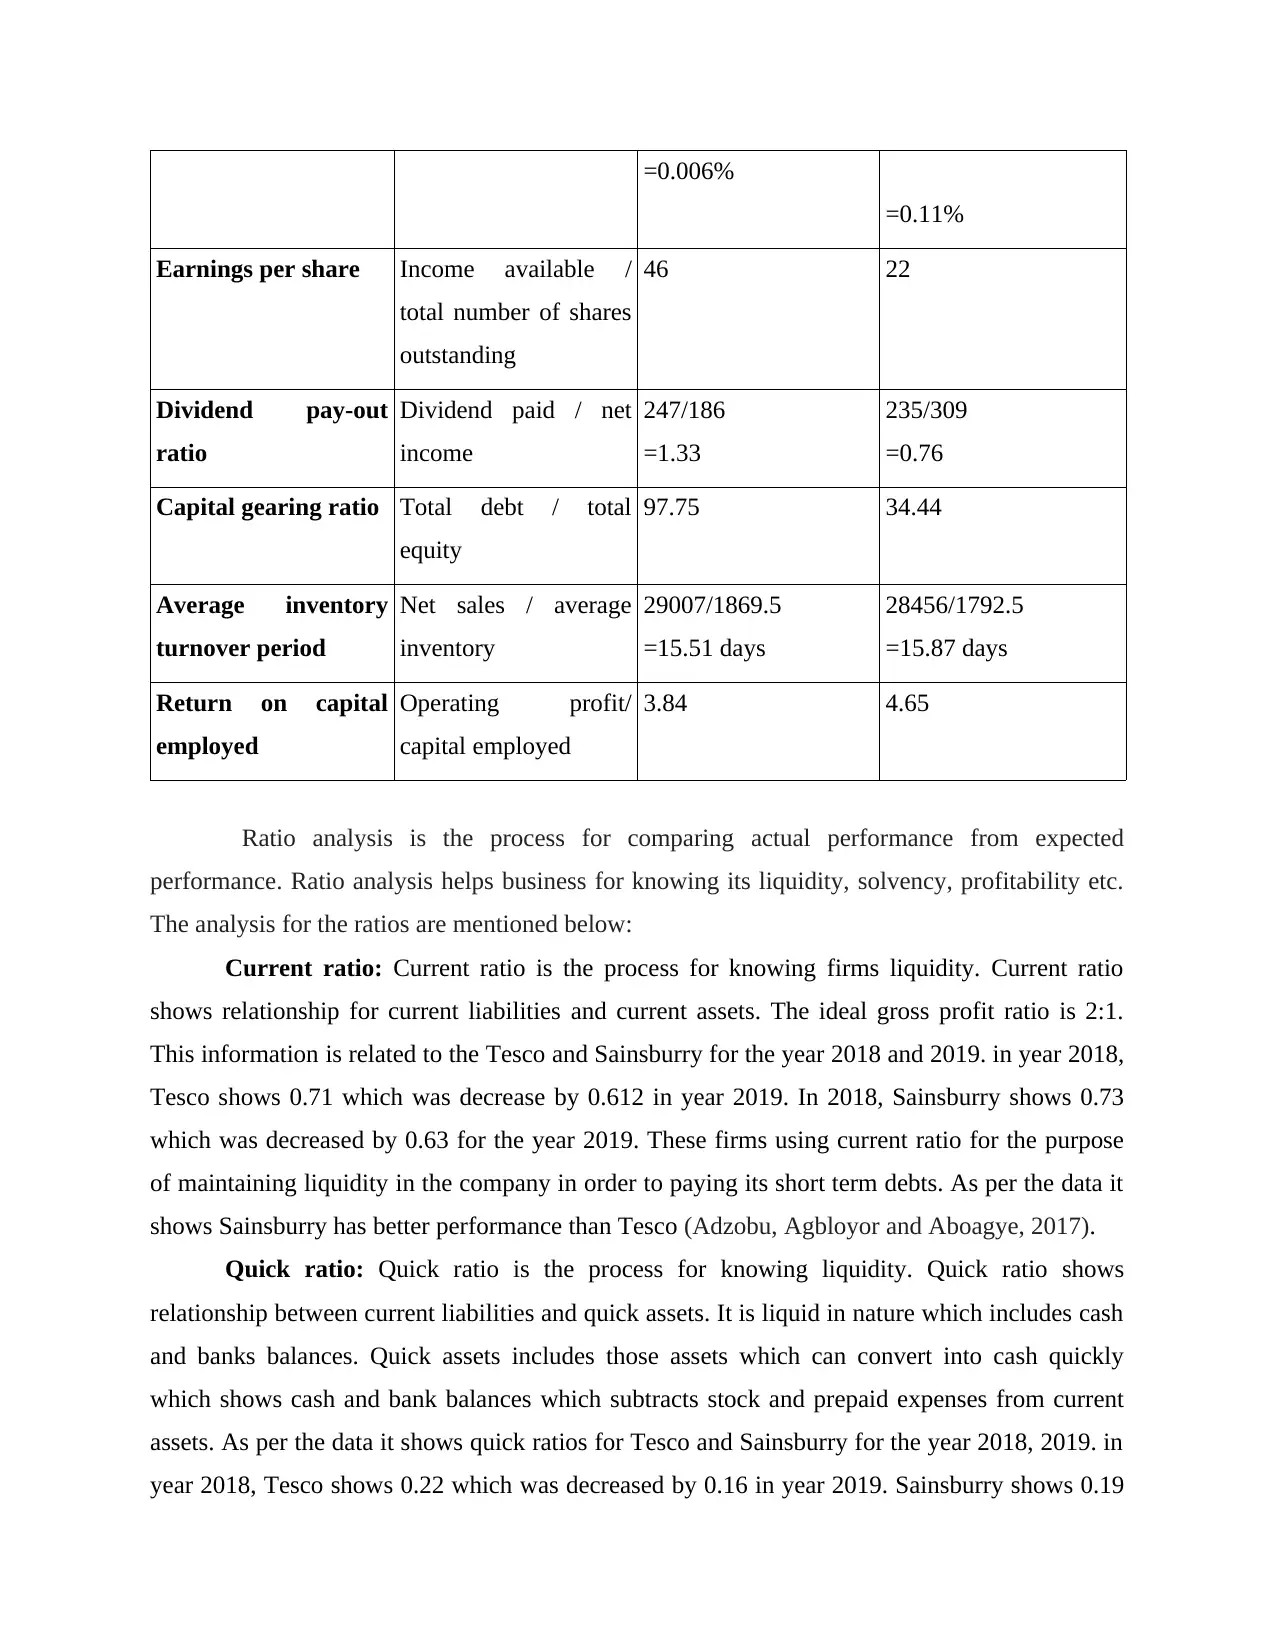
=0.006%
=0.11%
Earnings per share Income available /
total number of shares
outstanding
46 22
Dividend pay-out
ratio
Dividend paid / net
income
247/186
=1.33
235/309
=0.76
Capital gearing ratio Total debt / total
equity
97.75 34.44
Average inventory
turnover period
Net sales / average
inventory
29007/1869.5
=15.51 days
28456/1792.5
=15.87 days
Return on capital
employed
Operating profit/
capital employed
3.84 4.65
Ratio analysis is the process for comparing actual performance from expected
performance. Ratio analysis helps business for knowing its liquidity, solvency, profitability etc.
The analysis for the ratios are mentioned below:
Current ratio: Current ratio is the process for knowing firms liquidity. Current ratio
shows relationship for current liabilities and current assets. The ideal gross profit ratio is 2:1.
This information is related to the Tesco and Sainsburry for the year 2018 and 2019. in year 2018,
Tesco shows 0.71 which was decrease by 0.612 in year 2019. In 2018, Sainsburry shows 0.73
which was decreased by 0.63 for the year 2019. These firms using current ratio for the purpose
of maintaining liquidity in the company in order to paying its short term debts. As per the data it
shows Sainsburry has better performance than Tesco (Adzobu, Agbloyor and Aboagye, 2017).
Quick ratio: Quick ratio is the process for knowing liquidity. Quick ratio shows
relationship between current liabilities and quick assets. It is liquid in nature which includes cash
and banks balances. Quick assets includes those assets which can convert into cash quickly
which shows cash and bank balances which subtracts stock and prepaid expenses from current
assets. As per the data it shows quick ratios for Tesco and Sainsburry for the year 2018, 2019. in
year 2018, Tesco shows 0.22 which was decreased by 0.16 in year 2019. Sainsburry shows 0.19
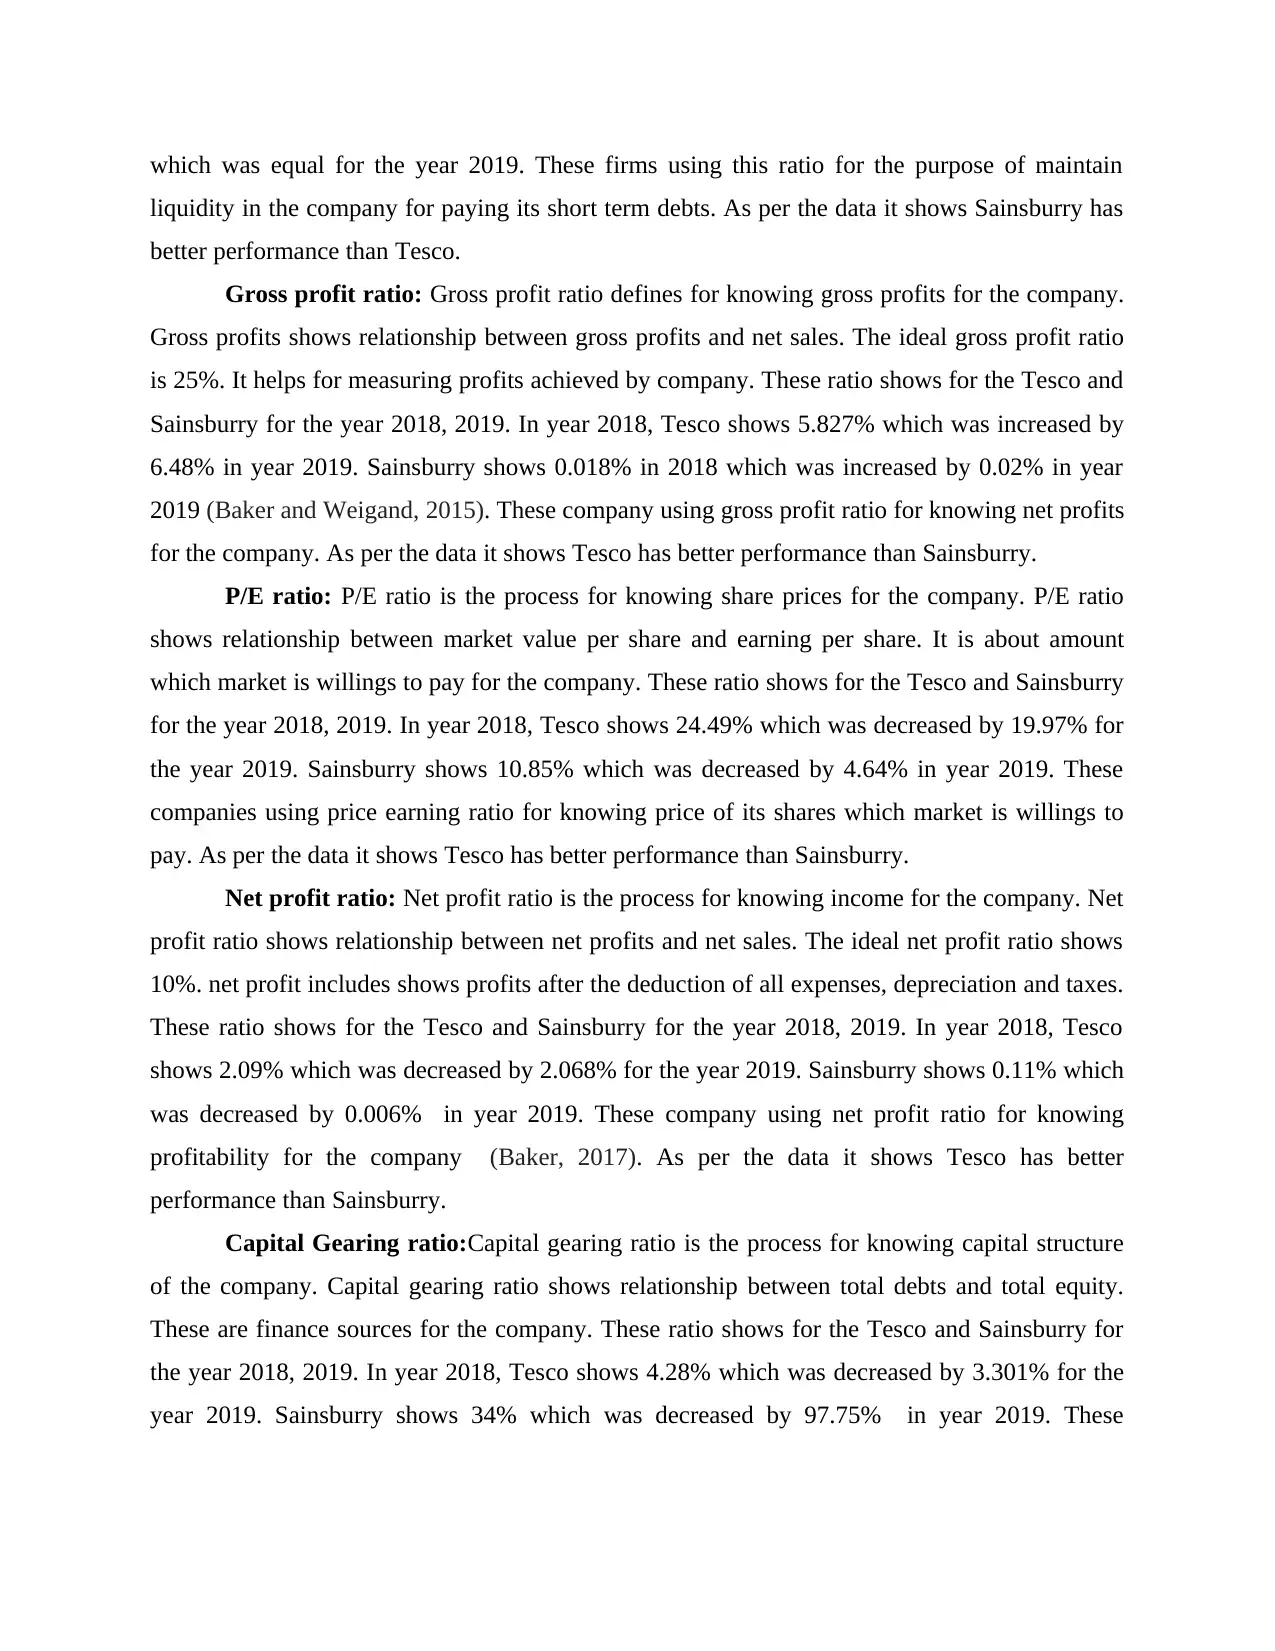
which was equal for the year 2019. These firms using this ratio for the purpose of maintain
liquidity in the company for paying its short term debts. As per the data it shows Sainsburry has
better performance than Tesco.
Gross profit ratio: Gross profit ratio defines for knowing gross profits for the company.
Gross profits shows relationship between gross profits and net sales. The ideal gross profit ratio
is 25%. It helps for measuring profits achieved by company. These ratio shows for the Tesco and
Sainsburry for the year 2018, 2019. In year 2018, Tesco shows 5.827% which was increased by
6.48% in year 2019. Sainsburry shows 0.018% in 2018 which was increased by 0.02% in year
2019 (Baker and Weigand, 2015). These company using gross profit ratio for knowing net profits
for the company. As per the data it shows Tesco has better performance than Sainsburry.
P/E ratio: P/E ratio is the process for knowing share prices for the company. P/E ratio
shows relationship between market value per share and earning per share. It is about amount
which market is willings to pay for the company. These ratio shows for the Tesco and Sainsburry
for the year 2018, 2019. In year 2018, Tesco shows 24.49% which was decreased by 19.97% for
the year 2019. Sainsburry shows 10.85% which was decreased by 4.64% in year 2019. These
companies using price earning ratio for knowing price of its shares which market is willings to
pay. As per the data it shows Tesco has better performance than Sainsburry.
Net profit ratio: Net profit ratio is the process for knowing income for the company. Net
profit ratio shows relationship between net profits and net sales. The ideal net profit ratio shows
10%. net profit includes shows profits after the deduction of all expenses, depreciation and taxes.
These ratio shows for the Tesco and Sainsburry for the year 2018, 2019. In year 2018, Tesco
shows 2.09% which was decreased by 2.068% for the year 2019. Sainsburry shows 0.11% which
was decreased by 0.006% in year 2019. These company using net profit ratio for knowing
profitability for the company (Baker, 2017). As per the data it shows Tesco has better
performance than Sainsburry.
Capital Gearing ratio:Capital gearing ratio is the process for knowing capital structure
of the company. Capital gearing ratio shows relationship between total debts and total equity.
These are finance sources for the company. These ratio shows for the Tesco and Sainsburry for
the year 2018, 2019. In year 2018, Tesco shows 4.28% which was decreased by 3.301% for the
year 2019. Sainsburry shows 34% which was decreased by 97.75% in year 2019. These
⊘ This is a preview!⊘
Do you want full access?
Subscribe today to unlock all pages.
Trusted by 1+ million students worldwide
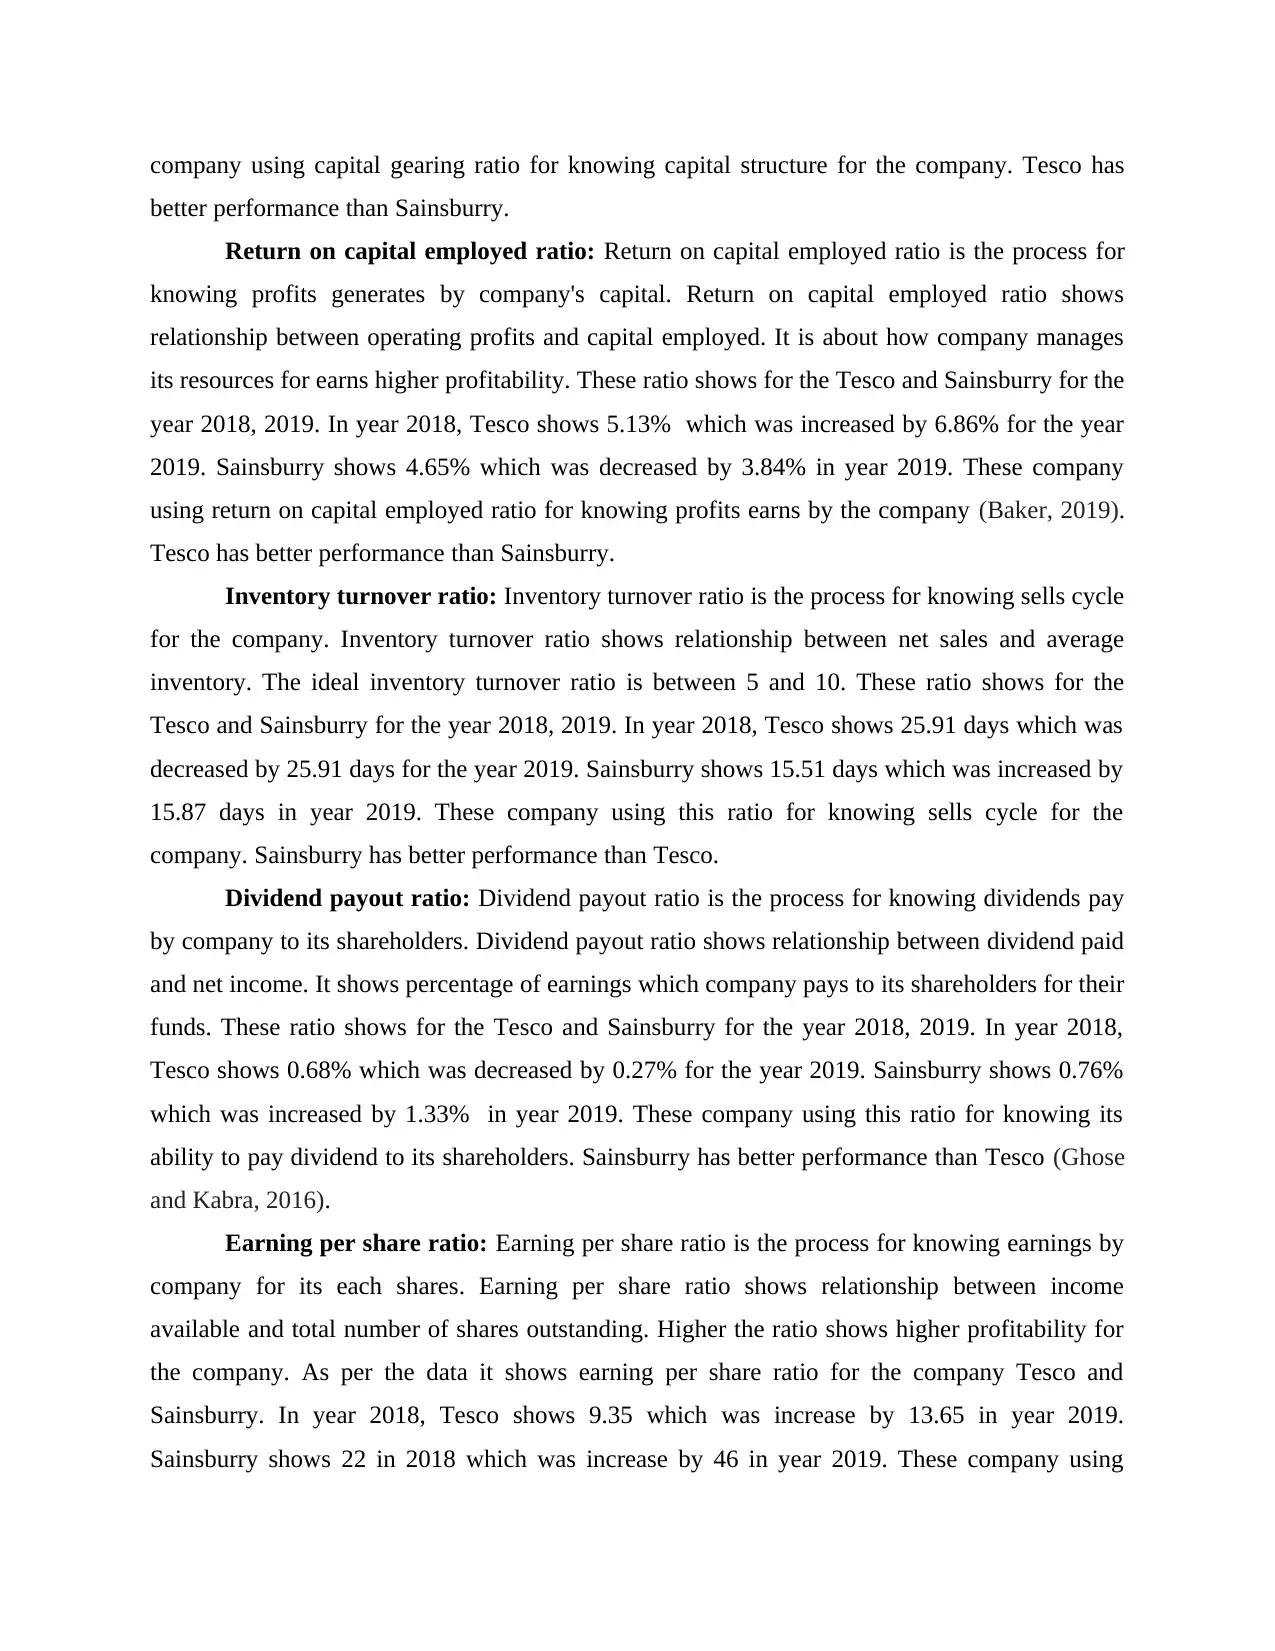
company using capital gearing ratio for knowing capital structure for the company. Tesco has
better performance than Sainsburry.
Return on capital employed ratio: Return on capital employed ratio is the process for
knowing profits generates by company's capital. Return on capital employed ratio shows
relationship between operating profits and capital employed. It is about how company manages
its resources for earns higher profitability. These ratio shows for the Tesco and Sainsburry for the
year 2018, 2019. In year 2018, Tesco shows 5.13% which was increased by 6.86% for the year
2019. Sainsburry shows 4.65% which was decreased by 3.84% in year 2019. These company
using return on capital employed ratio for knowing profits earns by the company (Baker, 2019).
Tesco has better performance than Sainsburry.
Inventory turnover ratio: Inventory turnover ratio is the process for knowing sells cycle
for the company. Inventory turnover ratio shows relationship between net sales and average
inventory. The ideal inventory turnover ratio is between 5 and 10. These ratio shows for the
Tesco and Sainsburry for the year 2018, 2019. In year 2018, Tesco shows 25.91 days which was
decreased by 25.91 days for the year 2019. Sainsburry shows 15.51 days which was increased by
15.87 days in year 2019. These company using this ratio for knowing sells cycle for the
company. Sainsburry has better performance than Tesco.
Dividend payout ratio: Dividend payout ratio is the process for knowing dividends pay
by company to its shareholders. Dividend payout ratio shows relationship between dividend paid
and net income. It shows percentage of earnings which company pays to its shareholders for their
funds. These ratio shows for the Tesco and Sainsburry for the year 2018, 2019. In year 2018,
Tesco shows 0.68% which was decreased by 0.27% for the year 2019. Sainsburry shows 0.76%
which was increased by 1.33% in year 2019. These company using this ratio for knowing its
ability to pay dividend to its shareholders. Sainsburry has better performance than Tesco (Ghose
and Kabra, 2016).
Earning per share ratio: Earning per share ratio is the process for knowing earnings by
company for its each shares. Earning per share ratio shows relationship between income
available and total number of shares outstanding. Higher the ratio shows higher profitability for
the company. As per the data it shows earning per share ratio for the company Tesco and
Sainsburry. In year 2018, Tesco shows 9.35 which was increase by 13.65 in year 2019.
Sainsburry shows 22 in 2018 which was increase by 46 in year 2019. These company using
Paraphrase This Document
Need a fresh take? Get an instant paraphrase of this document with our AI Paraphraser
earning per share ratio for knowing profitability of the company (Gitman, Juchau and Flanagan,
2015). Sainsburry has better performance than Tesco.
Recommendations:
From the above report it shows organisations should manage its current assets for paying
short term liabilities and managing its day to day activities.
For managing its gross profits firm should gives discounts, offers to customers so that
they can manage its sales.
For the improvement in net profit ratio for companies should decreases their indirect
expenses, using its resources efficiently which decreases its expenses which leads to
organisations higher profitability (HACIOGLU and Dincer, 2016).
Inventory turnover ratio shows organisations not managing its resources properly, it has
to manage its resources effectively and efficiently for higher sales.
For increasing earning per share, organisations has to increase its value by using
resources in the better way so that it can increase its value.
Limitations for ratio analysis in order to know financial position:
Ratio analysis information is historic, it is not current.
Ratio analysis does not take into account external factors includes the worldwide
recession.
Ratio analysis does not measure the human element of the organisations.
Ratio analysis can only be used for comparison with other firms of the same size and type
organisation.
It may be difficult for comparing with other businesses as they may not be willing for
share the information.
Ratio analysis helps in providing the historic data and on the basis of the past results is
generated it does not used the present data which affects the efficiency of the company.
The external factors affecting the accounting system is not taken into the account like the
factors includes the recession period which does not taken and accurate results cannot be
generated (Jitmaneeroj, 2018).
The ratio analysis become difficult while comparing as it does not give the accurate
results as different companies have different accounting so the information is not useful.
Ratio analysis can be compared only with the firms of the same types and the size no
other type of firm can be compared.
Ratio analysis contains information or prior period. In other words, in ratio analysis past
or historic data is utilised. Hence, it is not necessary that such interpretation of such data
provides adequate information according to current business situation.
Human element is not considered in computation of ratio analysis.
External factors, for example, worldwide recession is not taken into consideration on
calculation of ratio analysis. Although, it has huge impact on business (Li, Niskanen and
Niskanen, 2019).
It is not suitable to compare with entity that uses different accounting policies.
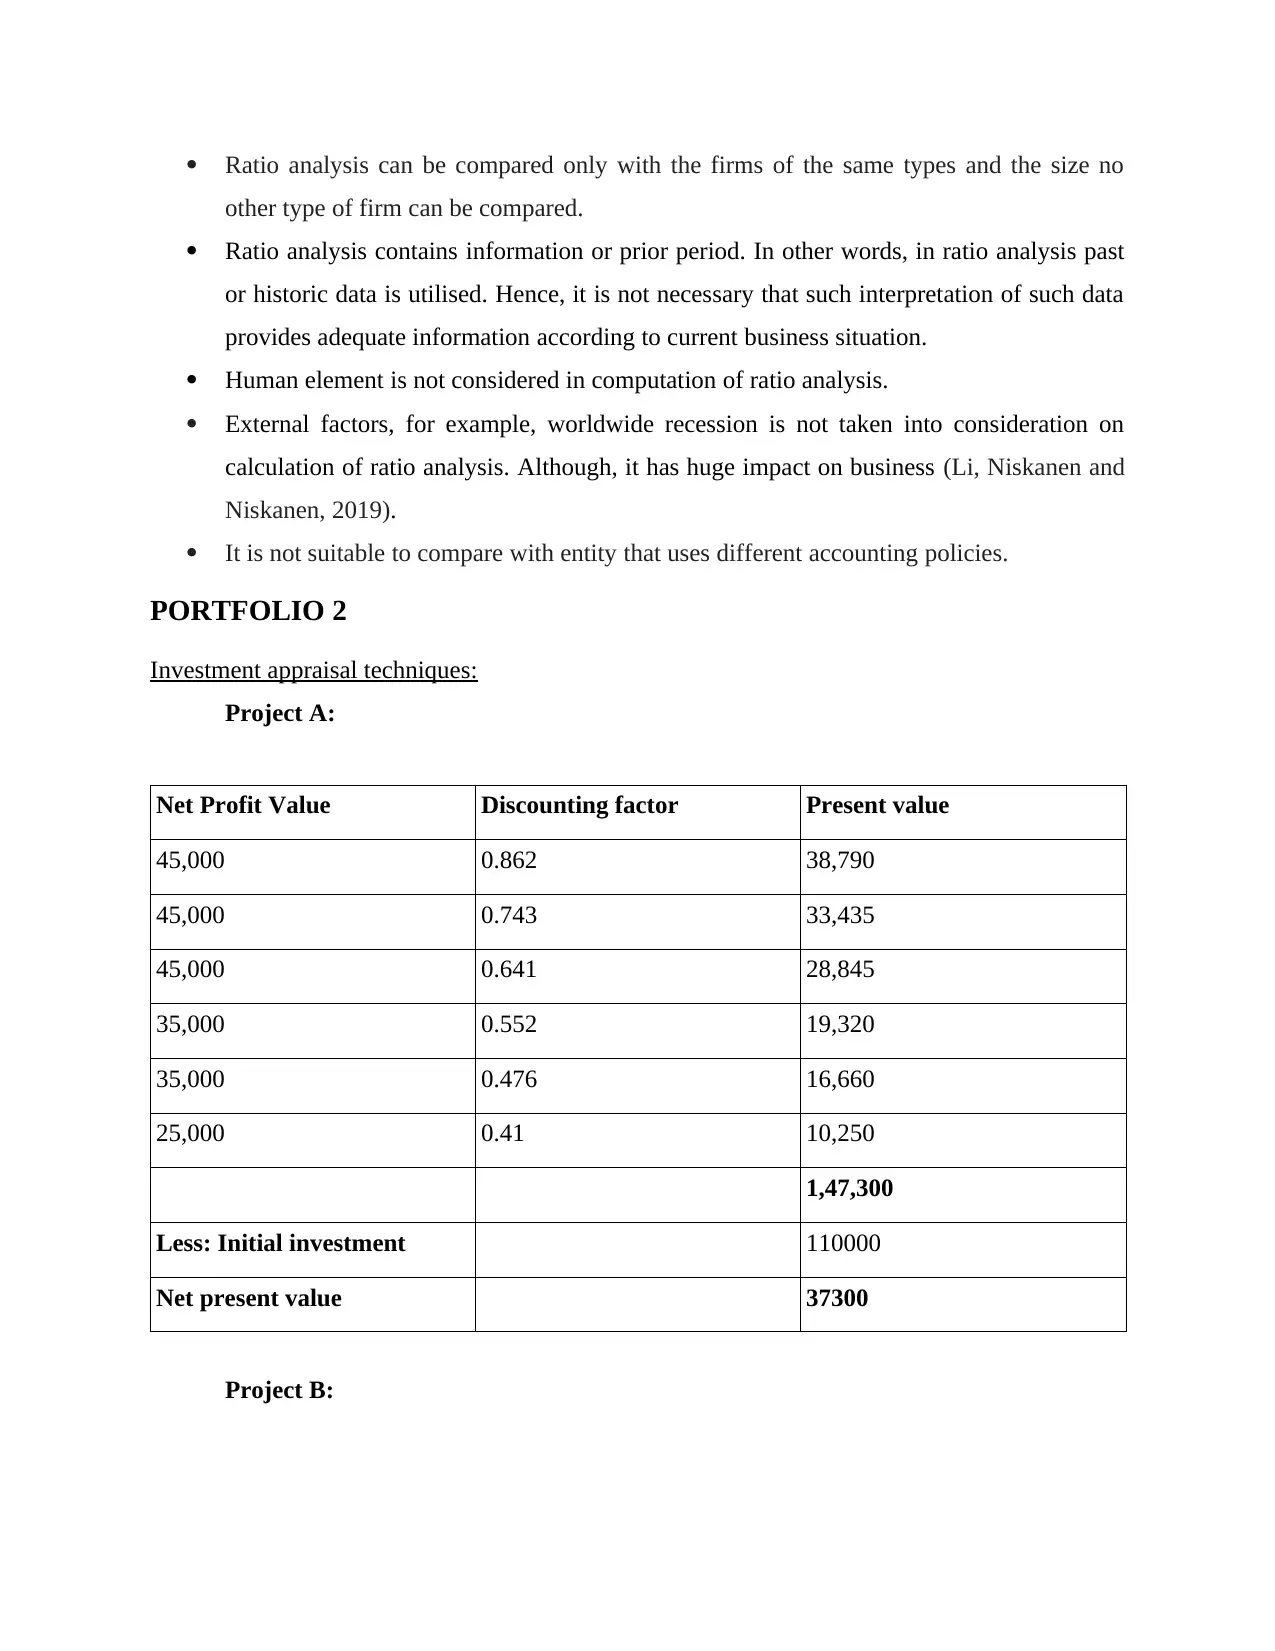
PORTFOLIO 2
Investment appraisal techniques:
Project A:
Net Profit Value Discounting factor Present value
45,000 0.862 38,790
45,000 0.743 33,435
45,000 0.641 28,845
35,000 0.552 19,320
35,000 0.476 16,660
25,000 0.41 10,250
1,47,300
Less: Initial investment 110000
Net present value 37300
Project B:
other type of firm can be compared.
Ratio analysis contains information or prior period. In other words, in ratio analysis past
or historic data is utilised. Hence, it is not necessary that such interpretation of such data
provides adequate information according to current business situation.
Human element is not considered in computation of ratio analysis.
External factors, for example, worldwide recession is not taken into consideration on
calculation of ratio analysis. Although, it has huge impact on business (Li, Niskanen and
Niskanen, 2019).
It is not suitable to compare with entity that uses different accounting policies.
PORTFOLIO 2
Investment appraisal techniques:
Project A:
Net Profit Value Discounting factor Present value
45,000 0.862 38,790
45,000 0.743 33,435
45,000 0.641 28,845
35,000 0.552 19,320
35,000 0.476 16,660
25,000 0.41 10,250
1,47,300
Less: Initial investment 110000
Net present value 37300
Project B:
⊘ This is a preview!⊘
Do you want full access?
Subscribe today to unlock all pages.
Trusted by 1+ million students worldwide
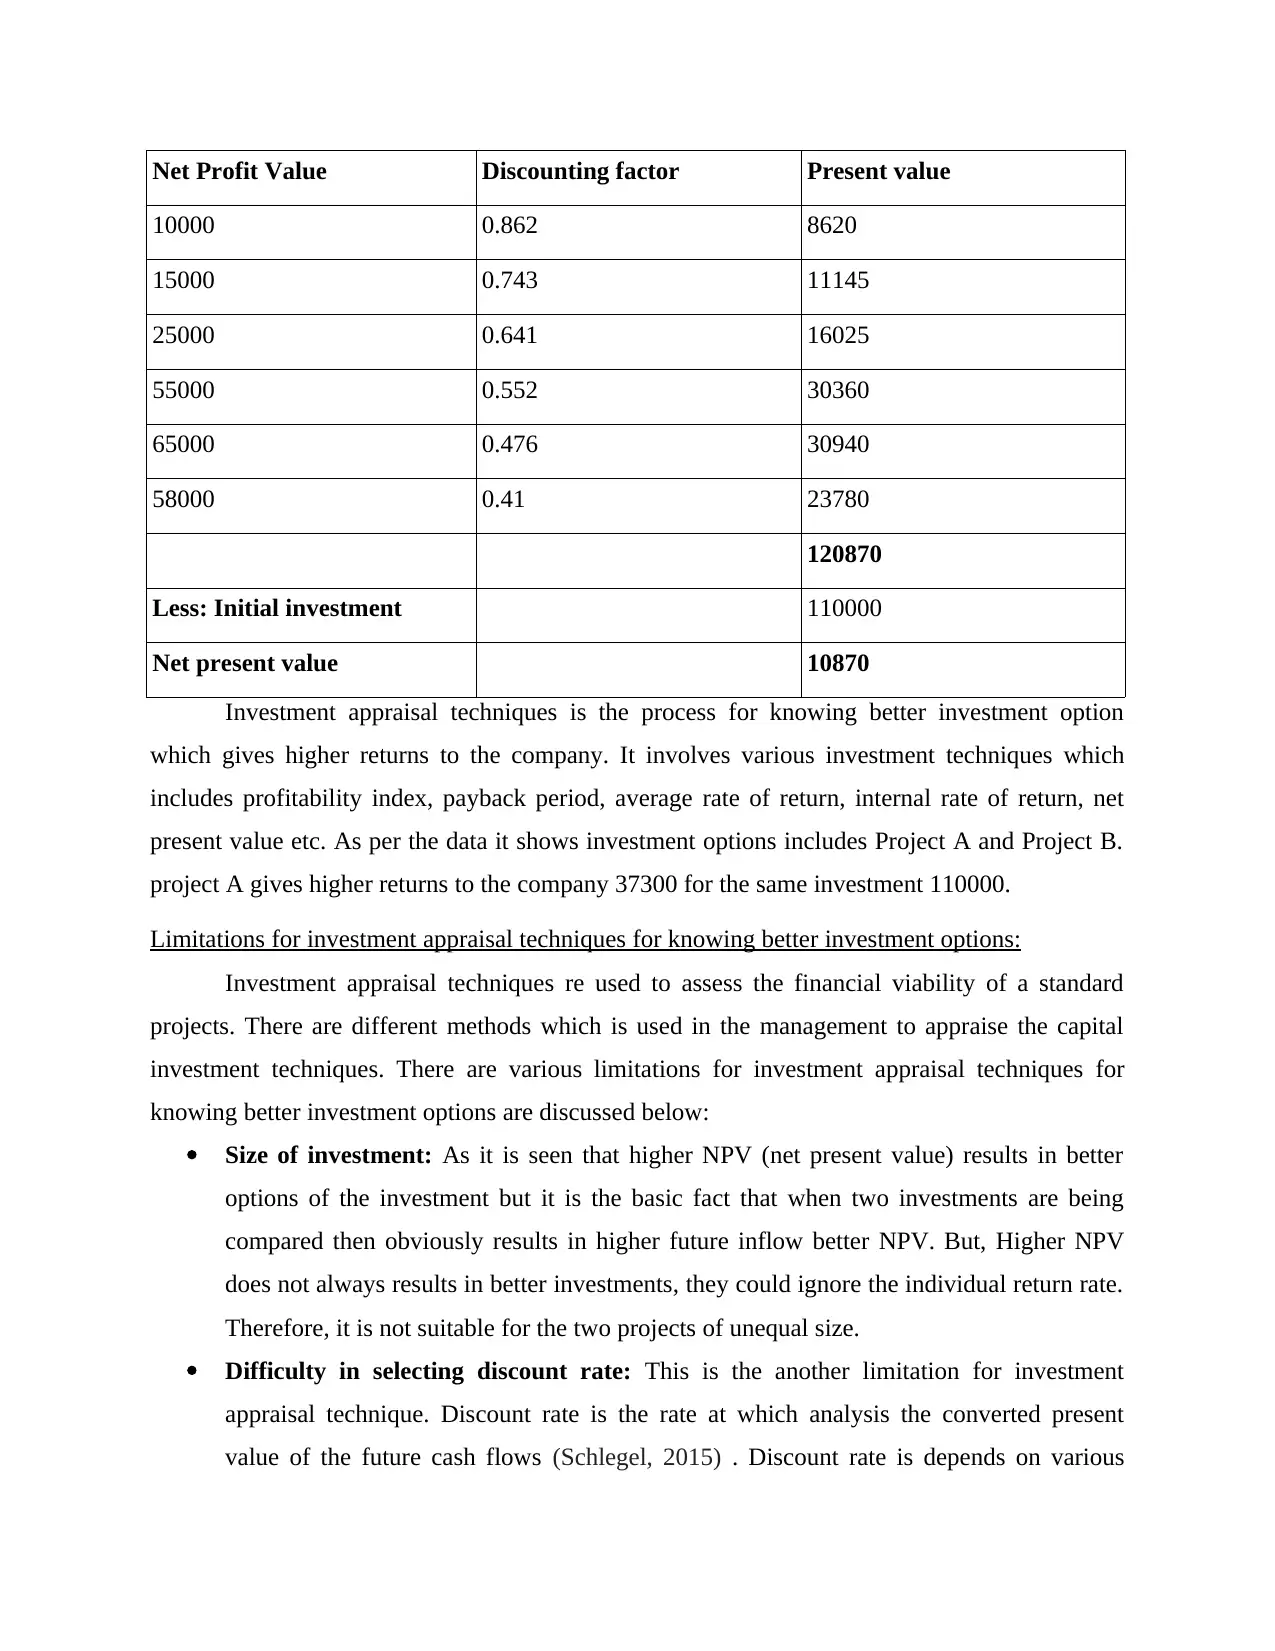
Net Profit Value Discounting factor Present value
10000 0.862 8620
15000 0.743 11145
25000 0.641 16025
55000 0.552 30360
65000 0.476 30940
58000 0.41 23780
120870
Less: Initial investment 110000
Net present value 10870
Investment appraisal techniques is the process for knowing better investment option
which gives higher returns to the company. It involves various investment techniques which
includes profitability index, payback period, average rate of return, internal rate of return, net
present value etc. As per the data it shows investment options includes Project A and Project B.
project A gives higher returns to the company 37300 for the same investment 110000.
Limitations for investment appraisal techniques for knowing better investment options:
Investment appraisal techniques re used to assess the financial viability of a standard
projects. There are different methods which is used in the management to appraise the capital
investment techniques. There are various limitations for investment appraisal techniques for
knowing better investment options are discussed below:
Size of investment: As it is seen that higher NPV (net present value) results in better
options of the investment but it is the basic fact that when two investments are being
compared then obviously results in higher future inflow better NPV. But, Higher NPV
does not always results in better investments, they could ignore the individual return rate.
Therefore, it is not suitable for the two projects of unequal size.
Difficulty in selecting discount rate: This is the another limitation for investment
appraisal technique. Discount rate is the rate at which analysis the converted present
value of the future cash flows (Schlegel, 2015) . Discount rate is depends on various
Paraphrase This Document
Need a fresh take? Get an instant paraphrase of this document with our AI Paraphraser
factors like calculative accuracy, risk involved etc. they can be easily convert into
mistakes. Also, factors like risk are changing over the period of time and can give
incorrect rate of return to the company which can cost heavily to the organisation.
Difficult in estimating cash flows and cost of capital: Another limitation is difficulty in
estimating appropriate future cash flows and cost of capital. Company analysis the
financial viability according to the basis of future cash flows but this can create difficulty
in ascertaining the cash flows. There are two types of risk involved in the company that is
structured and unstructured. This can be change dynamically in the company. Cost of
capital is the capital that is investment proposed is going to incur and analysis of which is
decided by the risk taken or not. If company make projects cost of capital then it might
not or may be take the risk or not.
Ignores money time value: Some techniques of investment like pay back period and
accounting rate ignore the money time value. Pay back period also ignore the cash flows
and make post pay pack period. This can give accurate profitability and revenue status for
the proposed projects ad cannot make the definite of the correctiveness of financial
advice generated according to the results.
Complicated to understand: This is the another limitation for investment appraisal
techniques. As techniques like pay back period are easy and feasible to understand but
they cannot make appropriate Net present value. However, net present value is difficulty
to understand and requires proper knowledge by the managers of the company to identify
cost of capital. On the other hand other methods like internal rate of return is is also
difficult to understand because it is the rate at which Net present value is equals to zero
(Singh, 2016). Sometimes non- conventional cash flows can give rise for internal rate of
return and also there is high chances of contradicting advices in IRR and NPV ratios in
proposed projects.
CONCLUSION
From the above report it has been concluded that finance is the process for acquiring and
managing funds for the organisations activities. Financial management is the process for
managing financial activities for the organisations. Financial management has various functions
which includes planning, organising, analysing, controlling, managing financial activities. Ratio

analysis is the process for comparing actual performance from expected performance. Ratio
analysis helps business for knowing its liquidity, solvency, profitability etc. Investment appraisal
techniques is the process for knowing better investment option which gives higher returns to the
company. It involves various investment techniques which includes profitability index, payback
period, average rate of return, internal rate of return, net present value etc. Investment appraisal
techniques helps firms for achieving profitability.
⊘ This is a preview!⊘
Do you want full access?
Subscribe today to unlock all pages.
Trusted by 1+ million students worldwide
1 out of 13
Related Documents


Your All-in-One AI-Powered Toolkit for Academic Success.
+13062052269
info@desklib.com
Available 24*7 on WhatsApp / Email
![[object Object]](/_next/static/media/star-bottom.7253800d.svg)
Unlock your academic potential
Copyright © 2020–2026 A2Z Services. All Rights Reserved. Developed and managed by ZUCOL.