Financial Resources Report: Management and Financial Accounting
VerifiedAdded on 2023/01/13
|14
|2581
|68
Report
AI Summary
This report provides a comprehensive analysis of financial resources, focusing on management and financial accounting principles. It delves into the significance of financial resources for organizations, using Swipe-wire as a case study. The report explains the differences between management and financial accounting and explores capital budgeting techniques such as cost-benefit analysis, payback period, accounting rate of return, net present value, and internal rate of return. Through these techniques, the report evaluates different project alternatives and provides a detailed analysis of financial ratios, including gross profit margin, net profit margin, return on capital invested, return on assets, return on equity, current ratio, and acid-test ratio. The analysis compares financial performance between 2017 and 2018, offering suggestions for improvement. The report concludes by highlighting the importance of financial resource management for organizational success.

Financial Resources
Paraphrase This Document
Need a fresh take? Get an instant paraphrase of this document with our AI Paraphraser

EXECUTIVE SUMMARY
Financial resources are those factors by which an organisation generate their monetary funds.
This report is prepared on the basis of examine concept of financial resources, managerial and
financial accounting.
In this report capital budgeting techniques and financial ratios are uses for taking business
decision for choosing best alternative option compare with others.
Table of Contents
EXECUTIVE SUMMARY.............................................................................................................2
INTRODUCTION...........................................................................................................................1
QUESTION 1...................................................................................................................................1
Explanation of management and financial accounting................................................................1
Difference between management and financial accounting with respective users......................1
QUESTION2....................................................................................................................................2
Cost benefit analysis....................................................................................................................2
Payback period.............................................................................................................................3
Accounting rate of return.............................................................................................................4
Net present value and internal rate of return................................................................................5
Analysis and conclusion..............................................................................................................6
QUESTION 3...................................................................................................................................7
Calculation of ratios.....................................................................................................................7
Comparison of ratios....................................................................................................................8
Suggestions for improvement......................................................................................................9
CONCLUSION................................................................................................................................9
REFRENCES.................................................................................................................................10
⊘ This is a preview!⊘
Do you want full access?
Subscribe today to unlock all pages.
Trusted by 1+ million students worldwide
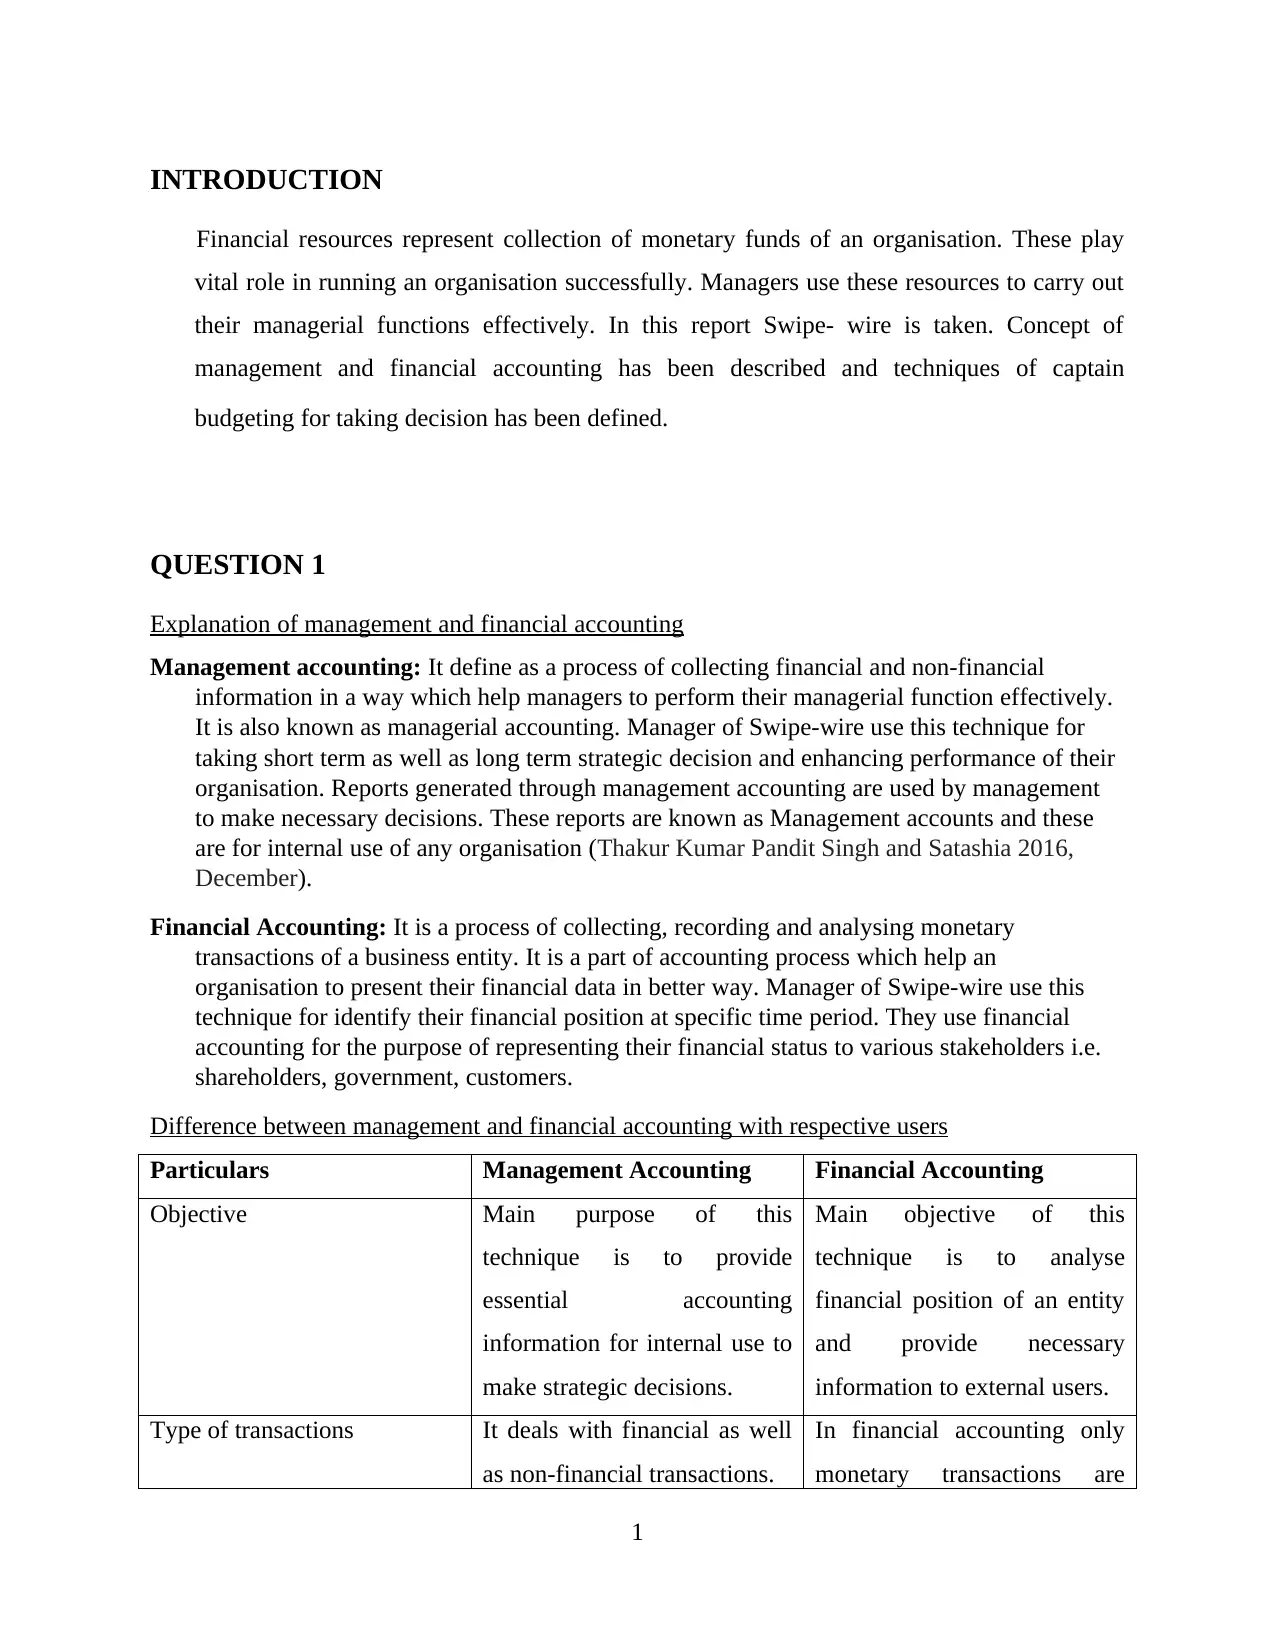
INTRODUCTION
Financial resources represent collection of monetary funds of an organisation. These play
vital role in running an organisation successfully. Managers use these resources to carry out
their managerial functions effectively. In this report Swipe- wire is taken. Concept of
management and financial accounting has been described and techniques of captain
budgeting for taking decision has been defined.
QUESTION 1
Explanation of management and financial accounting
Management accounting: It define as a process of collecting financial and non-financial
information in a way which help managers to perform their managerial function effectively.
It is also known as managerial accounting. Manager of Swipe-wire use this technique for
taking short term as well as long term strategic decision and enhancing performance of their
organisation. Reports generated through management accounting are used by management
to make necessary decisions. These reports are known as Management accounts and these
are for internal use of any organisation (Thakur Kumar Pandit Singh and Satashia 2016,
December).
Financial Accounting: It is a process of collecting, recording and analysing monetary
transactions of a business entity. It is a part of accounting process which help an
organisation to present their financial data in better way. Manager of Swipe-wire use this
technique for identify their financial position at specific time period. They use financial
accounting for the purpose of representing their financial status to various stakeholders i.e.
shareholders, government, customers.
Difference between management and financial accounting with respective users
Particulars Management Accounting Financial Accounting
Objective Main purpose of this
technique is to provide
essential accounting
information for internal use to
make strategic decisions.
Main objective of this
technique is to analyse
financial position of an entity
and provide necessary
information to external users.
Type of transactions It deals with financial as well
as non-financial transactions.
In financial accounting only
monetary transactions are
1
Paraphrase This Document
Need a fresh take? Get an instant paraphrase of this document with our AI Paraphraser
considered.
Legality There is no statutory
requirement to make
management accounts.
There are several laws to be
followed during preparation of
financial statements i.e.
prescribed formats.
Tools In management accounting,
manager take decision with
the help of various methods
i.e. standard costing, marginal
costing, ABC analysis, EOQ
technique etc (Santos, 2016)
In financial accounting,
managers prepares financial
statements, ratio analysis.
Basis of information These are the expected results
calculated from past trends.
Financial statements are
prepared from historical data.
Scope Management accounting has
narrow scope as it covers
limited area of business
environment.
Financial accounting has
wider scope than management
accounting.
Users This tool of accounting is used
by managerial department
only.
Financial statements are used
by shareholders, customers,
Government, creditors etc.
Measurement of performance Performance are valued on the
basis of measurement of value
creation like EVA, SVA.
Performance of an
organisation is measured by
financial results which are net
profit, comprehensive income.
Accounting period It does not follow any specific
time period. It depends on the
managerial requirements.
Financial statements are
prepared for specific time
period.
Audit Auditing process is not
mandatory for management
accounts (Casale Mashiah,
2015).
It is mandatory for an
organisation to appoint
chartered accountants for
auditing of financial
2
statements.
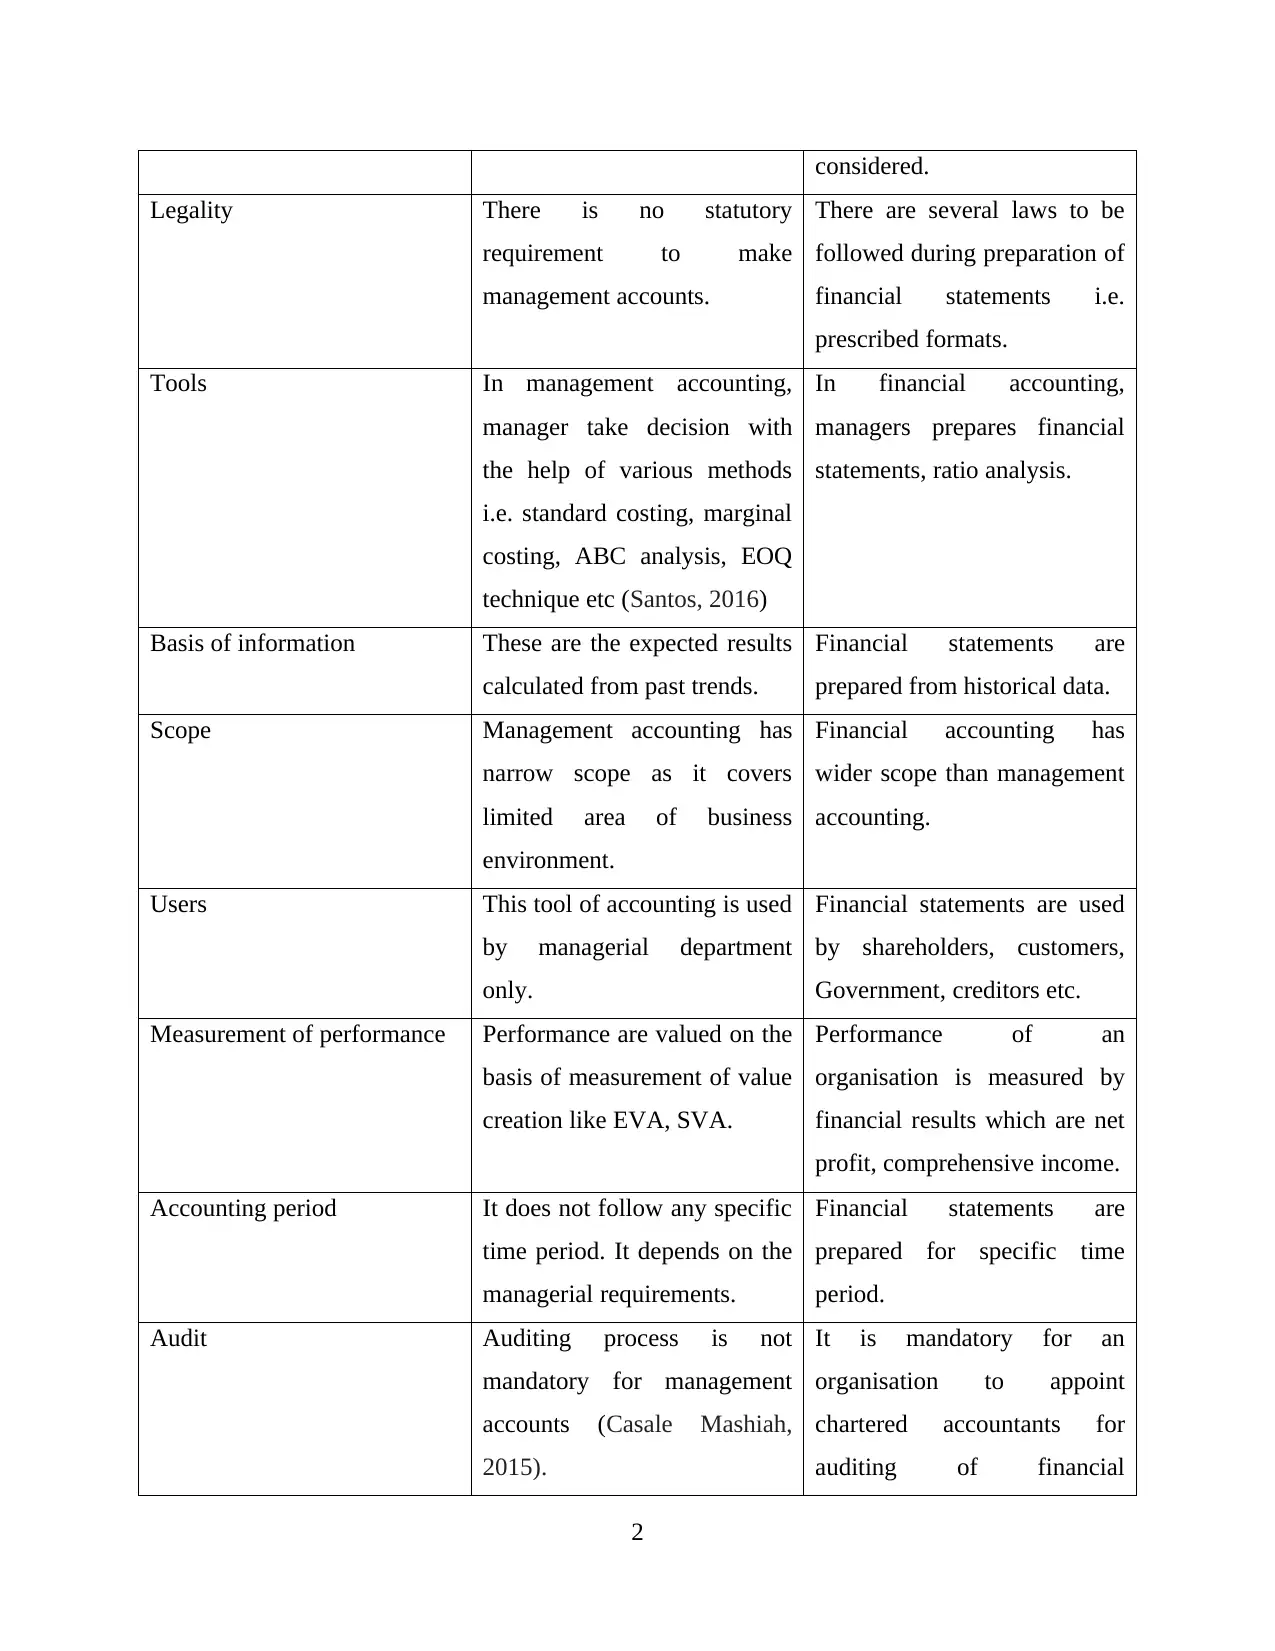
QUESTION 2
Simple Cost/Benefit analysis:
Year Project A Project B Project C
1 25000 150000 200000
2 100000 150000 250000
3 250000 150000 25000
4 300000 200000 25000
5 50000 200000 100000
6 50000 20000 275000
Total Benefit 775000 870000 875000
Initial Investment 600000 600000 600000
Net Benefit 175000 270000 275000
Payback period
Years Project A Project B Project C
Cash inflow
Cumulative
cash inflow Cash inflow
Cumulative
cash inflow Cash inflow
Cumulative
cash inflow
Year 1 25000 25000 150000 150000 200000 200000
Year 2 100000 125000 150000 300000 250000 450000
Year 3 250000 375000 150000 450000 25000 475000
Year 4 300000 675000 200000 650000 25000 500000
Year 5 50000 725000 200000 850000 100000 600000
Year 6 50000 775000 200000 1050000 275000 875000
3
⊘ This is a preview!⊘
Do you want full access?
Subscribe today to unlock all pages.
Trusted by 1+ million students worldwide
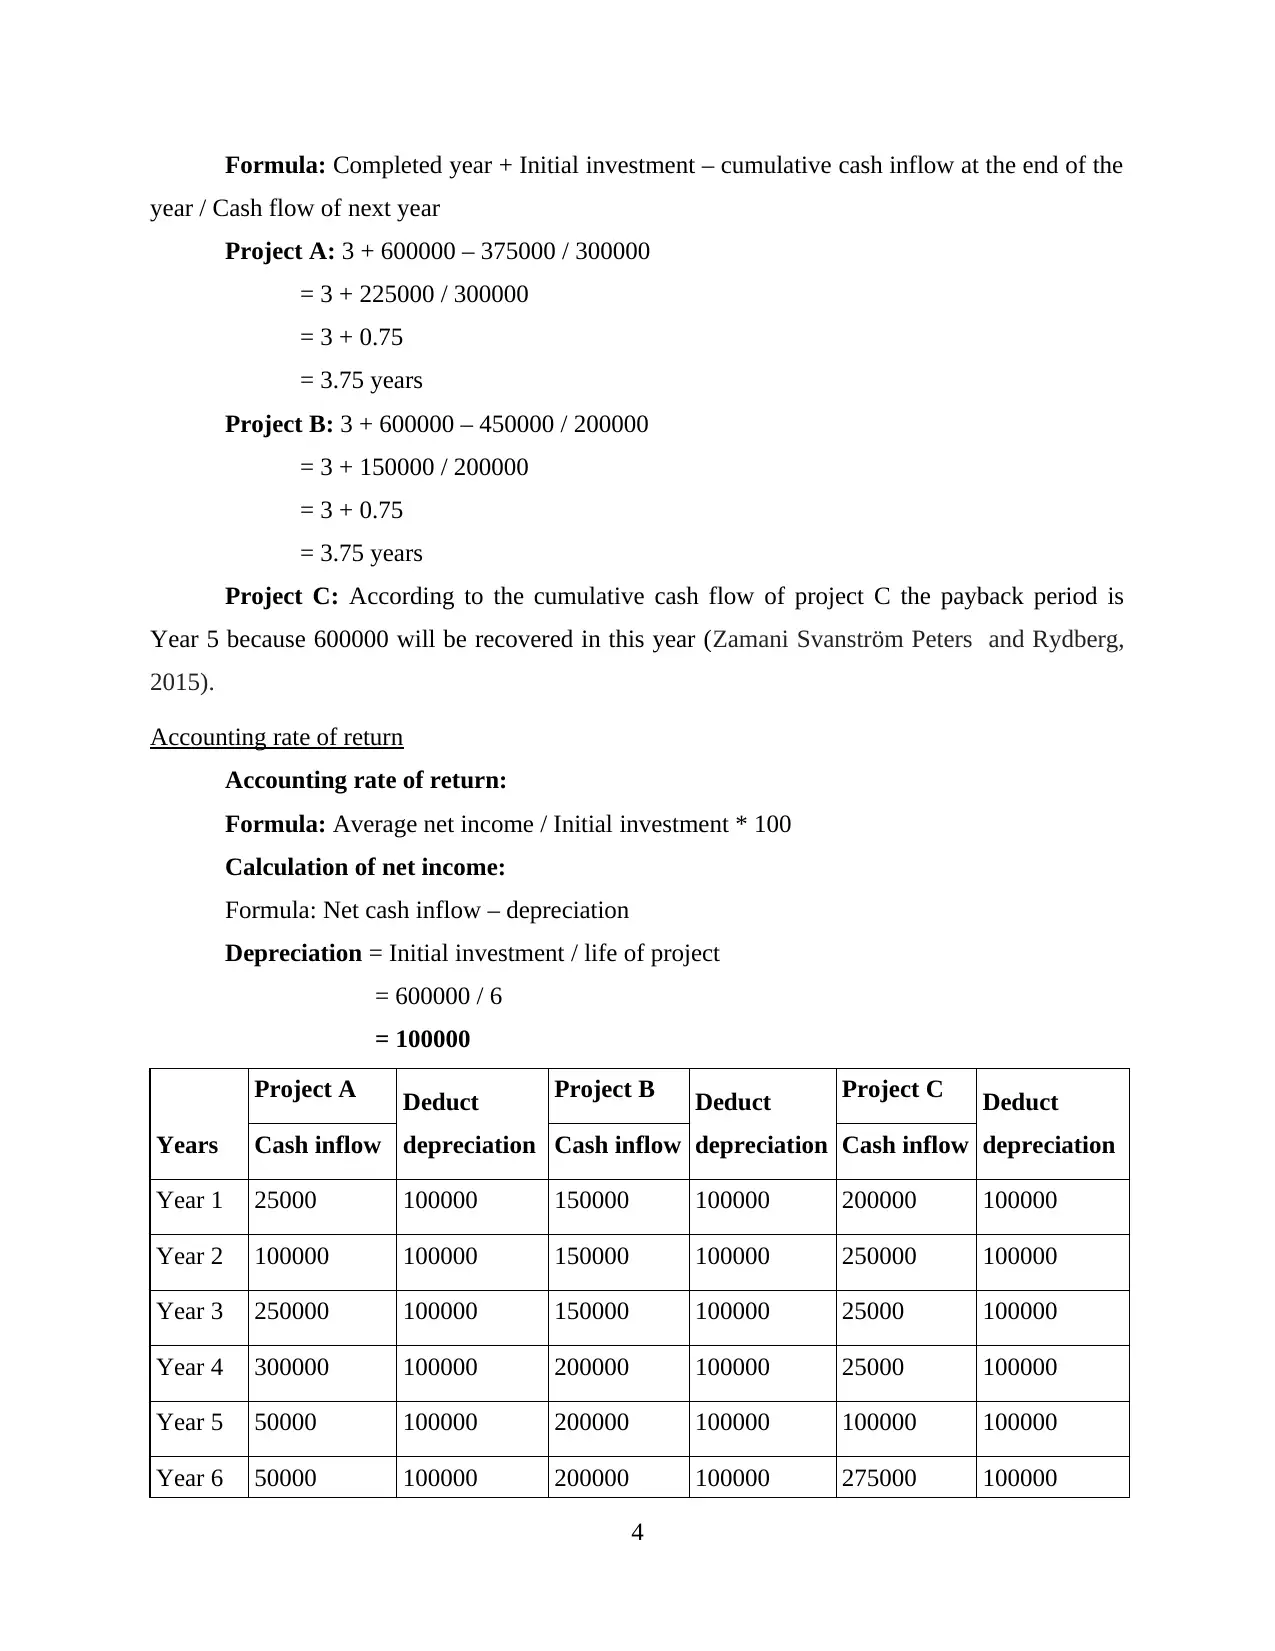
Formula: Completed year + Initial investment – cumulative cash inflow at the end of the
year / Cash flow of next year
Project A: 3 + 600000 – 375000 / 300000
= 3 + 225000 / 300000
= 3 + 0.75
= 3.75 years
Project B: 3 + 600000 – 450000 / 200000
= 3 + 150000 / 200000
= 3 + 0.75
= 3.75 years
Project C: According to the cumulative cash flow of project C the payback period is
Year 5 because 600000 will be recovered in this year (Zamani Svanström Peters and Rydberg,
2015).
Accounting rate of return
Accounting rate of return:
Formula: Average net income / Initial investment * 100
Calculation of net income:
Formula: Net cash inflow – depreciation
Depreciation = Initial investment / life of project
= 600000 / 6
= 100000
Years
Project A Deduct
depreciation
Project B Deduct
depreciation
Project C Deduct
depreciationCash inflow Cash inflow Cash inflow
Year 1 25000 100000 150000 100000 200000 100000
Year 2 100000 100000 150000 100000 250000 100000
Year 3 250000 100000 150000 100000 25000 100000
Year 4 300000 100000 200000 100000 25000 100000
Year 5 50000 100000 200000 100000 100000 100000
Year 6 50000 100000 200000 100000 275000 100000
4
Paraphrase This Document
Need a fresh take? Get an instant paraphrase of this document with our AI Paraphraser
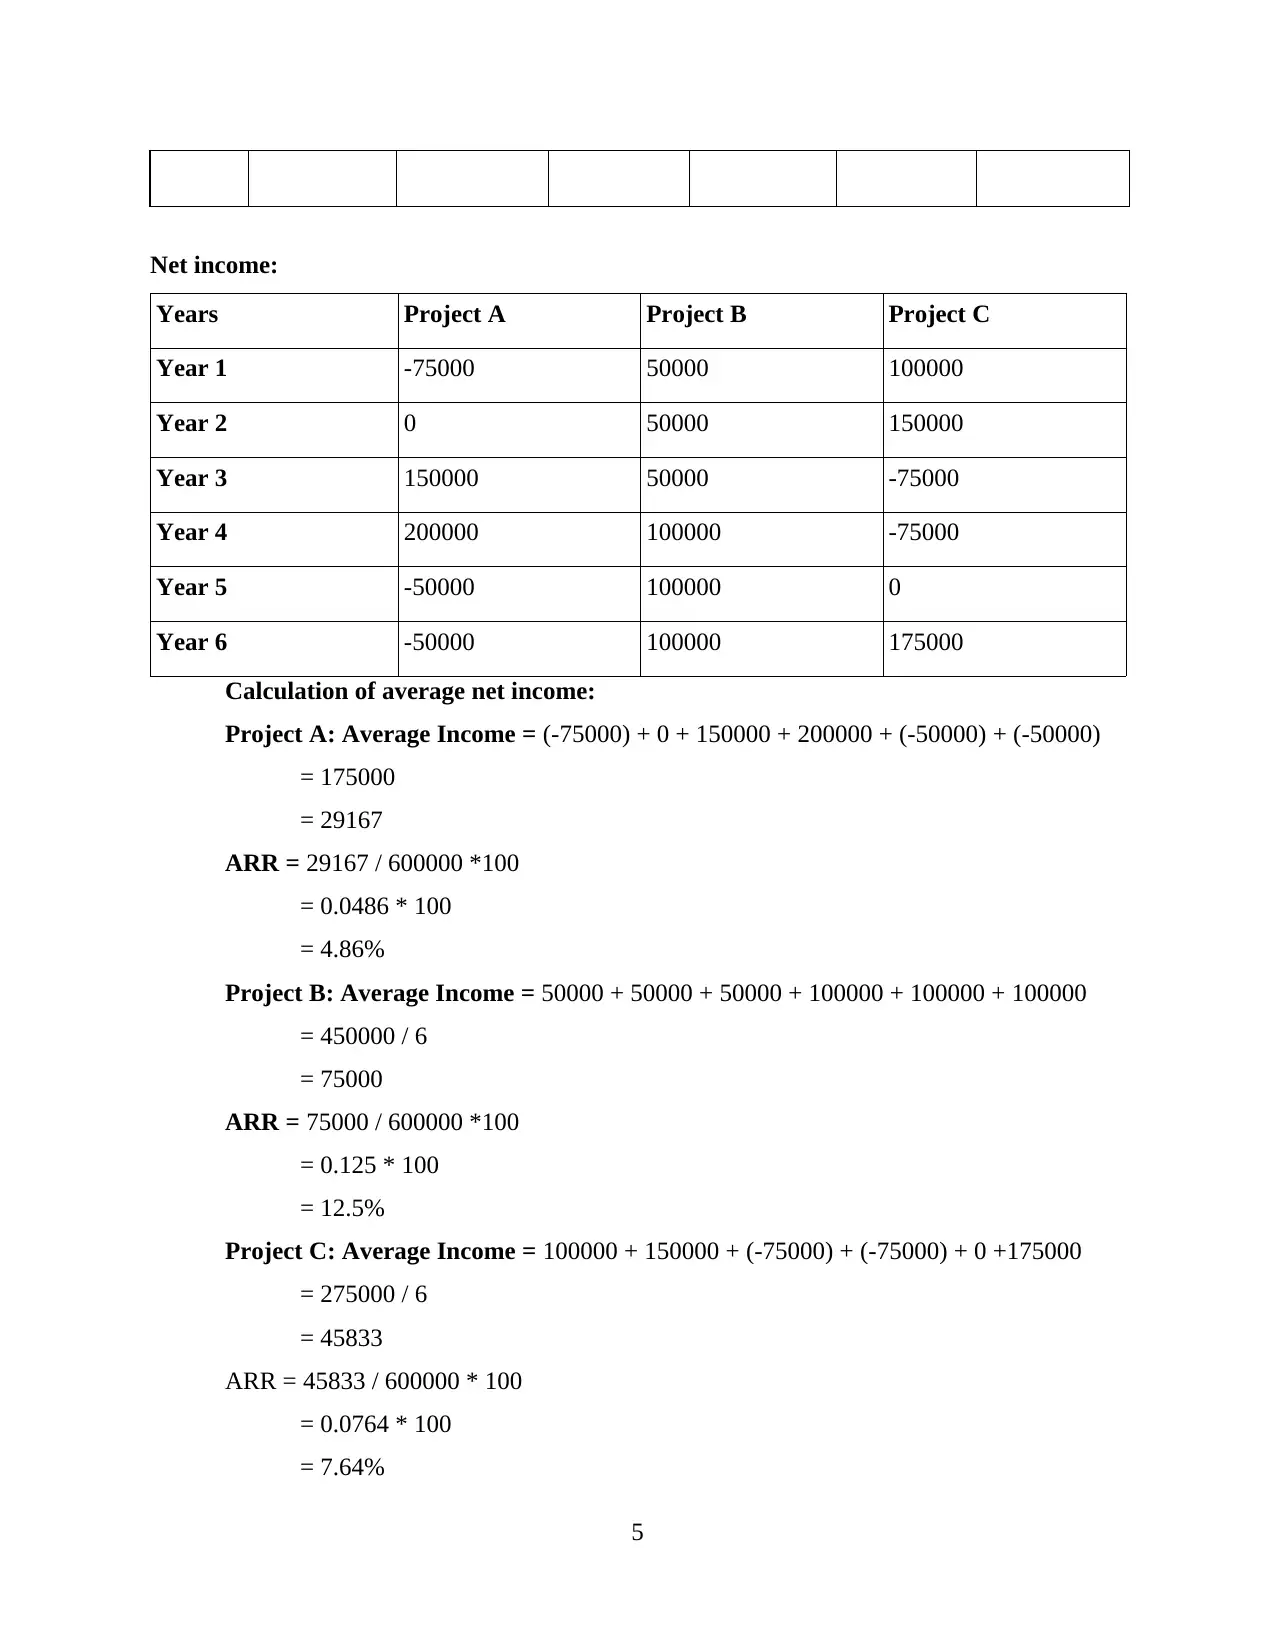
Net income:
Years Project A Project B Project C
Year 1 -75000 50000 100000
Year 2 0 50000 150000
Year 3 150000 50000 -75000
Year 4 200000 100000 -75000
Year 5 -50000 100000 0
Year 6 -50000 100000 175000
Calculation of average net income:
Project A: Average Income = (-75000) + 0 + 150000 + 200000 + (-50000) + (-50000)
= 175000
= 29167
ARR = 29167 / 600000 *100
= 0.0486 * 100
= 4.86%
Project B: Average Income = 50000 + 50000 + 50000 + 100000 + 100000 + 100000
= 450000 / 6
= 75000
ARR = 75000 / 600000 *100
= 0.125 * 100
= 12.5%
Project C: Average Income = 100000 + 150000 + (-75000) + (-75000) + 0 +175000
= 275000 / 6
= 45833
ARR = 45833 / 600000 * 100
= 0.0764 * 100
= 7.64%
5
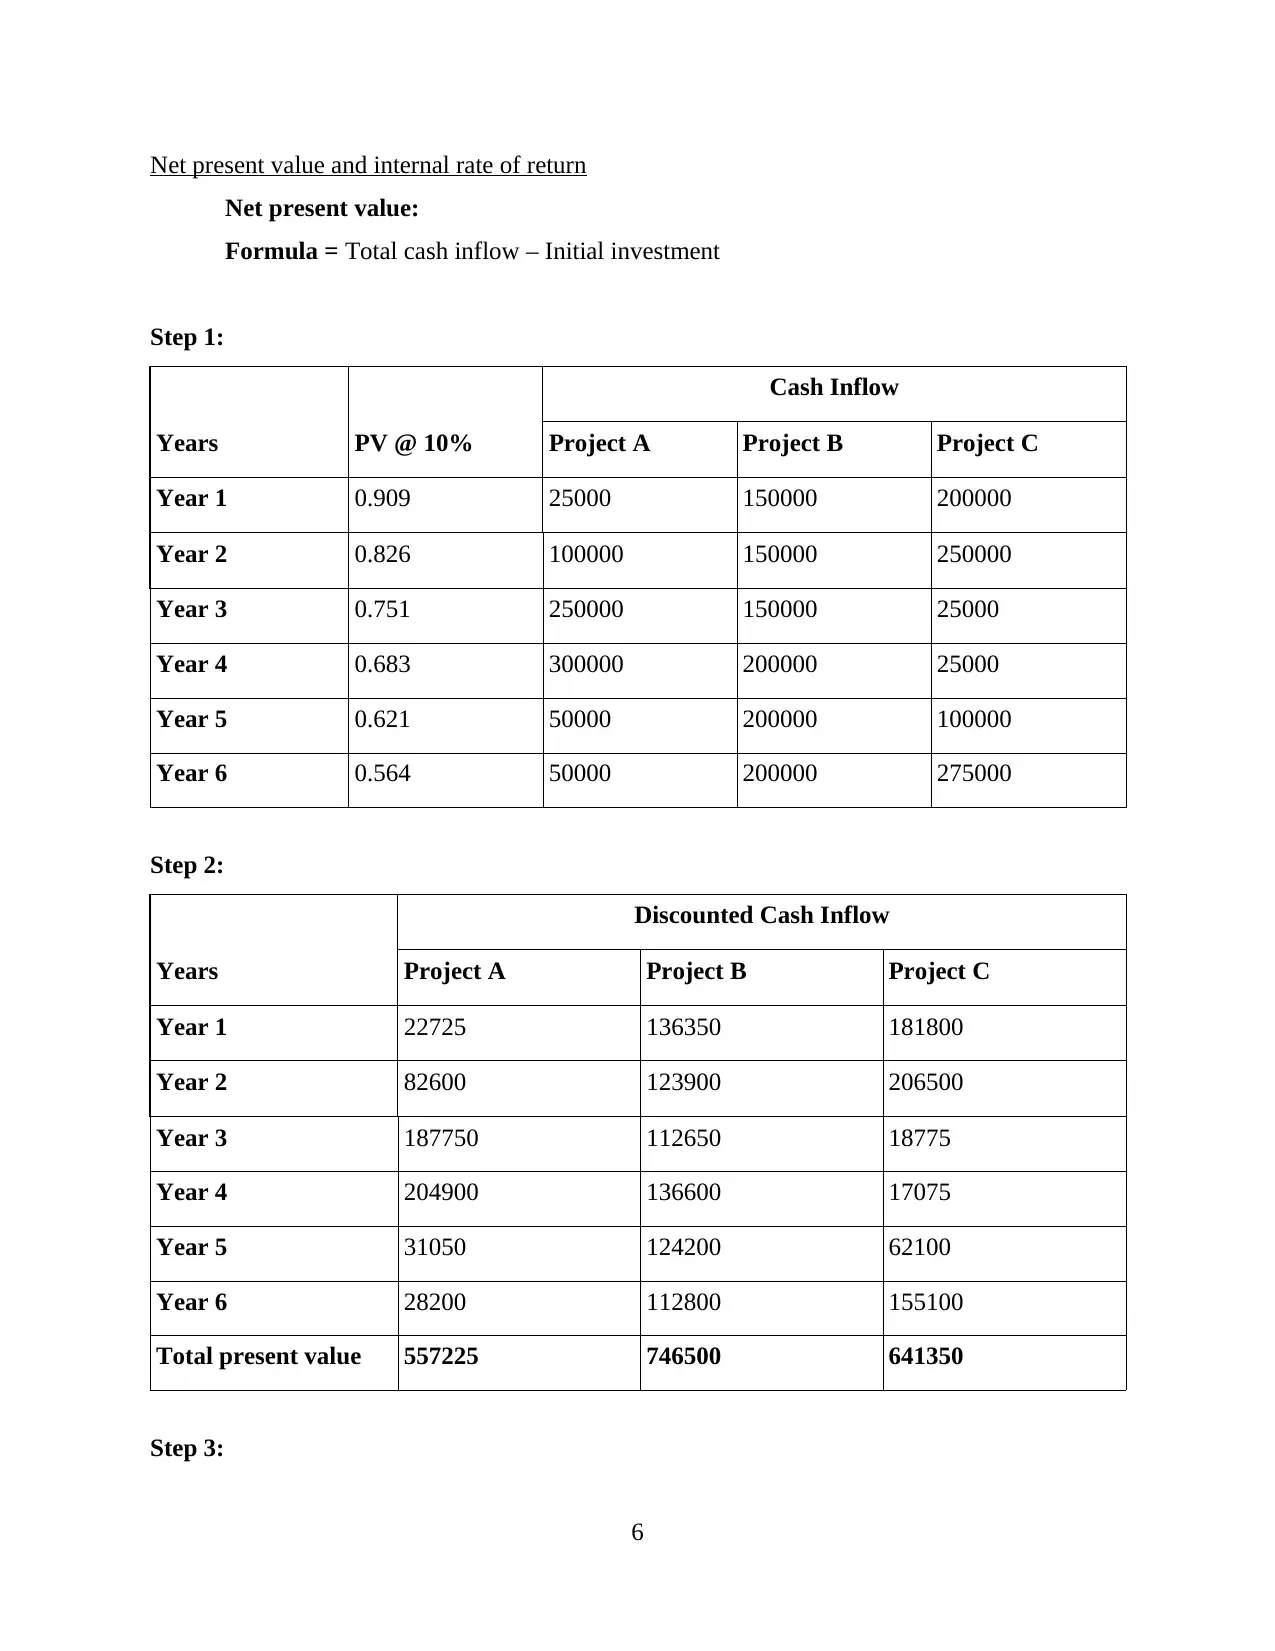
Net present value and internal rate of return
Net present value:
Formula = Total cash inflow – Initial investment
Step 1:
Years PV @ 10%
Cash Inflow
Project A Project B Project C
Year 1 0.909 25000 150000 200000
Year 2 0.826 100000 150000 250000
Year 3 0.751 250000 150000 25000
Year 4 0.683 300000 200000 25000
Year 5 0.621 50000 200000 100000
Year 6 0.564 50000 200000 275000
Step 2:
Years
Discounted Cash Inflow
Project A Project B Project C
Year 1 22725 136350 181800
Year 2 82600 123900 206500
Year 3 187750 112650 18775
Year 4 204900 136600 17075
Year 5 31050 124200 62100
Year 6 28200 112800 155100
Total present value 557225 746500 641350
Step 3:
6
⊘ This is a preview!⊘
Do you want full access?
Subscribe today to unlock all pages.
Trusted by 1+ million students worldwide
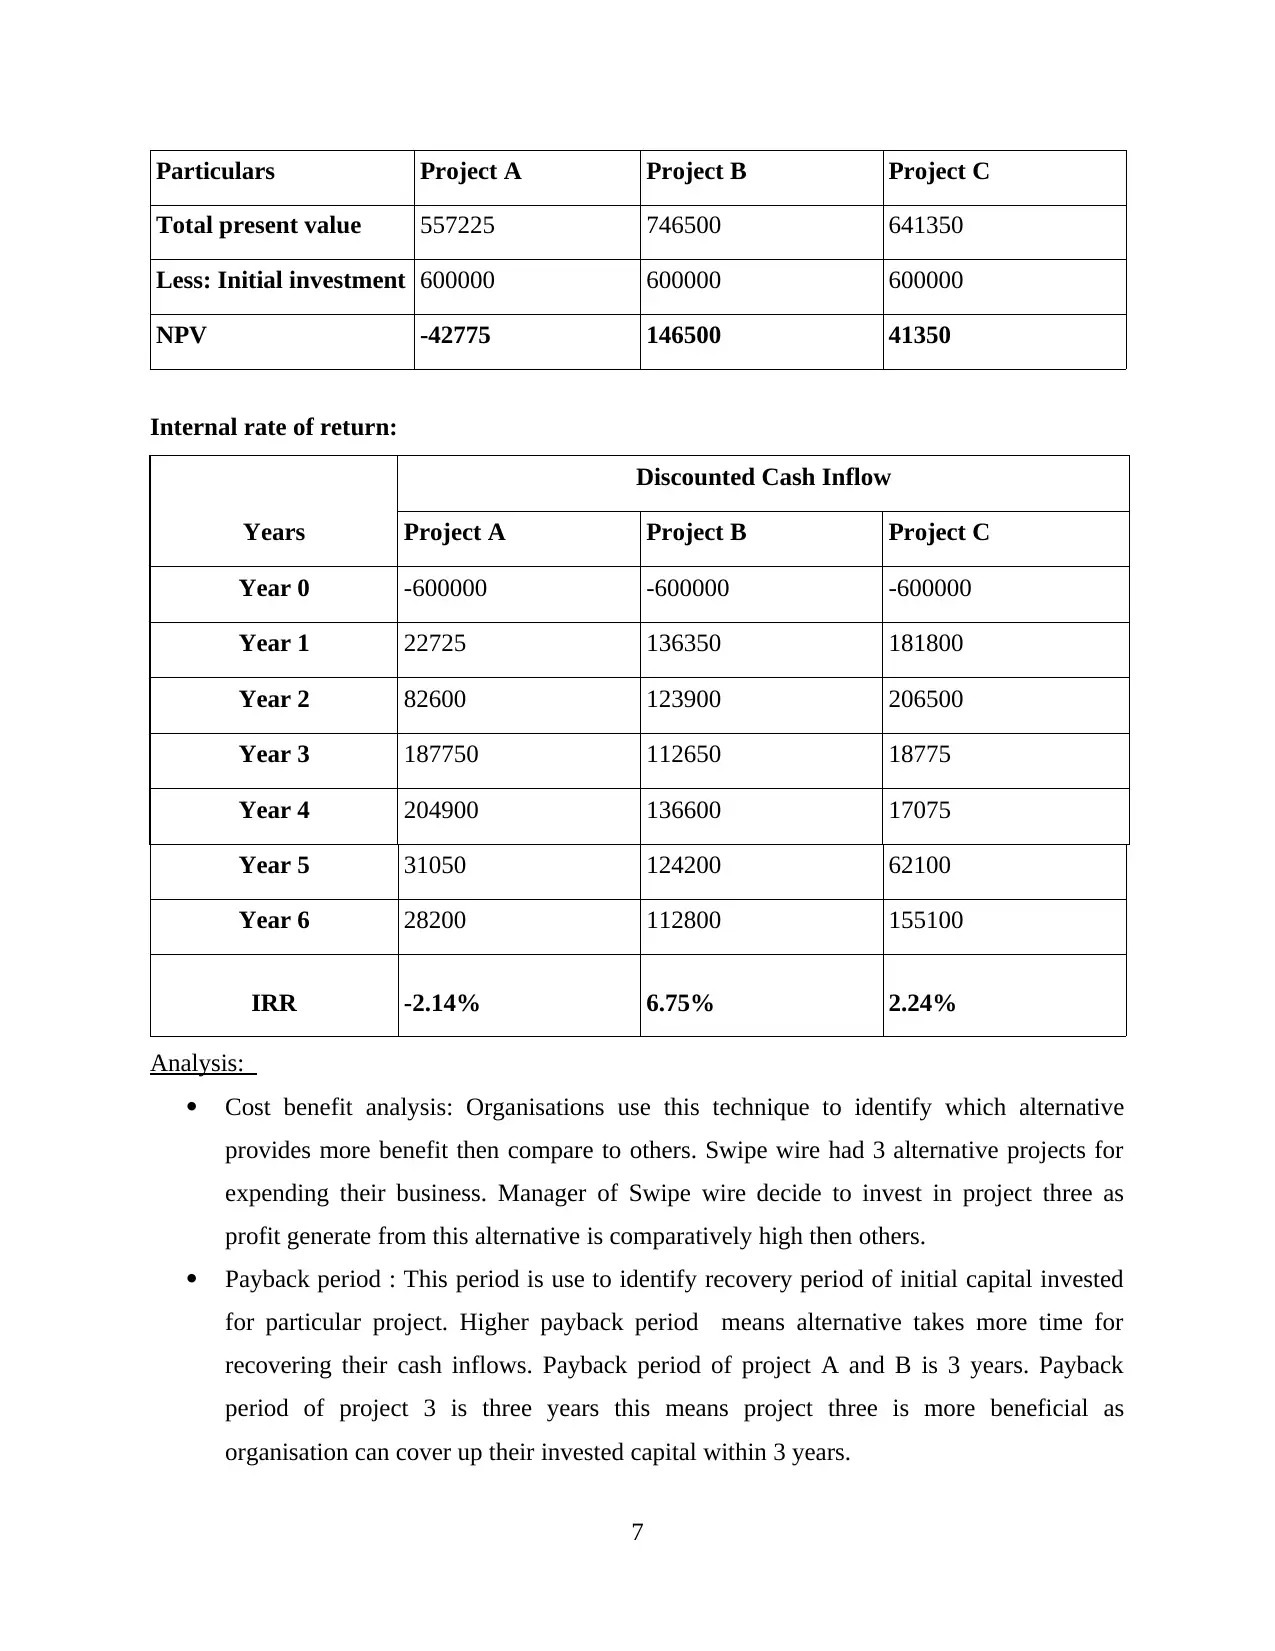
Particulars Project A Project B Project C
Total present value 557225 746500 641350
Less: Initial investment 600000 600000 600000
NPV -42775 146500 41350
Internal rate of return:
Years
Discounted Cash Inflow
Project A Project B Project C
Year 0 -600000 -600000 -600000
Year 1 22725 136350 181800
Year 2 82600 123900 206500
Year 3 187750 112650 18775
Year 4 204900 136600 17075
Year 5 31050 124200 62100
Year 6 28200 112800 155100
IRR -2.14% 6.75% 2.24%
Analysis:
Cost benefit analysis: Organisations use this technique to identify which alternative
provides more benefit then compare to others. Swipe wire had 3 alternative projects for
expending their business. Manager of Swipe wire decide to invest in project three as
profit generate from this alternative is comparatively high then others.
Payback period : This period is use to identify recovery period of initial capital invested
for particular project. Higher payback period means alternative takes more time for
recovering their cash inflows. Payback period of project A and B is 3 years. Payback
period of project 3 is three years this means project three is more beneficial as
organisation can cover up their invested capital within 3 years.
7
Paraphrase This Document
Need a fresh take? Get an instant paraphrase of this document with our AI Paraphraser
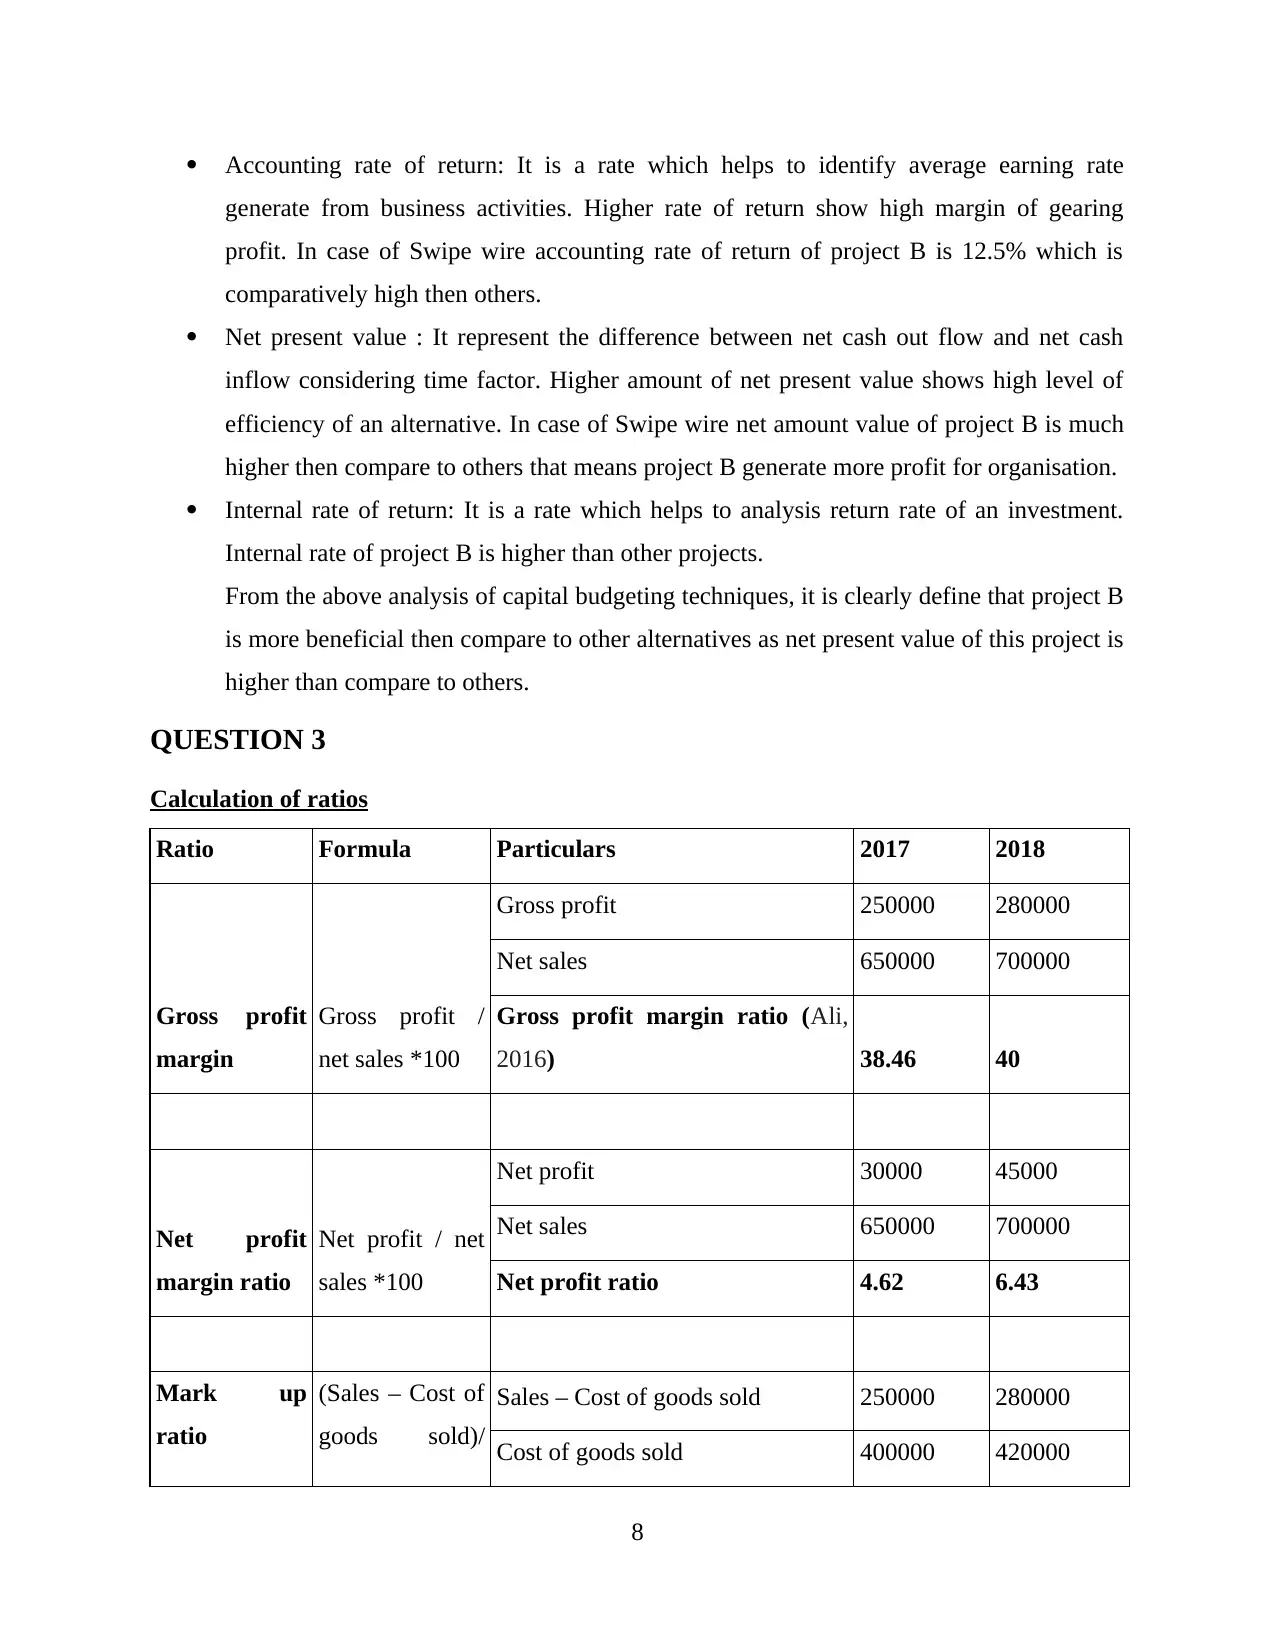
Accounting rate of return: It is a rate which helps to identify average earning rate
generate from business activities. Higher rate of return show high margin of gearing
profit. In case of Swipe wire accounting rate of return of project B is 12.5% which is
comparatively high then others.
Net present value : It represent the difference between net cash out flow and net cash
inflow considering time factor. Higher amount of net present value shows high level of
efficiency of an alternative. In case of Swipe wire net amount value of project B is much
higher then compare to others that means project B generate more profit for organisation.
Internal rate of return: It is a rate which helps to analysis return rate of an investment.
Internal rate of project B is higher than other projects.
From the above analysis of capital budgeting techniques, it is clearly define that project B
is more beneficial then compare to other alternatives as net present value of this project is
higher than compare to others.
QUESTION 3
Calculation of ratios
Ratio Formula Particulars 2017 2018
Gross profit
margin
Gross profit /
net sales *100
Gross profit 250000 280000
Net sales 650000 700000
Gross profit margin ratio (Ali,
2016) 38.46 40
Net profit
margin ratio
Net profit / net
sales *100
Net profit 30000 45000
Net sales 650000 700000
Net profit ratio 4.62 6.43
Mark up
ratio
(Sales – Cost of
goods sold)/
Sales – Cost of goods sold 250000 280000
Cost of goods sold 400000 420000
8
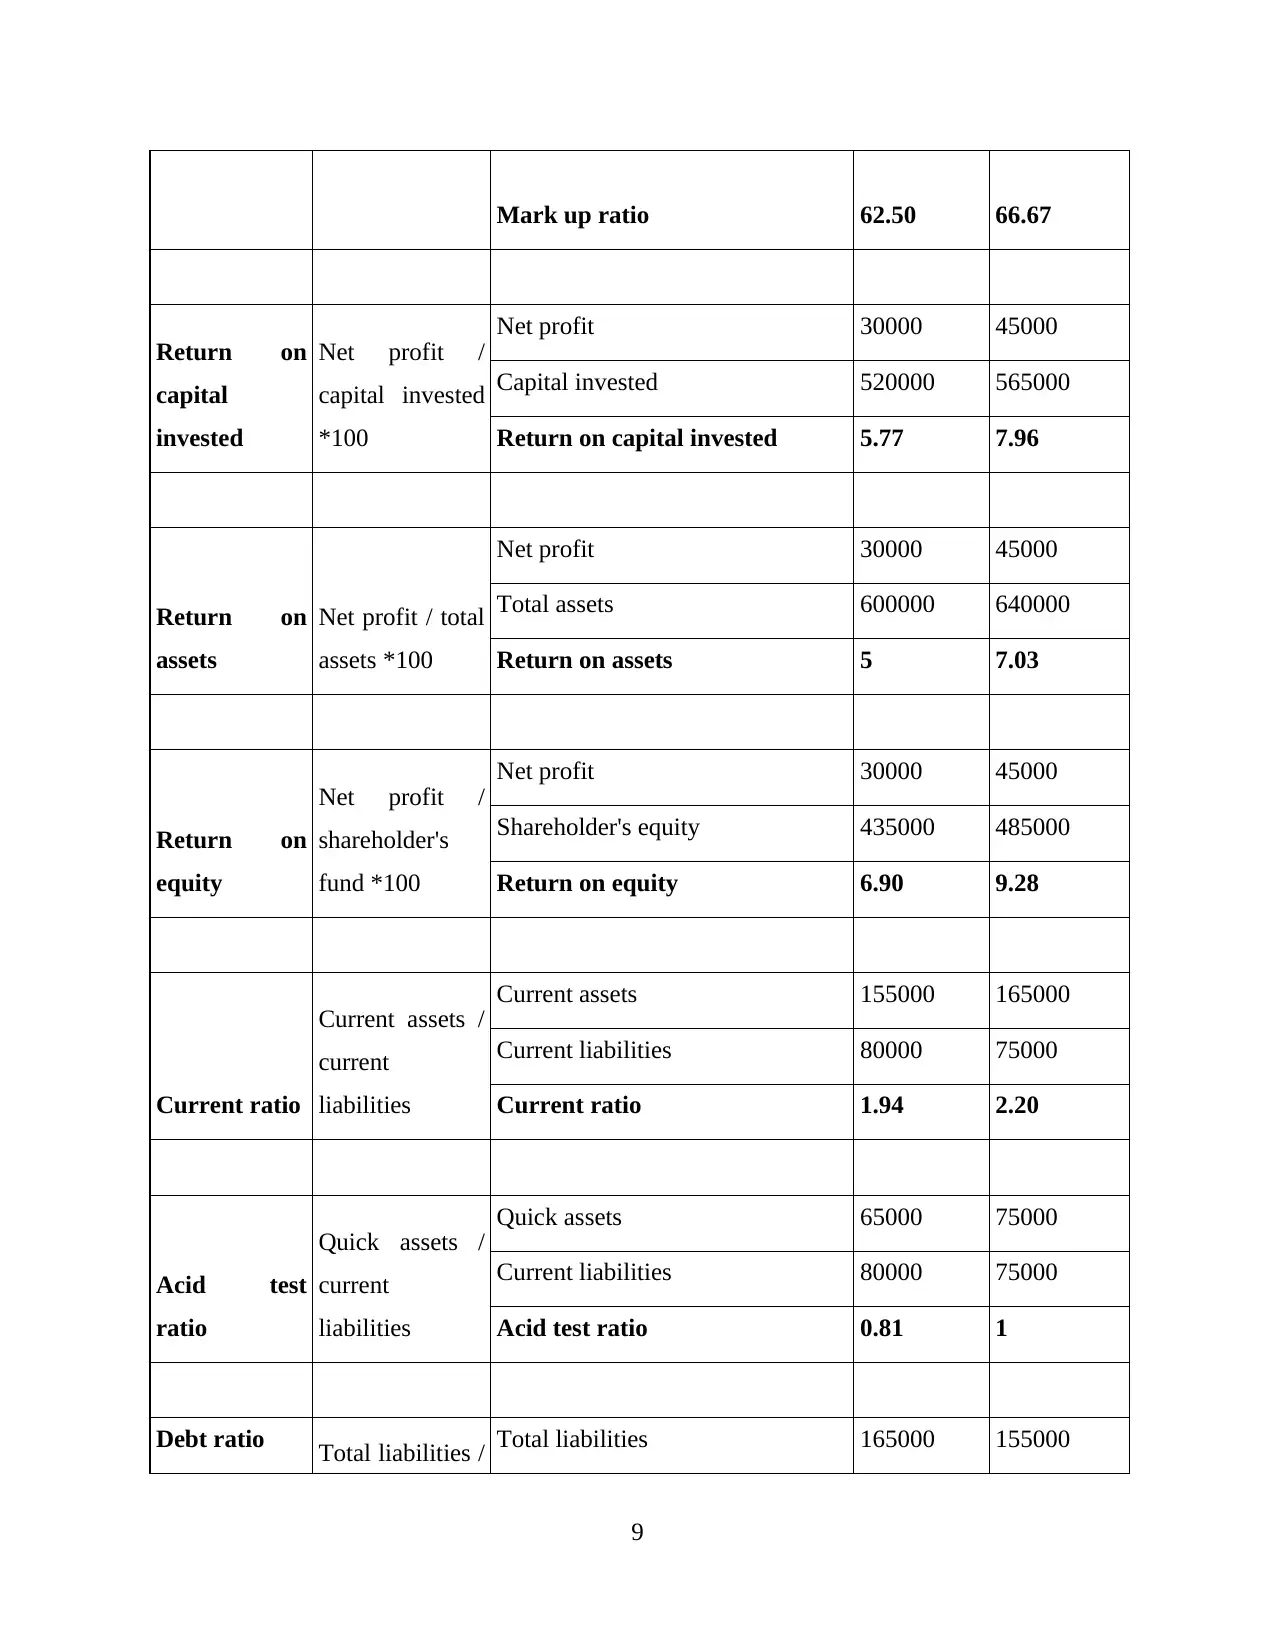
Mark up ratio 62.50 66.67
Return on
capital
invested
Net profit /
capital invested
*100
Net profit 30000 45000
Capital invested 520000 565000
Return on capital invested 5.77 7.96
Return on
assets
Net profit / total
assets *100
Net profit 30000 45000
Total assets 600000 640000
Return on assets 5 7.03
Return on
equity
Net profit /
shareholder's
fund *100
Net profit 30000 45000
Shareholder's equity 435000 485000
Return on equity 6.90 9.28
Current ratio
Current assets /
current
liabilities
Current assets 155000 165000
Current liabilities 80000 75000
Current ratio 1.94 2.20
Acid test
ratio
Quick assets /
current
liabilities
Quick assets 65000 75000
Current liabilities 80000 75000
Acid test ratio 0.81 1
Debt ratio Total liabilities / Total liabilities 165000 155000
9
Return on
capital
invested
Net profit /
capital invested
*100
Net profit 30000 45000
Capital invested 520000 565000
Return on capital invested 5.77 7.96
Return on
assets
Net profit / total
assets *100
Net profit 30000 45000
Total assets 600000 640000
Return on assets 5 7.03
Return on
equity
Net profit /
shareholder's
fund *100
Net profit 30000 45000
Shareholder's equity 435000 485000
Return on equity 6.90 9.28
Current ratio
Current assets /
current
liabilities
Current assets 155000 165000
Current liabilities 80000 75000
Current ratio 1.94 2.20
Acid test
ratio
Quick assets /
current
liabilities
Quick assets 65000 75000
Current liabilities 80000 75000
Acid test ratio 0.81 1
Debt ratio Total liabilities / Total liabilities 165000 155000
9
⊘ This is a preview!⊘
Do you want full access?
Subscribe today to unlock all pages.
Trusted by 1+ million students worldwide
1 out of 14
Related Documents


Your All-in-One AI-Powered Toolkit for Academic Success.
+13062052269
info@desklib.com
Available 24*7 on WhatsApp / Email
![[object Object]](/_next/static/media/star-bottom.7253800d.svg)
Unlock your academic potential
Copyright © 2020–2026 A2Z Services. All Rights Reserved. Developed and managed by ZUCOL.