Comparative Financial Analysis Project: Company Performance

Verified

Added on  2022/12/14

|2
|365
|59
Project
AI Summary
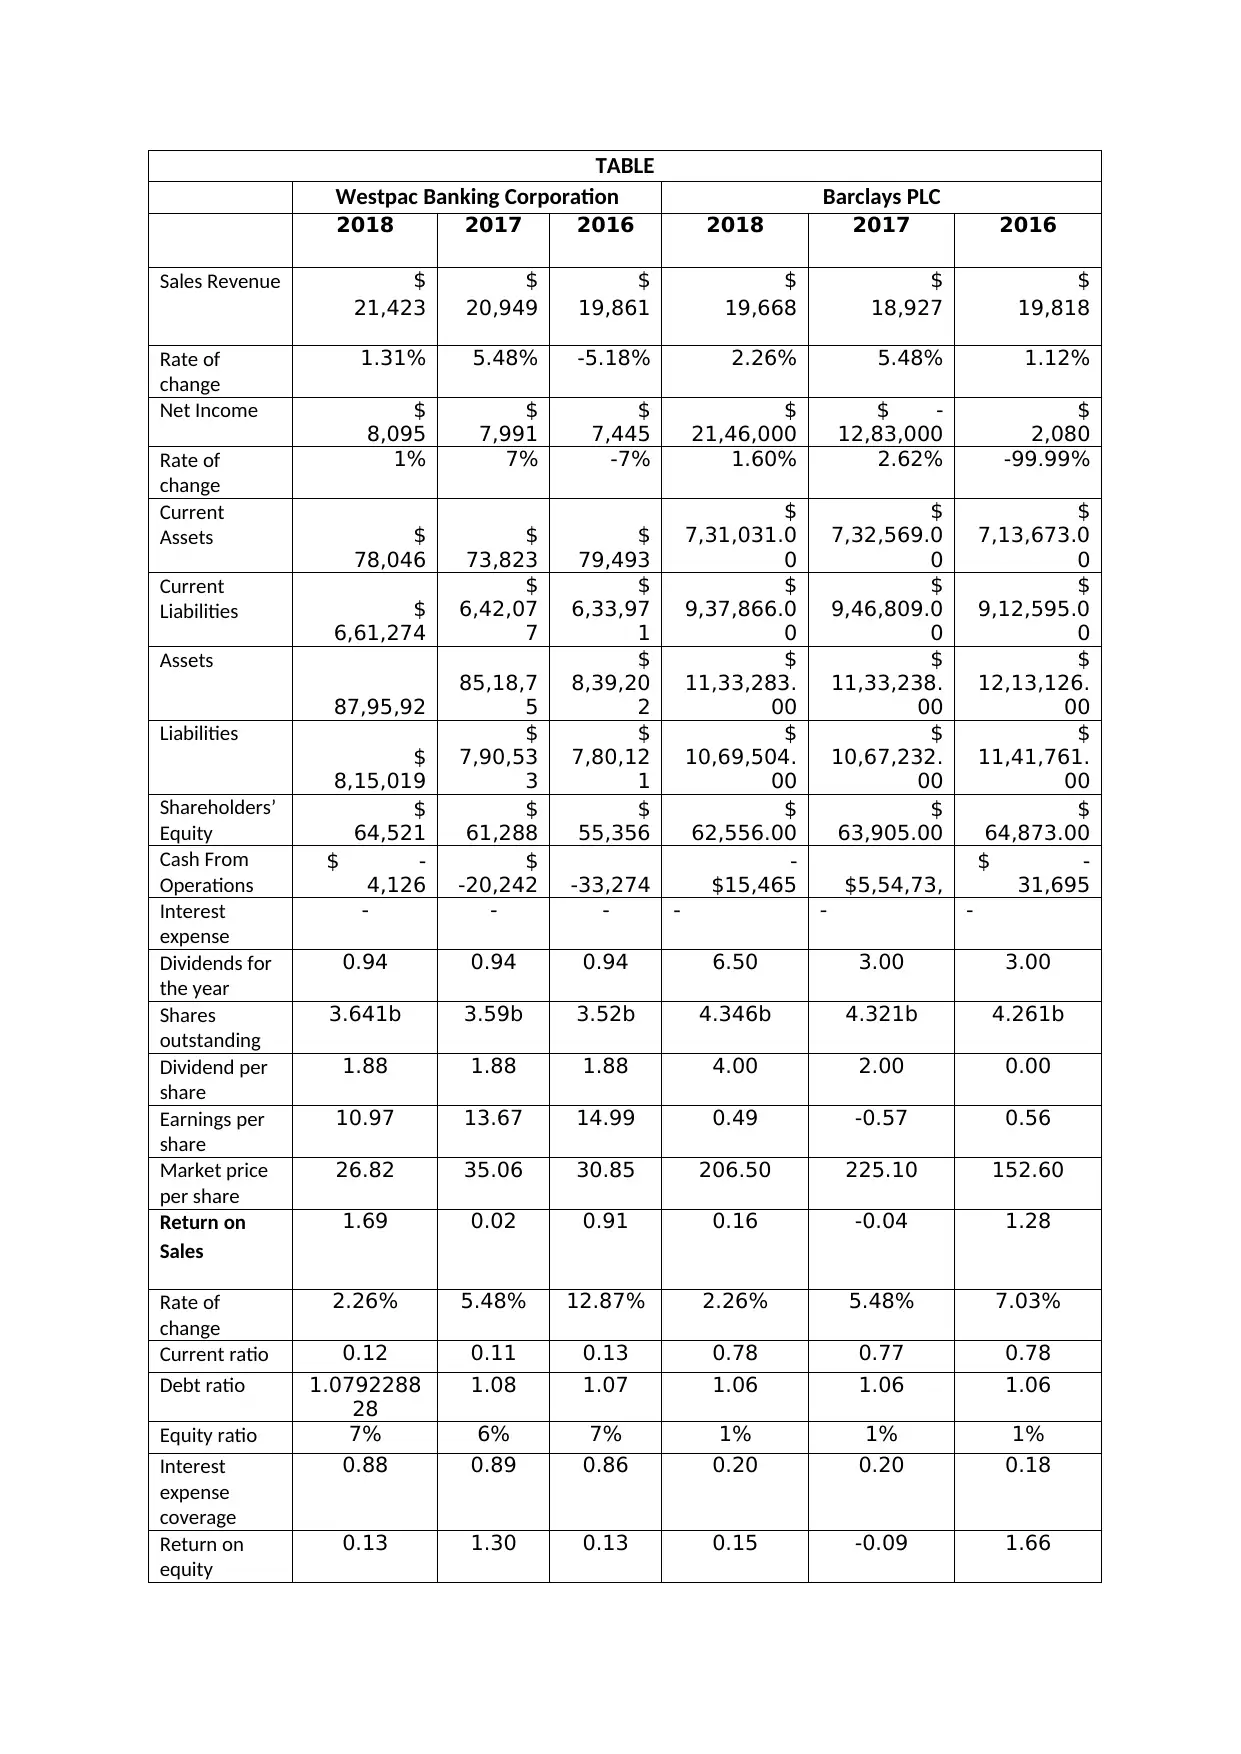
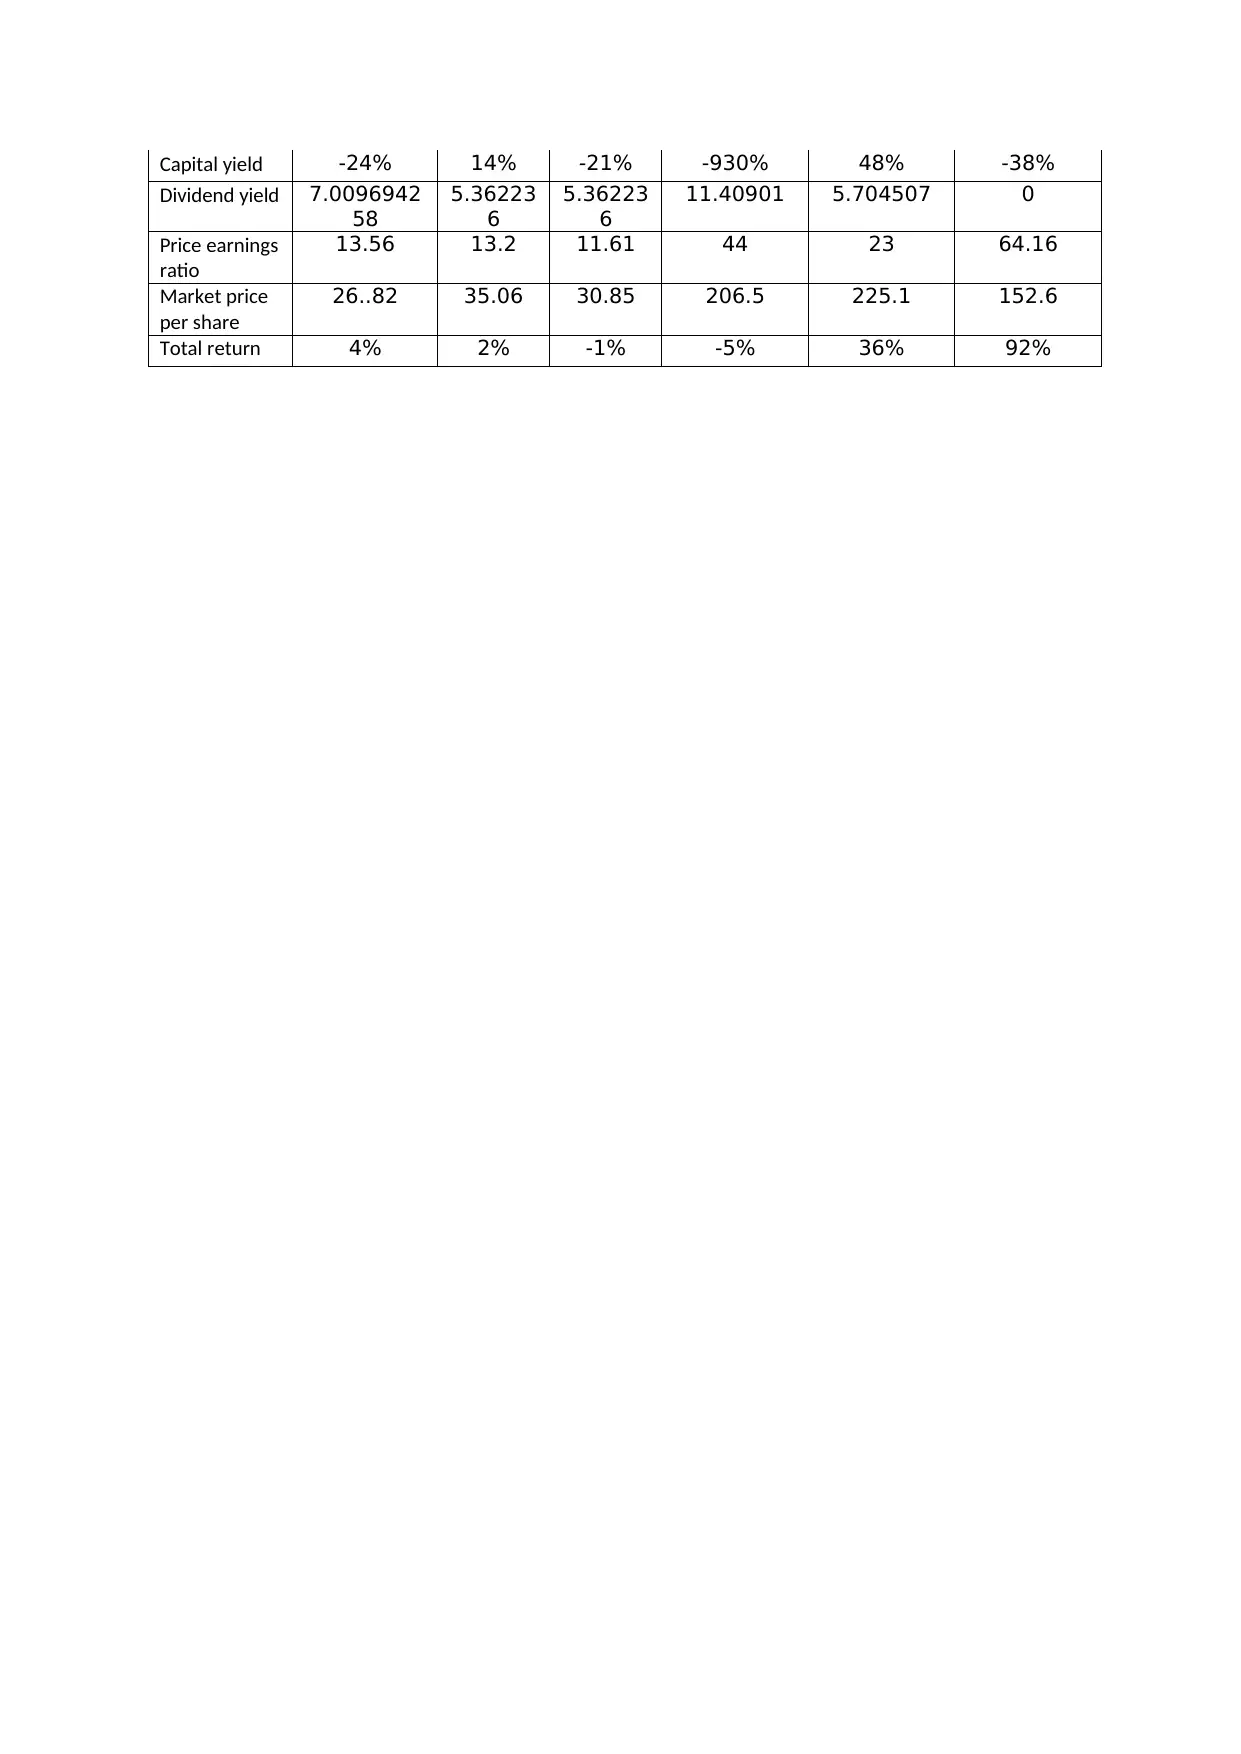
This project analyzes the financial statements of two American companies within the same sector, comparing their performance over a three-year period. The analysis includes an introductory overview of the companies, their sector, and the competitive landscape. It examines the share market price and its year-over-year rate of change for each company over ten years, calculating the average annual increase. Furthermore, the project delves into the companies' financial ratios, including profitability, liquidity, and solvency, comparing their trends and offering insightful comments on the results. The data is presented in tables and charts, providing a comprehensive assessment of the companies' financial situations and performance. The data provided includes the sales revenue, net income, current assets, current liabilities, assets equity ratio, interest expense, and more. The project also includes analysis of cash flow, dividends, earnings per share, and market price per share, with calculations for various ratios like return on sales, equity, capital yield, dividend yield, price earnings ratio, and total return.
tabler-icon-diamond-filled.svg

Contribute Materials

Your contribution can guide someone’s learning journey. Share your documents today.
Document Page
TABLE
Westpac Banking Corporation Barclays PLC
2018 2017 2016 2018 2017 2016
Sales Revenue $
21,423
$
20,949
$
19,861
$
19,668
$
18,927
$
19,818
Rate of
change
1.31% 5.48% -5.18% 2.26% 5.48% 1.12%
Net Income $
8,095
$
7,991
$
7,445
$
21,46,000
$ -
12,83,000
$
2,080
Rate of
change
1% 7% -7% 1.60% 2.62% -99.99%
Current
Assets $
78,046
$
73,823
$
79,493
$
7,31,031.0
0
$
7,32,569.0
0
$
7,13,673.0
0
Current
Liabilities $
6,61,274
$
6,42,07
7
$
6,33,97
1
$
9,37,866.0
0
$
9,46,809.0
0
$
9,12,595.0
0
Assets
87,95,92
85,18,7
5
$
8,39,20
2
$
11,33,283.
00
$
11,33,238.
00
$
12,13,126.
00
Liabilities
$
8,15,019
$
7,90,53
3
$
7,80,12
1
$
10,69,504.
00
$
10,67,232.
00
$
11,41,761.
00
Shareholders’
Equity
$
64,521
$
61,288
$
55,356
$
62,556.00
$
63,905.00
$
64,873.00
Cash From
Operations
$ -
4,126
$
-20,242 -33,274
-
$15,465 $5,54,73,
$ -
31,695
Interest
expense
- - - - - -
Dividends for
the year
0.94 0.94 0.94 6.50 3.00 3.00
Shares
outstanding
3.641b 3.59b 3.52b 4.346b 4.321b 4.261b
Dividend per
share
1.88 1.88 1.88 4.00 2.00 0.00
Earnings per
share
10.97 13.67 14.99 0.49 -0.57 0.56
Market price
per share
26.82 35.06 30.85 206.50 225.10 152.60
Return on
Sales
1.69 0.02 0.91 0.16 -0.04 1.28
Rate of
change
2.26% 5.48% 12.87% 2.26% 5.48% 7.03%
Current ratio 0.12 0.11 0.13 0.78 0.77 0.78
Debt ratio 1.0792288
28
1.08 1.07 1.06 1.06 1.06
Equity ratio 7% 6% 7% 1% 1% 1%
Interest
expense
coverage
0.88 0.89 0.86 0.20 0.20 0.18
Return on
equity
0.13 1.30 0.13 0.15 -0.09 1.66
tabler-icon-diamond-filled.svg

Secure Best Marks with AI Grader

Need help grading? Try our AI Grader for instant feedback on your assignments.
Document Page
Capital yield -24% 14% -21% -930% 48% -38%
Dividend yield 7.0096942
58
5.36223
6
5.36223
6
11.40901 5.704507 0
Price earnings
ratio
13.56 13.2 11.61 44 23 64.16
Market price
per share
26..82 35.06 30.85 206.5 225.1 152.6
Total return 4% 2% -1% -5% 36% 92%
chevron_up_icon
1 out of 2
circle_padding
hide_on_mobile
zoom_out_icon
logo.png

Your All-in-One AI-Powered Toolkit for Academic Success.

Available 24*7 on WhatsApp / Email

[object Object]