HI5002 Finance Project: Financial Performance of Two Companies
VerifiedAdded on 2023/06/04
|21
|5098
|174
Report
AI Summary
This finance project report analyzes the financial performance of Australian Pharmaceuticals Limited and ANSELL Limited, two ASX-listed companies. The report examines the companies' descriptions, including their history and core activities. It then evaluates their performance using profitability ratios (return on sales, assets, and equity), liquidity ratios (current and quick ratios), and capital structure ratios (debt ratio and financial leverage). The analysis includes a comparison of the companies' monthly share prices, significant factors affecting stock prices, beta values, CAPM, and dividend policies. The report concludes with a letter of recommendation, summarizing the investment potential of the companies based on the financial analysis conducted. The study utilizes financial statements and market data to provide a comprehensive assessment of the companies' financial health and investment prospects.

Running Head: Finance
1
Project Report: Finance
1
Project Report: Finance
Paraphrase This Document
Need a fresh take? Get an instant paraphrase of this document with our AI Paraphraser
Running Head: Finance
2
Contents
Introduction.......................................................................................................................3
1. Description of companies........................................................................................3
1.1. Australian pharmaceuticals limited..................................................................3
1.2. ANSELL limited..............................................................................................3
2. Performance ratio evaluation and comparison.........................................................4
2.1. Profitability ratios.............................................................................................4
2.2. Liquidity ratios.................................................................................................6
2.3. Capital structure ratios......................................................................................7
3. Monthly share price.................................................................................................8
4. Significant factors....................................................................................................9
5. Beta values and CAPM............................................................................................9
6. Dividend policy......................................................................................................10
7. Letter recommendation..........................................................................................11
References.......................................................................................................................13
Appendix.........................................................................................................................15
Running Head: Finance
3
Introduction:
The financial management process is helpful for the investors, analyst and the internal
stakeholder of the business to recognize the performance of the business in terms of
investment. The process of financial evaluation contains various methods which makes it
easier for the business to identify and evaluate the exact market position and the return level
of the business. In the report, two companies, Australian pharmaceuticals limited and
ANSELL limited has taken into concern to evaluate the investment position in the Australian
market.
The description of history, core activities etc of the companies, performance ratio
evaluation, monthly share price, beta values, CAPM, dividend policies etc of both the
companies have been identified to measure the investment level of the business. In the report,
the various financial analysis and stock analysis tools have been applied on the business to
make it easier for the business to reach over a better conclusion.
1. Description of companies:
1.1. Australian pharmaceuticals limited:
“Australian pharmaceuticals industries” is a pharmaceuticals company which offers
the healthy and beauty products in the Australian market. The company is involved in
manufacturing and retailing the pharmaceuticals products and the health and beauty products
in the Australian market. It is amongst the largest wholesale distributor pharmaceutical
company in the Australian market. The company retails its products through its own retail
store and the franchise, the main brands of the company includes Priceline pharmacy,
Priceline, soul pattinson and pharmacists advice (Home, 2018). The company has been
founded in 1971.
1.2. ANSELL limited:
Australian limited is a pharmaceuticals company which offers the pharmaceutical
solutions in the Australian market. The company is involved in manufacturing and retailing
the pharmaceuticals products such as protective industrial gloves, condoms etc in the
Australian market. The company retails its products through its delivering it to pharmacist
and through the retail stores in the Australian market (Home, 2018). The company has been
founded in 1893.
⊘ This is a preview!⊘
Do you want full access?
Subscribe today to unlock all pages.
Trusted by 1+ million students worldwide
Running Head: Finance
4
The main competitive advantage of both the companies is highest share market in
their own products and the market performance of both the companies is improving rapidly.
2. Performance ratio evaluation and comparison:
The performance ratio study has been performed on both the companies to measure the
performance and the various financial positions of both the business. Performance ratio is a
financial evaluation study in which the income statement, balance sheet and cash flow
statement are evaluated and the main information are collected from the financial statement
to measure the various position of the business such as liquidity, long term solvency,
profitability etc positions (Madura, 2014). In case of Australian pharmaceuticals industries
and Ansell limited, the performance ratio calculations and the evaluation are as follows:
2.1. Profitability ratios:
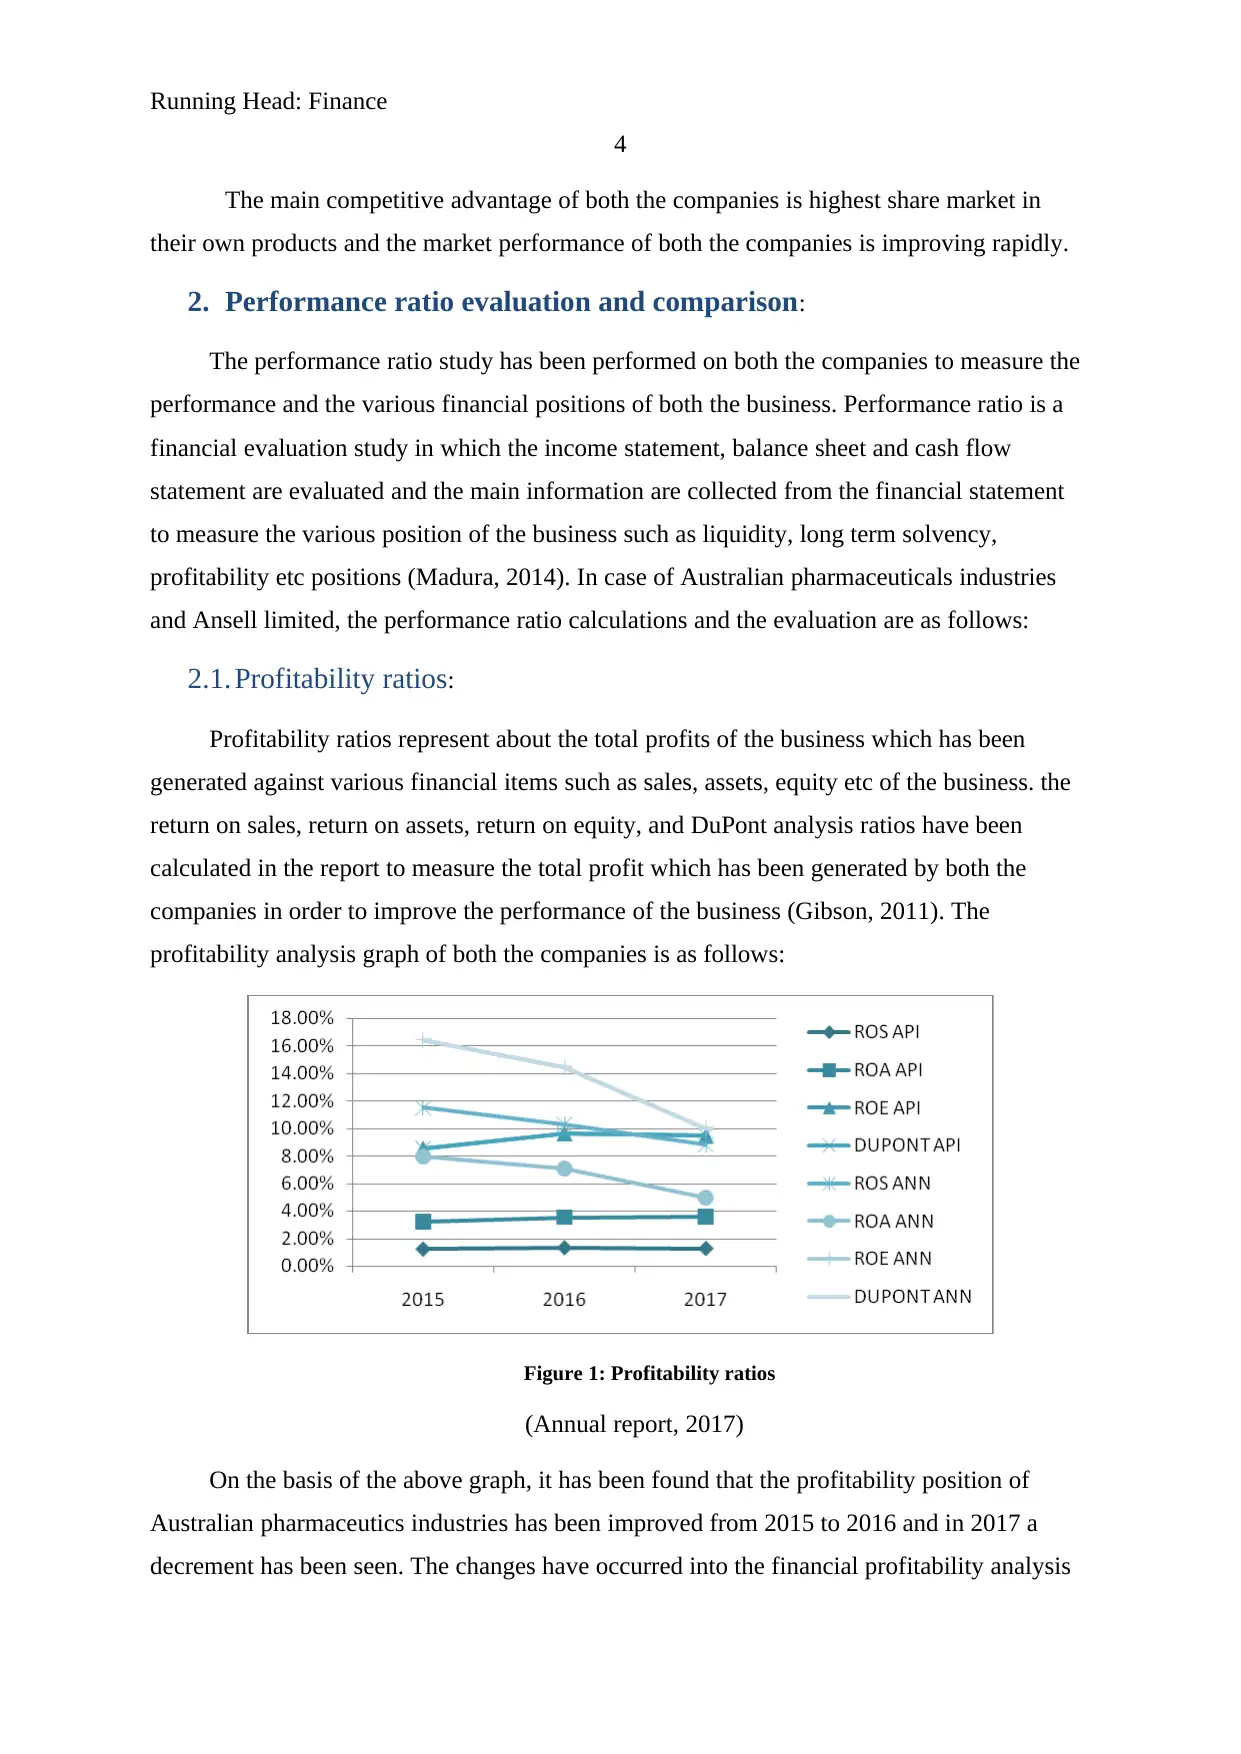
Profitability ratios represent about the total profits of the business which has been
generated against various financial items such as sales, assets, equity etc of the business. the
return on sales, return on assets, return on equity, and DuPont analysis ratios have been
calculated in the report to measure the total profit which has been generated by both the
companies in order to improve the performance of the business (Gibson, 2011). The
profitability analysis graph of both the companies is as follows:
Figure 1: Profitability ratios
(Annual report, 2017)
On the basis of the above graph, it has been found that the profitability position of
Australian pharmaceutics industries has been improved from 2015 to 2016 and in 2017 a
decrement has been seen. The changes have occurred into the financial profitability analysis
4
The main competitive advantage of both the companies is highest share market in
their own products and the market performance of both the companies is improving rapidly.
2. Performance ratio evaluation and comparison:
The performance ratio study has been performed on both the companies to measure the
performance and the various financial positions of both the business. Performance ratio is a
financial evaluation study in which the income statement, balance sheet and cash flow
statement are evaluated and the main information are collected from the financial statement
to measure the various position of the business such as liquidity, long term solvency,
profitability etc positions (Madura, 2014). In case of Australian pharmaceuticals industries
and Ansell limited, the performance ratio calculations and the evaluation are as follows:
2.1. Profitability ratios:
Profitability ratios represent about the total profits of the business which has been
generated against various financial items such as sales, assets, equity etc of the business. the
return on sales, return on assets, return on equity, and DuPont analysis ratios have been
calculated in the report to measure the total profit which has been generated by both the
companies in order to improve the performance of the business (Gibson, 2011). The
profitability analysis graph of both the companies is as follows:
Figure 1: Profitability ratios
(Annual report, 2017)
On the basis of the above graph, it has been found that the profitability position of
Australian pharmaceutics industries has been improved from 2015 to 2016 and in 2017 a
decrement has been seen. The changes have occurred into the financial profitability analysis
Paraphrase This Document
Need a fresh take? Get an instant paraphrase of this document with our AI Paraphraser
Running Head: Finance
5
because of the various economical and industrial factors. The changes and the evaluation on
company explain that the profitability position of the company would be improved much in
the near future (Annual report, 2017).
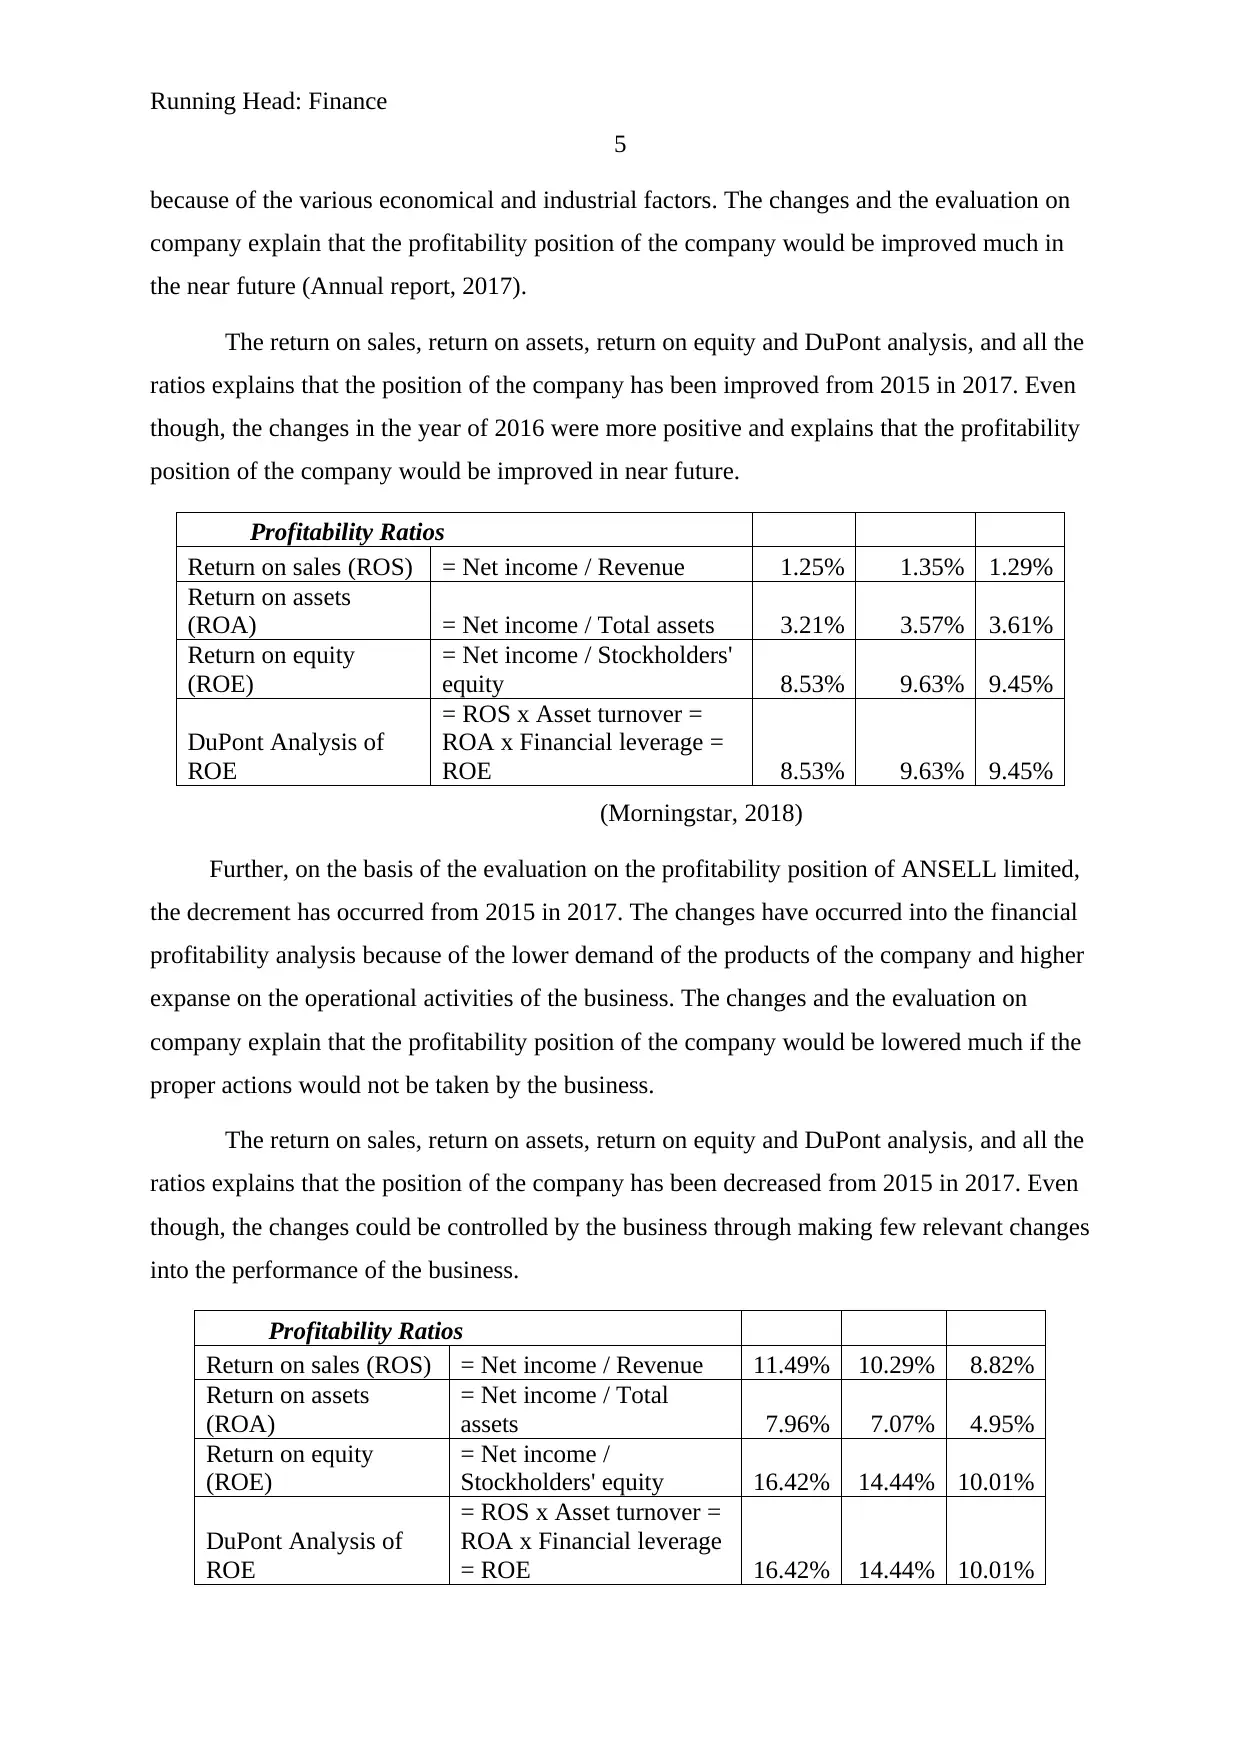
The return on sales, return on assets, return on equity and DuPont analysis, and all the
ratios explains that the position of the company has been improved from 2015 in 2017. Even
though, the changes in the year of 2016 were more positive and explains that the profitability
position of the company would be improved in near future.
Profitability Ratios
Return on sales (ROS) = Net income / Revenue 1.25% 1.35% 1.29%
Return on assets
(ROA) = Net income / Total assets 3.21% 3.57% 3.61%
Return on equity
(ROE)
= Net income / Stockholders'
equity 8.53% 9.63% 9.45%
DuPont Analysis of
ROE
= ROS x Asset turnover =
ROA x Financial leverage =
ROE 8.53% 9.63% 9.45%
(Morningstar, 2018)
Further, on the basis of the evaluation on the profitability position of ANSELL limited,
the decrement has occurred from 2015 in 2017. The changes have occurred into the financial
profitability analysis because of the lower demand of the products of the company and higher
expanse on the operational activities of the business. The changes and the evaluation on
company explain that the profitability position of the company would be lowered much if the
proper actions would not be taken by the business.
The return on sales, return on assets, return on equity and DuPont analysis, and all the
ratios explains that the position of the company has been decreased from 2015 in 2017. Even
though, the changes could be controlled by the business through making few relevant changes
into the performance of the business.
Profitability Ratios
Return on sales (ROS) = Net income / Revenue 11.49% 10.29% 8.82%
Return on assets
(ROA)
= Net income / Total
assets 7.96% 7.07% 4.95%
Return on equity
(ROE)
= Net income /
Stockholders' equity 16.42% 14.44% 10.01%
DuPont Analysis of
ROE
= ROS x Asset turnover =
ROA x Financial leverage
= ROE 16.42% 14.44% 10.01%
5
because of the various economical and industrial factors. The changes and the evaluation on
company explain that the profitability position of the company would be improved much in
the near future (Annual report, 2017).
The return on sales, return on assets, return on equity and DuPont analysis, and all the
ratios explains that the position of the company has been improved from 2015 in 2017. Even
though, the changes in the year of 2016 were more positive and explains that the profitability
position of the company would be improved in near future.
Profitability Ratios
Return on sales (ROS) = Net income / Revenue 1.25% 1.35% 1.29%
Return on assets
(ROA) = Net income / Total assets 3.21% 3.57% 3.61%
Return on equity
(ROE)
= Net income / Stockholders'
equity 8.53% 9.63% 9.45%
DuPont Analysis of
ROE
= ROS x Asset turnover =
ROA x Financial leverage =
ROE 8.53% 9.63% 9.45%
(Morningstar, 2018)
Further, on the basis of the evaluation on the profitability position of ANSELL limited,
the decrement has occurred from 2015 in 2017. The changes have occurred into the financial
profitability analysis because of the lower demand of the products of the company and higher
expanse on the operational activities of the business. The changes and the evaluation on
company explain that the profitability position of the company would be lowered much if the
proper actions would not be taken by the business.
The return on sales, return on assets, return on equity and DuPont analysis, and all the
ratios explains that the position of the company has been decreased from 2015 in 2017. Even
though, the changes could be controlled by the business through making few relevant changes
into the performance of the business.
Profitability Ratios
Return on sales (ROS) = Net income / Revenue 11.49% 10.29% 8.82%
Return on assets
(ROA)
= Net income / Total
assets 7.96% 7.07% 4.95%
Return on equity
(ROE)
= Net income /
Stockholders' equity 16.42% 14.44% 10.01%
DuPont Analysis of
ROE
= ROS x Asset turnover =
ROA x Financial leverage
= ROE 16.42% 14.44% 10.01%
Running Head: Finance
6
(Morningstar, 2018)
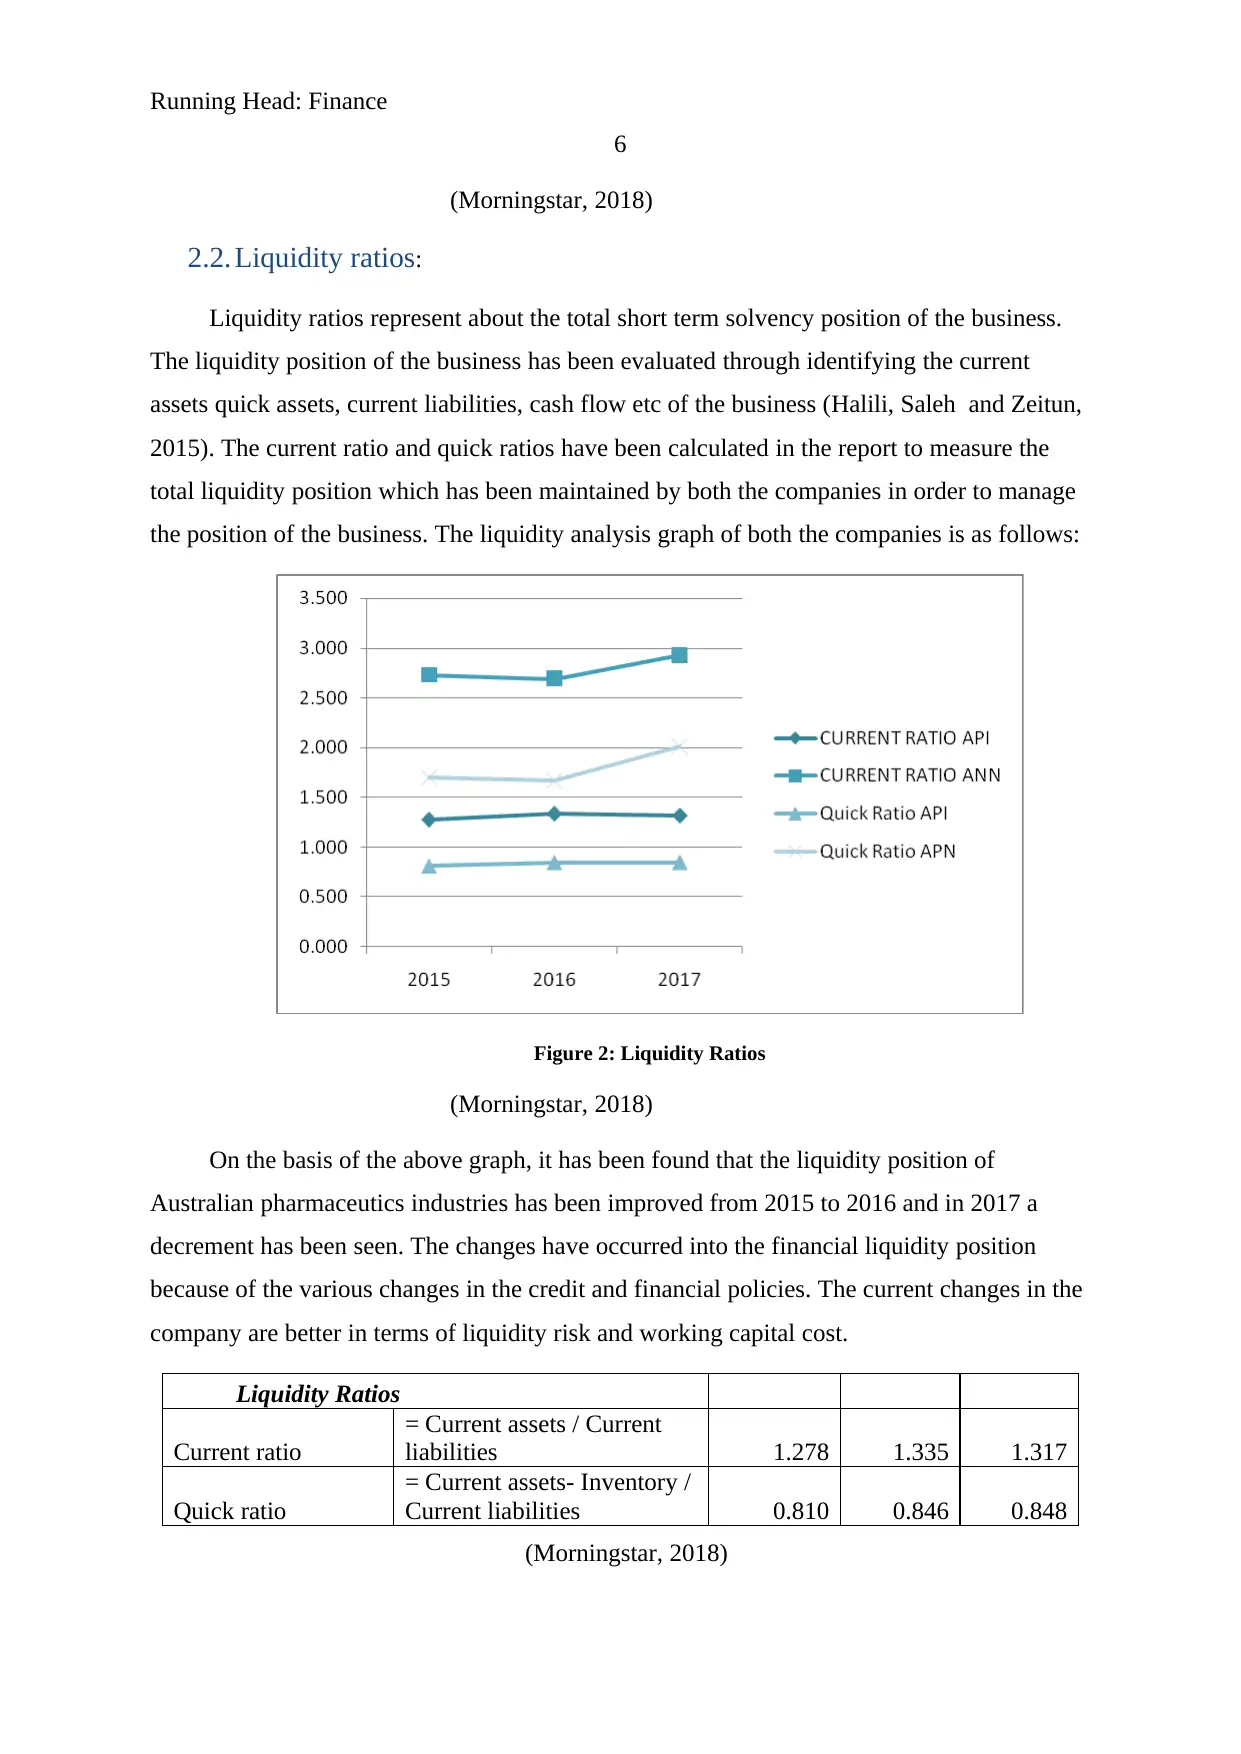
2.2. Liquidity ratios:
Liquidity ratios represent about the total short term solvency position of the business.
The liquidity position of the business has been evaluated through identifying the current
assets quick assets, current liabilities, cash flow etc of the business (Halili, Saleh and Zeitun,
2015). The current ratio and quick ratios have been calculated in the report to measure the
total liquidity position which has been maintained by both the companies in order to manage
the position of the business. The liquidity analysis graph of both the companies is as follows:
Figure 2: Liquidity Ratios
(Morningstar, 2018)
On the basis of the above graph, it has been found that the liquidity position of
Australian pharmaceutics industries has been improved from 2015 to 2016 and in 2017 a
decrement has been seen. The changes have occurred into the financial liquidity position
because of the various changes in the credit and financial policies. The current changes in the
company are better in terms of liquidity risk and working capital cost.
Liquidity Ratios
Current ratio
= Current assets / Current
liabilities 1.278 1.335 1.317
Quick ratio
= Current assets- Inventory /
Current liabilities 0.810 0.846 0.848
(Morningstar, 2018)
6
(Morningstar, 2018)
2.2. Liquidity ratios:
Liquidity ratios represent about the total short term solvency position of the business.
The liquidity position of the business has been evaluated through identifying the current
assets quick assets, current liabilities, cash flow etc of the business (Halili, Saleh and Zeitun,
2015). The current ratio and quick ratios have been calculated in the report to measure the
total liquidity position which has been maintained by both the companies in order to manage
the position of the business. The liquidity analysis graph of both the companies is as follows:
Figure 2: Liquidity Ratios
(Morningstar, 2018)
On the basis of the above graph, it has been found that the liquidity position of
Australian pharmaceutics industries has been improved from 2015 to 2016 and in 2017 a
decrement has been seen. The changes have occurred into the financial liquidity position
because of the various changes in the credit and financial policies. The current changes in the
company are better in terms of liquidity risk and working capital cost.
Liquidity Ratios
Current ratio
= Current assets / Current
liabilities 1.278 1.335 1.317
Quick ratio
= Current assets- Inventory /
Current liabilities 0.810 0.846 0.848
(Morningstar, 2018)
⊘ This is a preview!⊘
Do you want full access?
Subscribe today to unlock all pages.
Trusted by 1+ million students worldwide
Running Head: Finance
7
The below table of Ansell limited’s liquidity position explains that the changes have
been seen in the liquidity analysis of the company. The table represent that the position has
been improved in 2017. Though, the current changes in the company are higher in terms of
working capital cost and company lower it to improve the position.
Liquidity Ratios
Current ratio
= Current assets / Current
liabilities 2.727 2.690 2.924
Quick ratio
= Current assets- Inventory /
Current liabilities 1.695 1.664 2.009
(Morningstar, 2018)
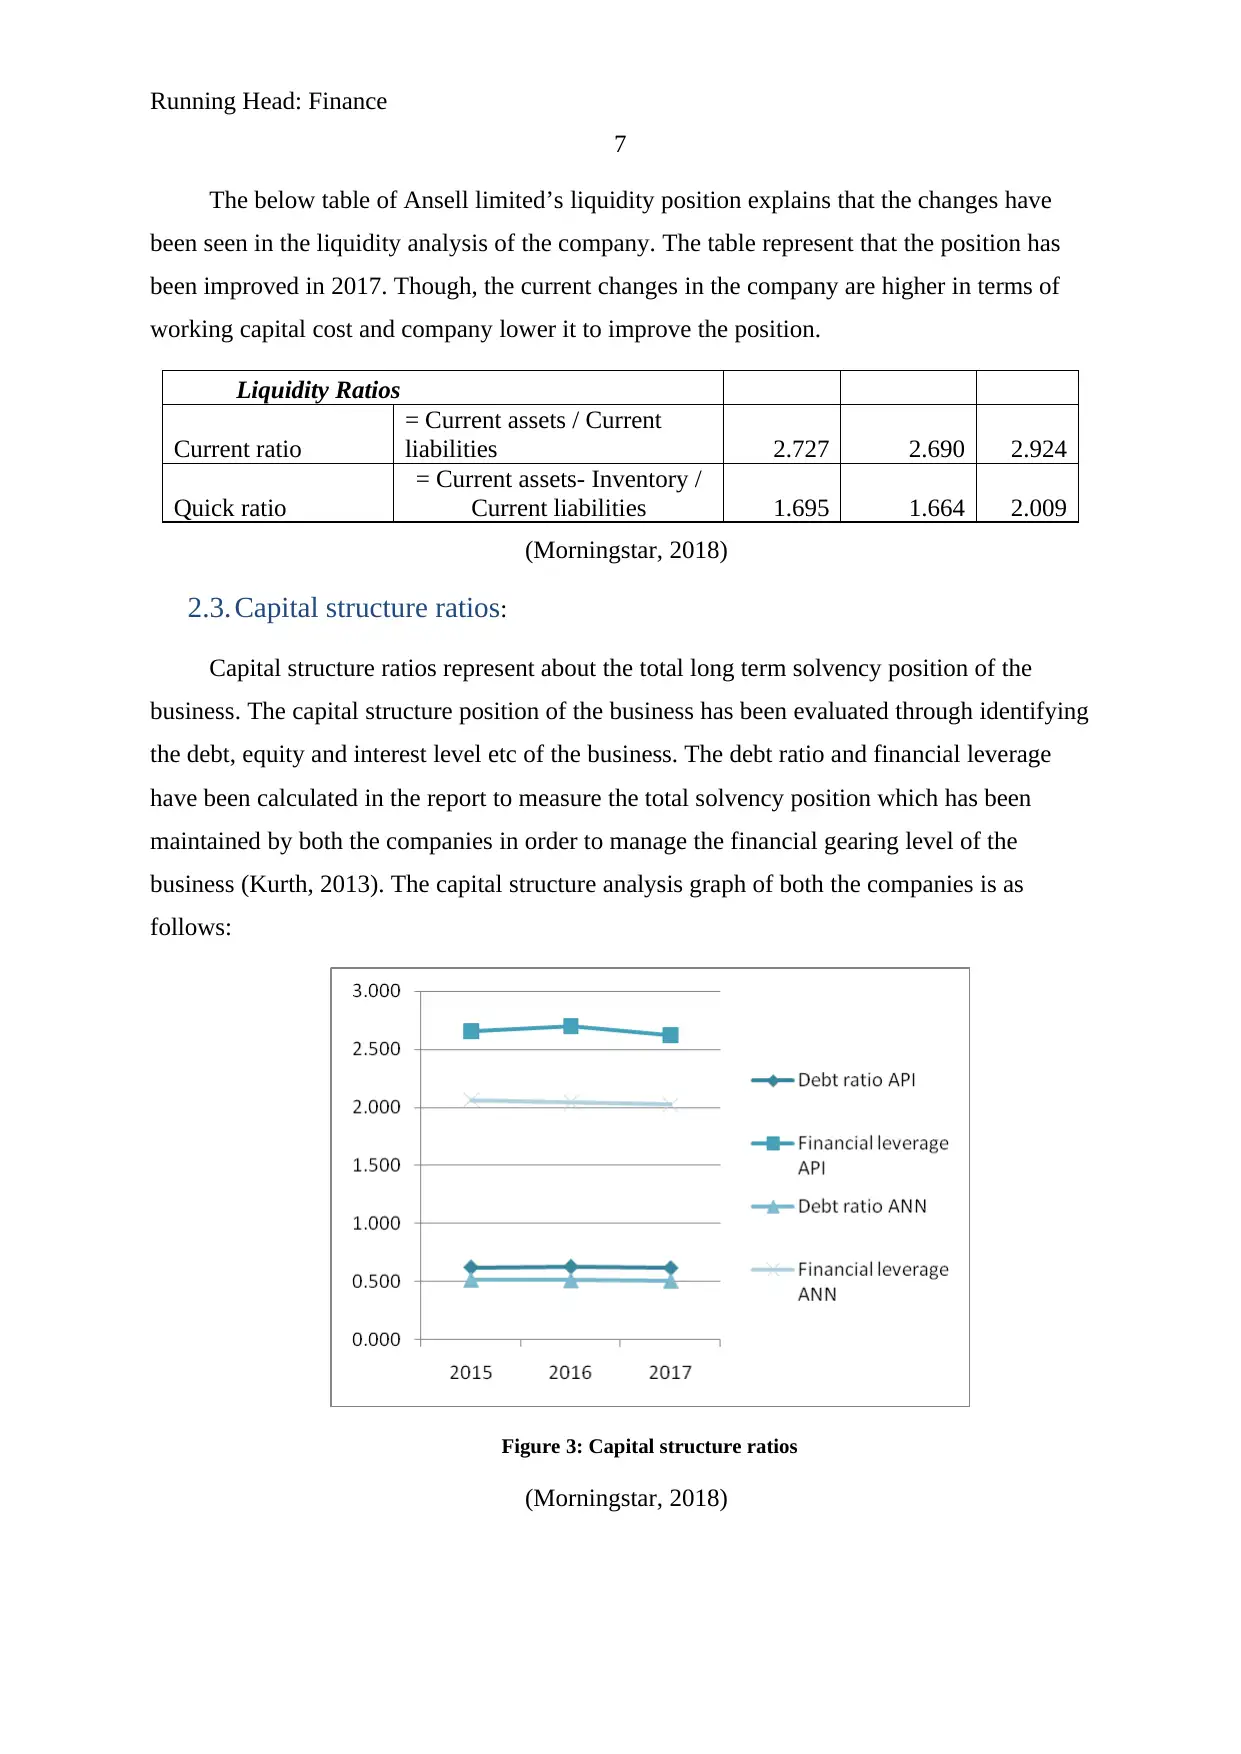
2.3. Capital structure ratios:
Capital structure ratios represent about the total long term solvency position of the
business. The capital structure position of the business has been evaluated through identifying
the debt, equity and interest level etc of the business. The debt ratio and financial leverage
have been calculated in the report to measure the total solvency position which has been
maintained by both the companies in order to manage the financial gearing level of the
business (Kurth, 2013). The capital structure analysis graph of both the companies is as
follows:
Figure 3: Capital structure ratios
(Morningstar, 2018)
7
The below table of Ansell limited’s liquidity position explains that the changes have
been seen in the liquidity analysis of the company. The table represent that the position has
been improved in 2017. Though, the current changes in the company are higher in terms of
working capital cost and company lower it to improve the position.
Liquidity Ratios
Current ratio
= Current assets / Current
liabilities 2.727 2.690 2.924
Quick ratio
= Current assets- Inventory /
Current liabilities 1.695 1.664 2.009
(Morningstar, 2018)
2.3. Capital structure ratios:
Capital structure ratios represent about the total long term solvency position of the
business. The capital structure position of the business has been evaluated through identifying
the debt, equity and interest level etc of the business. The debt ratio and financial leverage
have been calculated in the report to measure the total solvency position which has been
maintained by both the companies in order to manage the financial gearing level of the
business (Kurth, 2013). The capital structure analysis graph of both the companies is as
follows:
Figure 3: Capital structure ratios
(Morningstar, 2018)
Paraphrase This Document
Need a fresh take? Get an instant paraphrase of this document with our AI Paraphraser
Running Head: Finance
8
On the basis of the above graph, it has been found that the solvency position of
Australian pharmaceutics industries has been improved from 2015 to 2016 and in 2017 a
decrement has been seen (Morningstar, 2018). The changes have occurred into the solvency
position because of the various changes in the credit and financial policies. The current
changes in the company are better in terms of financial gearing level and cost.
Long-term Solvency ratios
Debt ratio
= Total liabilities /
Total assets 0.624 0.630 0.618
Financial leverage
= Total assets / Total
equity 2.656 2.700 2.618
(Morningstar, 2018)
Further, on the basis of the above graph, it has been found that the solvency position of
Ansell limited has been lowered from 2015 to 2017. A decrement has been seen into the
solvency position because of the various changes in the credit and financial policies. The
current changes in the company are required to become better in terms of financial gearing
level and cost.
Long-term Solvency ratios
Debt ratio
= Total liabilities / Total
assets 0.515 0.511 0.506
Financial leverage = Total assets / Total equity 2.063 2.043 2.024
(Morningstar, 2018)
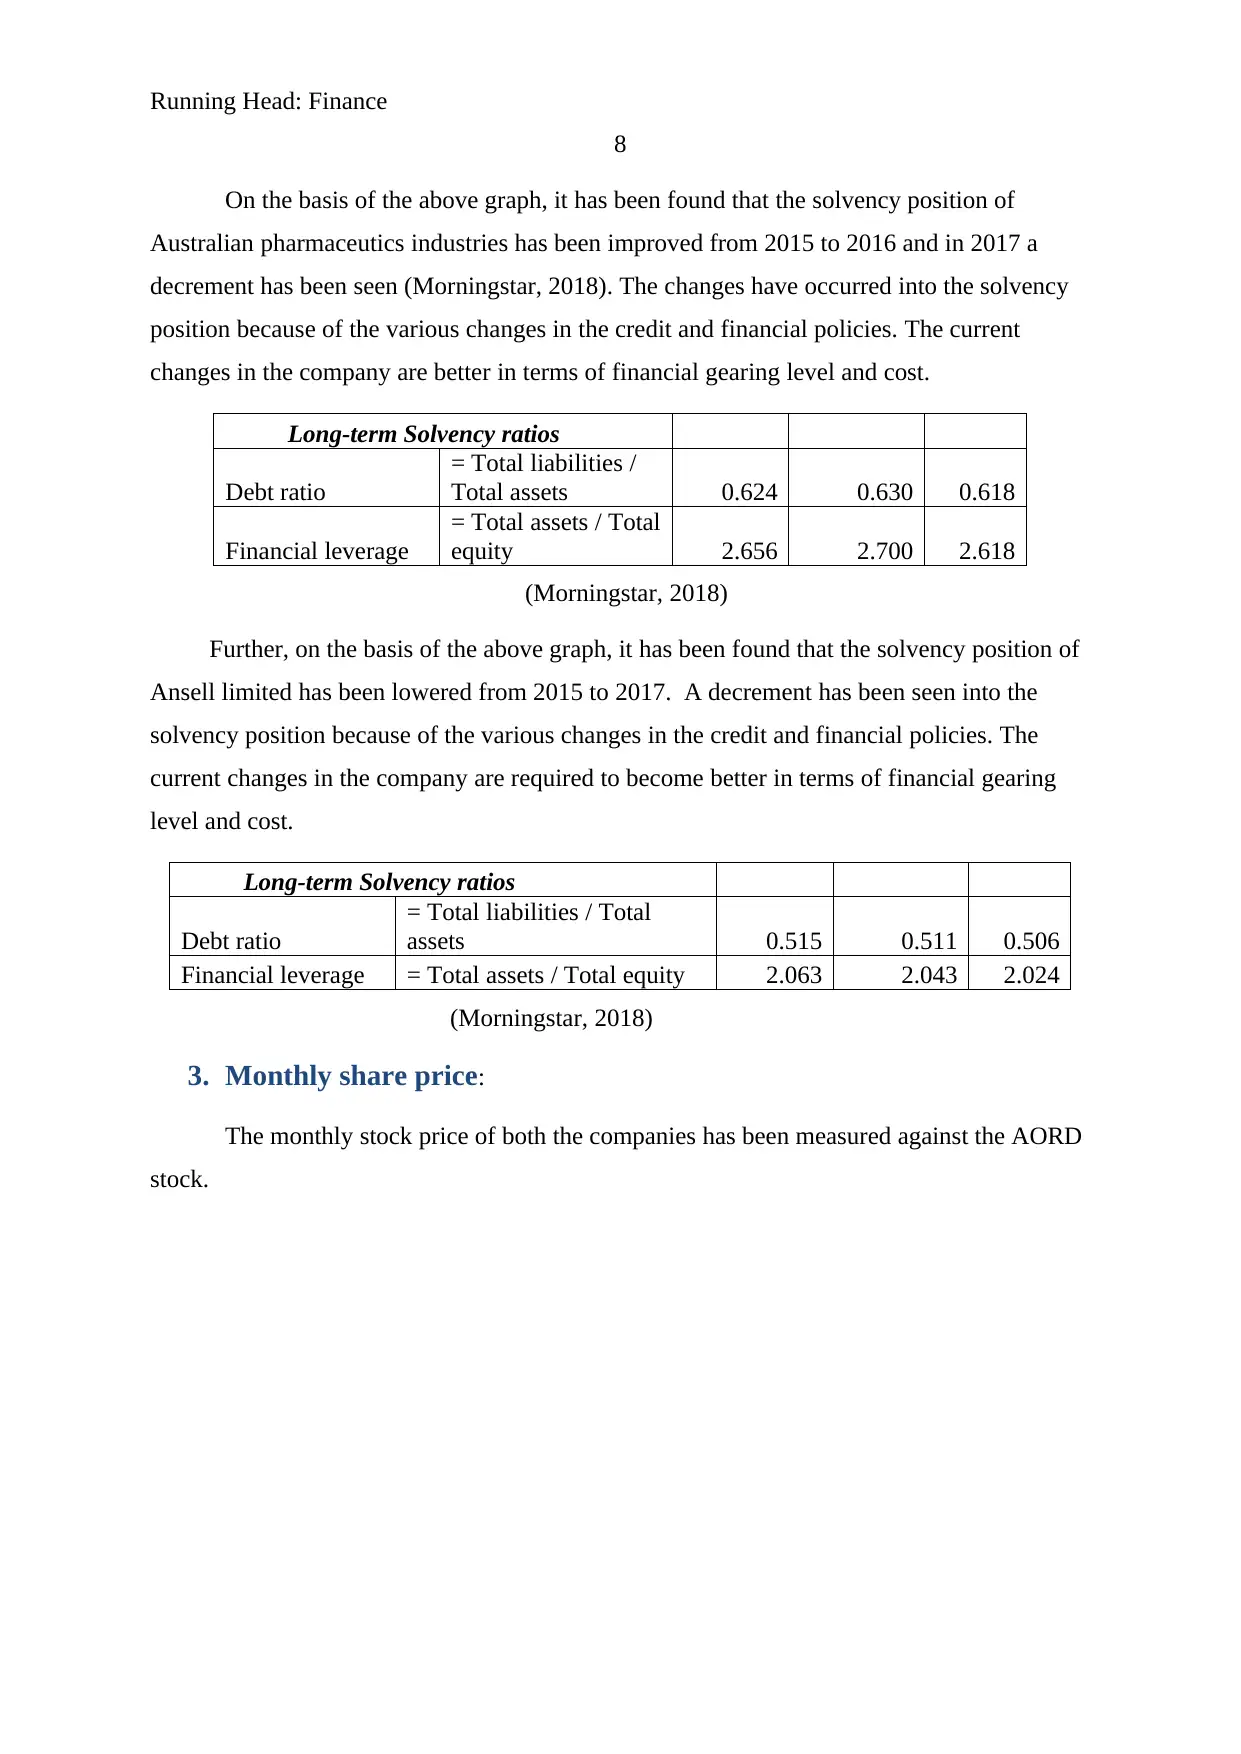
3. Monthly share price:
The monthly stock price of both the companies has been measured against the AORD
stock.
8
On the basis of the above graph, it has been found that the solvency position of
Australian pharmaceutics industries has been improved from 2015 to 2016 and in 2017 a
decrement has been seen (Morningstar, 2018). The changes have occurred into the solvency
position because of the various changes in the credit and financial policies. The current
changes in the company are better in terms of financial gearing level and cost.
Long-term Solvency ratios
Debt ratio
= Total liabilities /
Total assets 0.624 0.630 0.618
Financial leverage
= Total assets / Total
equity 2.656 2.700 2.618
(Morningstar, 2018)
Further, on the basis of the above graph, it has been found that the solvency position of
Ansell limited has been lowered from 2015 to 2017. A decrement has been seen into the
solvency position because of the various changes in the credit and financial policies. The
current changes in the company are required to become better in terms of financial gearing
level and cost.
Long-term Solvency ratios
Debt ratio
= Total liabilities / Total
assets 0.515 0.511 0.506
Financial leverage = Total assets / Total equity 2.063 2.043 2.024
(Morningstar, 2018)
3. Monthly share price:
The monthly stock price of both the companies has been measured against the AORD
stock.
Running Head: Finance
9
Figure 4: Stock price changes
(Yahoo Finance, 2018)
Report:
On the basis of the above chart, it has been found that the return from API and ANN
are 1.04% and 0.79% whereas the 0.34%% return are offered by the AORD stock. It explains
that the changes in the API stock are more attractive further, the volatility of both the stock
has been measured and it has been found that the volatility of API is higher than ANN
(Yahoo finance, 2018). Though, both the stock represent that the stock prices are not
affecting the AORD stocks. And all the stocks are individually fluctuating in the market.
The correlation among both the stock has been identified and it has been evaluated
that the correlation among the API and AORD are 0.38 whereas the correlation among the
ANN and AORD are 0.53. It represents that the relations among the stock are positive and
depict that the same changes could be taken place in both the companies (Reuters, 2018). The
trend among both the stock explains that the stock of API is more diverse and the volatility of
API is also higher. On the basis of the evaluation, it has been concluded that performance of
both the stocks are better. Though, the API stock is more attractive.
4. Significant factors:
On the basis of API stock, it has been found that the stock price of the company has
been improved on 30/06/2016, by 14.29%. It represents a higher increment in the stock price,
the changes have occurred due to the dividend announcement (AFR, 2018). Further, on
⊘ This is a preview!⊘
Do you want full access?
Subscribe today to unlock all pages.
Trusted by 1+ million students worldwide
Running Head: Finance
10
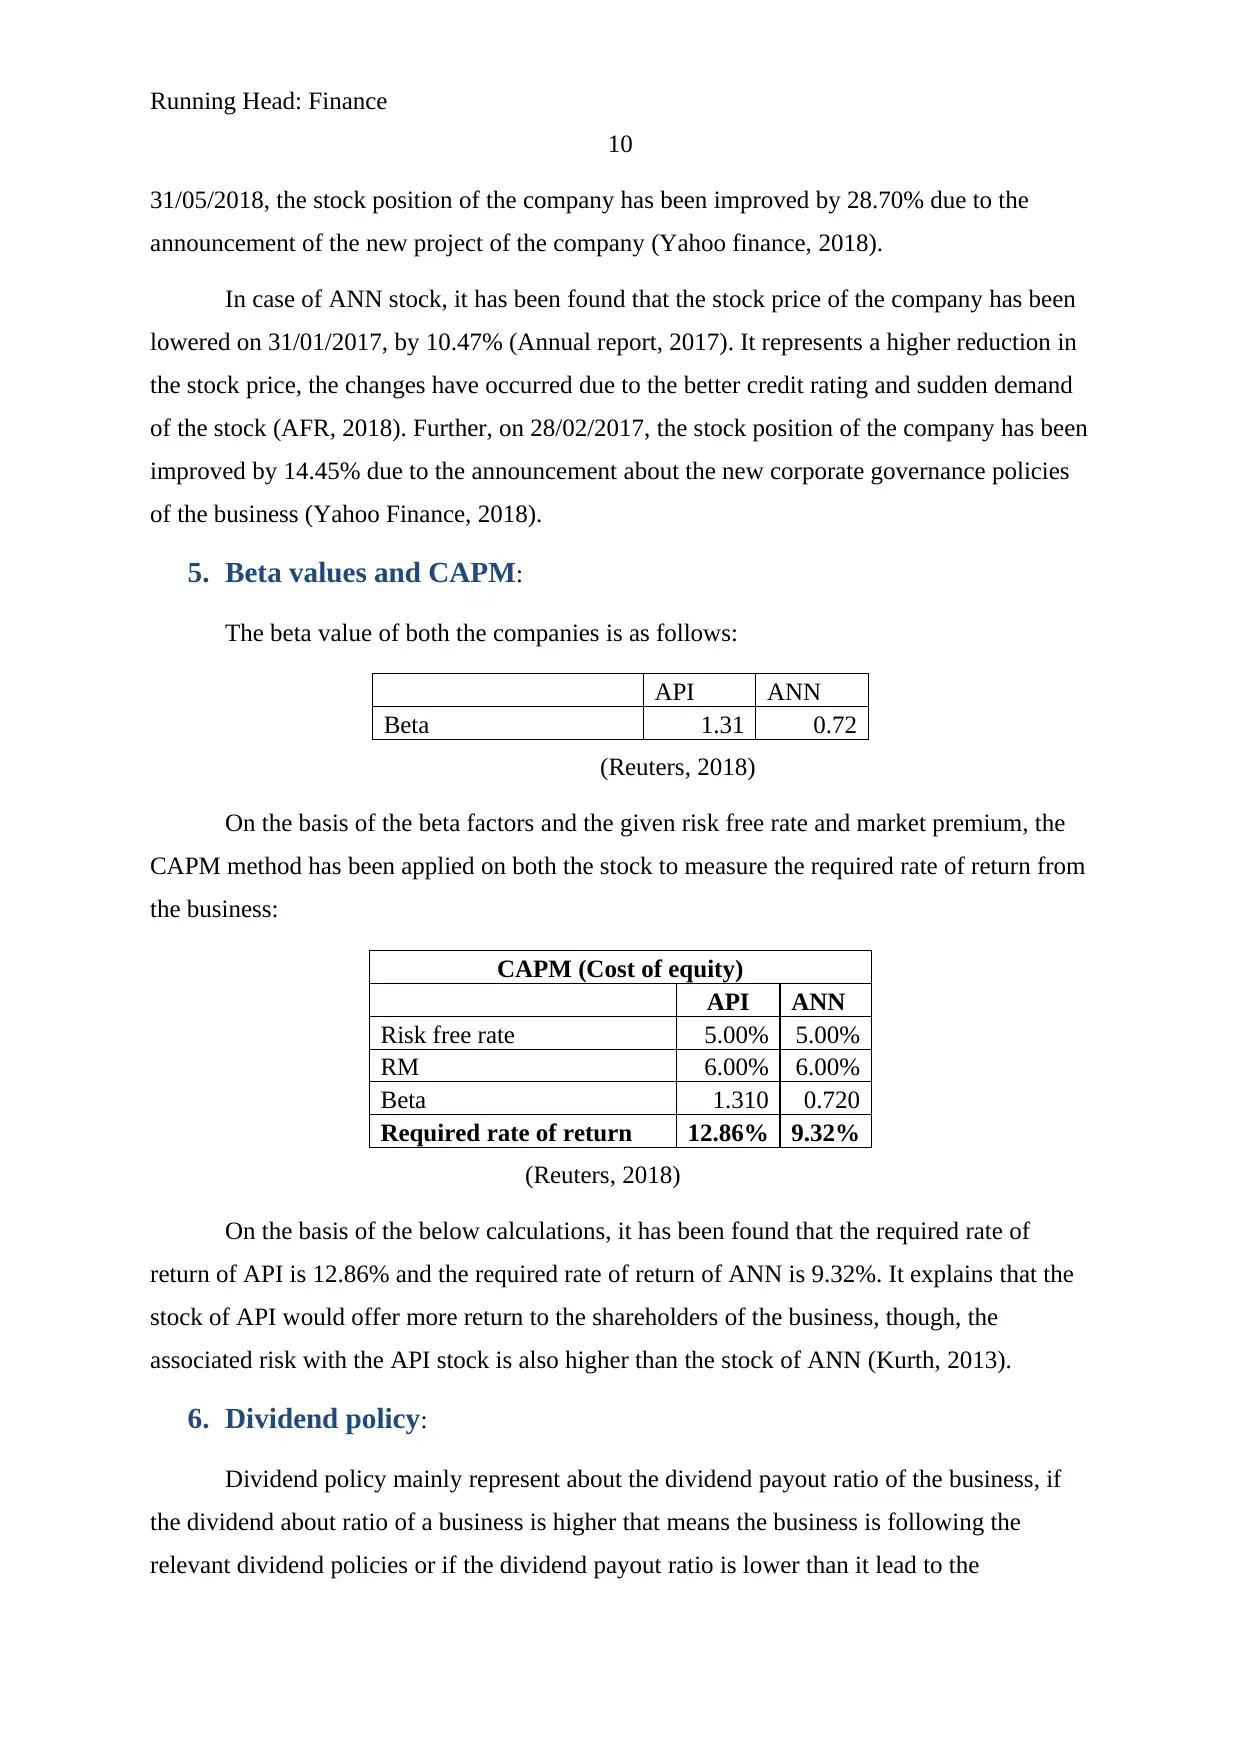
31/05/2018, the stock position of the company has been improved by 28.70% due to the
announcement of the new project of the company (Yahoo finance, 2018).
In case of ANN stock, it has been found that the stock price of the company has been
lowered on 31/01/2017, by 10.47% (Annual report, 2017). It represents a higher reduction in
the stock price, the changes have occurred due to the better credit rating and sudden demand
of the stock (AFR, 2018). Further, on 28/02/2017, the stock position of the company has been
improved by 14.45% due to the announcement about the new corporate governance policies
of the business (Yahoo Finance, 2018).
5. Beta values and CAPM:
The beta value of both the companies is as follows:
API ANN
Beta 1.31 0.72
(Reuters, 2018)
On the basis of the beta factors and the given risk free rate and market premium, the
CAPM method has been applied on both the stock to measure the required rate of return from
the business:
CAPM (Cost of equity)
API ANN
Risk free rate 5.00% 5.00%
RM 6.00% 6.00%
Beta 1.310 0.720
Required rate of return 12.86% 9.32%
(Reuters, 2018)
On the basis of the below calculations, it has been found that the required rate of
return of API is 12.86% and the required rate of return of ANN is 9.32%. It explains that the
stock of API would offer more return to the shareholders of the business, though, the
associated risk with the API stock is also higher than the stock of ANN (Kurth, 2013).
6. Dividend policy:
Dividend policy mainly represent about the dividend payout ratio of the business, if
the dividend about ratio of a business is higher that means the business is following the
relevant dividend policies or if the dividend payout ratio is lower than it lead to the
10
31/05/2018, the stock position of the company has been improved by 28.70% due to the
announcement of the new project of the company (Yahoo finance, 2018).
In case of ANN stock, it has been found that the stock price of the company has been
lowered on 31/01/2017, by 10.47% (Annual report, 2017). It represents a higher reduction in
the stock price, the changes have occurred due to the better credit rating and sudden demand
of the stock (AFR, 2018). Further, on 28/02/2017, the stock position of the company has been
improved by 14.45% due to the announcement about the new corporate governance policies
of the business (Yahoo Finance, 2018).
5. Beta values and CAPM:
The beta value of both the companies is as follows:
API ANN
Beta 1.31 0.72
(Reuters, 2018)
On the basis of the beta factors and the given risk free rate and market premium, the
CAPM method has been applied on both the stock to measure the required rate of return from
the business:
CAPM (Cost of equity)
API ANN
Risk free rate 5.00% 5.00%
RM 6.00% 6.00%
Beta 1.310 0.720
Required rate of return 12.86% 9.32%
(Reuters, 2018)
On the basis of the below calculations, it has been found that the required rate of
return of API is 12.86% and the required rate of return of ANN is 9.32%. It explains that the
stock of API would offer more return to the shareholders of the business, though, the
associated risk with the API stock is also higher than the stock of ANN (Kurth, 2013).
6. Dividend policy:
Dividend policy mainly represent about the dividend payout ratio of the business, if
the dividend about ratio of a business is higher that means the business is following the
relevant dividend policies or if the dividend payout ratio is lower than it lead to the
Paraphrase This Document
Need a fresh take? Get an instant paraphrase of this document with our AI Paraphraser
Running Head: Finance
11
conclusion that the dividend policies of the company are irrelevant. Relevant and irrelevant
are two main dividend policies of the business which explains about different dividend
payment to the shareholders of the business (Kaplan and Atkinson, 2015).
Relevant dividend policies explains that the dividend are the major attractive factor to
impress and attract the shareholders towards the company, the better the dividend payout
ratio of the business, the better the investors would invest into the company. Whereas,
irrelevant dividend policy explains that business should not distribute the profit as dividend
and must retain it for future (Higgins, 2012). The return could be achieved by the
shareholders through selling the stock in the market.
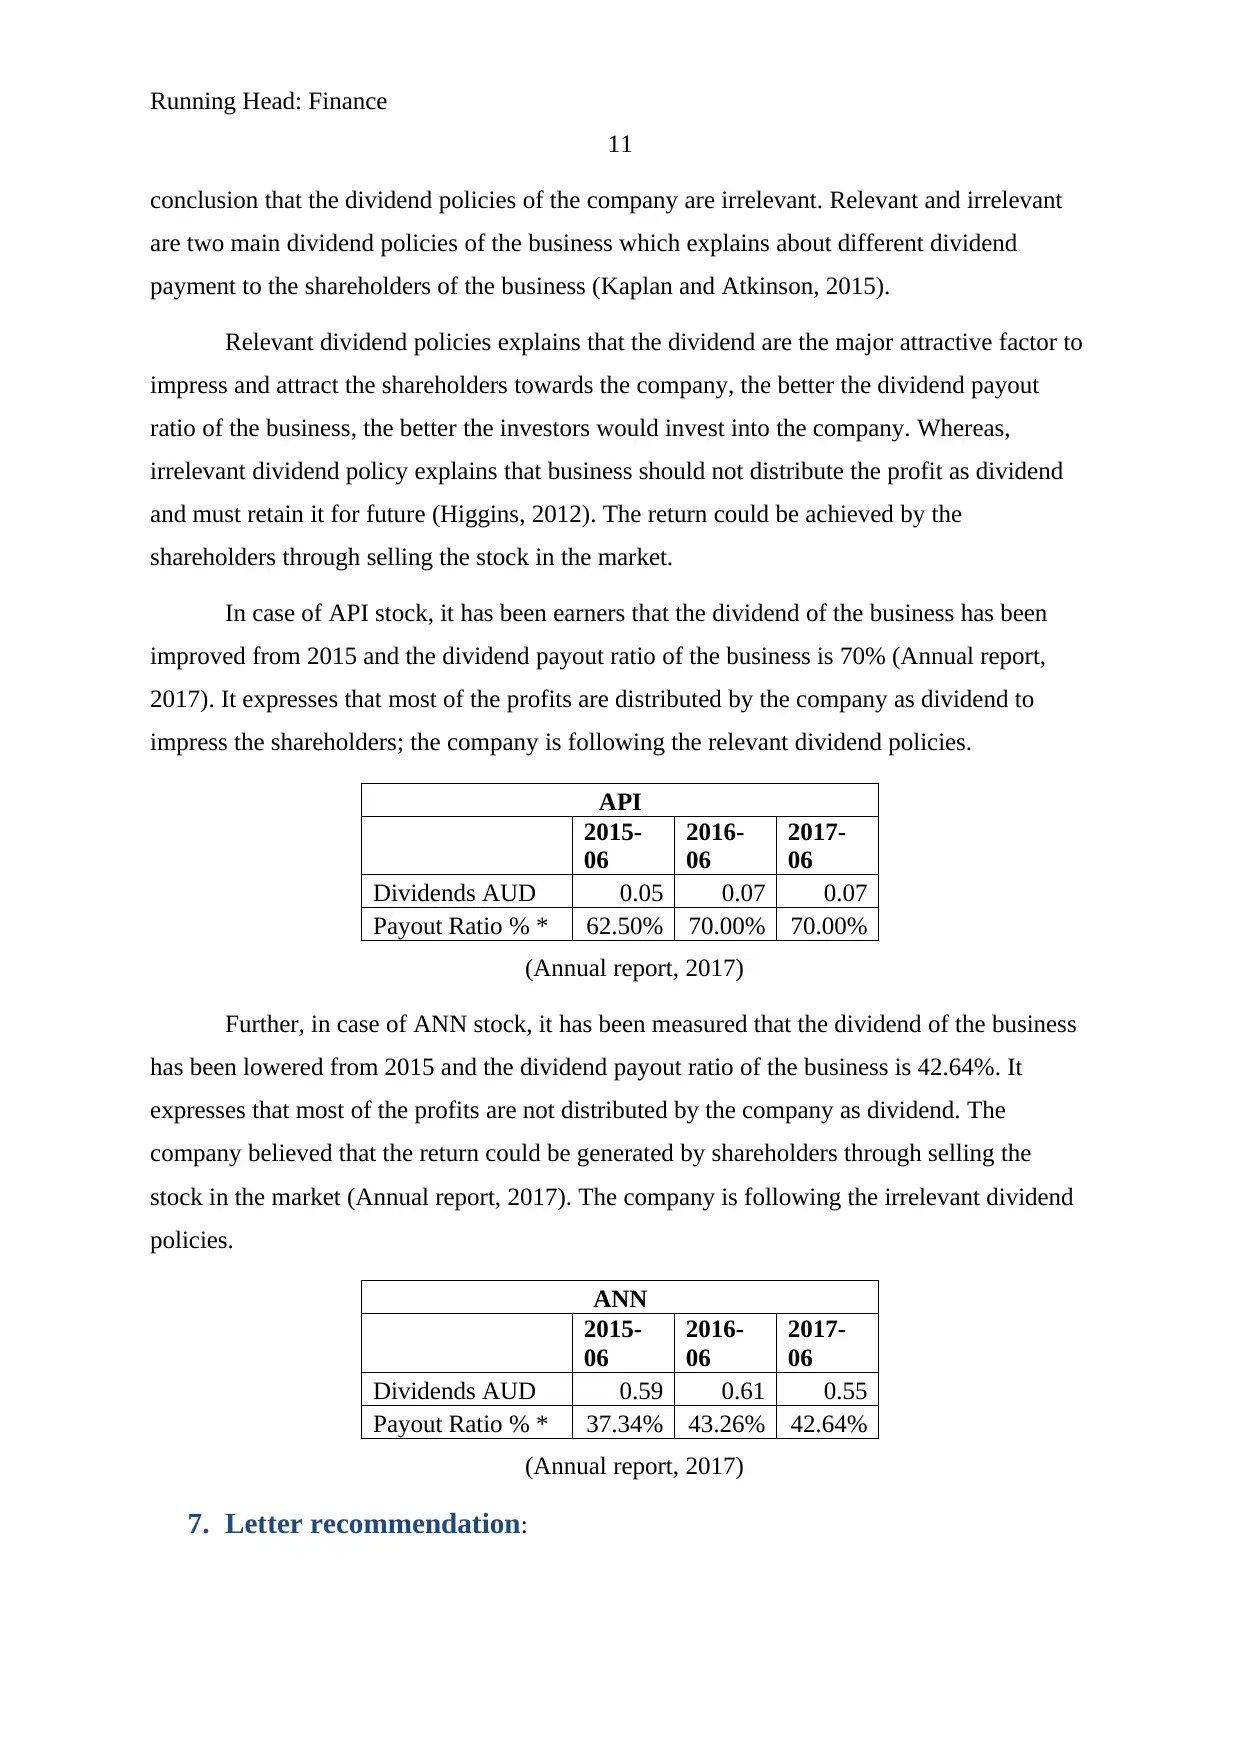
In case of API stock, it has been earners that the dividend of the business has been
improved from 2015 and the dividend payout ratio of the business is 70% (Annual report,
2017). It expresses that most of the profits are distributed by the company as dividend to
impress the shareholders; the company is following the relevant dividend policies.
API
2015-
06
2016-
06
2017-
06
Dividends AUD 0.05 0.07 0.07
Payout Ratio % * 62.50% 70.00% 70.00%
(Annual report, 2017)
Further, in case of ANN stock, it has been measured that the dividend of the business
has been lowered from 2015 and the dividend payout ratio of the business is 42.64%. It
expresses that most of the profits are not distributed by the company as dividend. The
company believed that the return could be generated by shareholders through selling the
stock in the market (Annual report, 2017). The company is following the irrelevant dividend
policies.
ANN
2015-
06
2016-
06
2017-
06
Dividends AUD 0.59 0.61 0.55
Payout Ratio % * 37.34% 43.26% 42.64%
(Annual report, 2017)
7. Letter recommendation:
11
conclusion that the dividend policies of the company are irrelevant. Relevant and irrelevant
are two main dividend policies of the business which explains about different dividend
payment to the shareholders of the business (Kaplan and Atkinson, 2015).
Relevant dividend policies explains that the dividend are the major attractive factor to
impress and attract the shareholders towards the company, the better the dividend payout
ratio of the business, the better the investors would invest into the company. Whereas,
irrelevant dividend policy explains that business should not distribute the profit as dividend
and must retain it for future (Higgins, 2012). The return could be achieved by the
shareholders through selling the stock in the market.
In case of API stock, it has been earners that the dividend of the business has been
improved from 2015 and the dividend payout ratio of the business is 70% (Annual report,
2017). It expresses that most of the profits are distributed by the company as dividend to
impress the shareholders; the company is following the relevant dividend policies.
API
2015-
06
2016-
06
2017-
06
Dividends AUD 0.05 0.07 0.07
Payout Ratio % * 62.50% 70.00% 70.00%
(Annual report, 2017)
Further, in case of ANN stock, it has been measured that the dividend of the business
has been lowered from 2015 and the dividend payout ratio of the business is 42.64%. It
expresses that most of the profits are not distributed by the company as dividend. The
company believed that the return could be generated by shareholders through selling the
stock in the market (Annual report, 2017). The company is following the irrelevant dividend
policies.
ANN
2015-
06
2016-
06
2017-
06
Dividends AUD 0.59 0.61 0.55
Payout Ratio % * 37.34% 43.26% 42.64%
(Annual report, 2017)
7. Letter recommendation:
Running Head: Finance
12
To,
Client,
Address.
Subject: Recommendation letter.
Dear Client,
According to your interest on two Australian companies and their investment position, a
financial study has been conducted on both the companies to measure the investment level.
description of history, core activities etc of the companies, performance ratio evaluation,
monthly share price, beta values, CAPM, dividend policies etc of both the companies have
been identified to measure the investment level of the business.
On the basis of the company description, main competitive advantage of both the companies
is highest share market in their own products and the market performance of both the
companies is improving rapidly. Further, on the basis of the ratio analysis on both the
companies, it has been measured that the position of API stock are better in terms of
profitability, liquidity and solvency all the position.
On the basis of the evaluation on stock price movement, it has been concluded that
performance of both the stocks are better. Though, the API stock is more attractive in terms
of return and the fluctuations. Further, in terms of required rate of return, the return from API
stock are higher, though, the associated risk with the API stock is also higher than the stock
of ANN. The API is following the relevant dividend policies as well to offer the dividend to
the shareholders of the business.
It recommends you to invest into the Australian pharmaceuticals industries in order to get
higher return from the Australian stock exchange.
⊘ This is a preview!⊘
Do you want full access?
Subscribe today to unlock all pages.
Trusted by 1+ million students worldwide
1 out of 21
Related Documents


Your All-in-One AI-Powered Toolkit for Academic Success.
+13062052269
info@desklib.com
Available 24*7 on WhatsApp / Email
![[object Object]](/_next/static/media/star-bottom.7253800d.svg)
Unlock your academic potential
Copyright © 2020–2026 A2Z Services. All Rights Reserved. Developed and managed by ZUCOL.