Financial Performance Report: Britvic plc and Barr Group plc Analysis
VerifiedAdded on 2020/07/22
|17
|5120
|32
Report
AI Summary
This report presents a comprehensive financial analysis of Britvic plc and Barr Group plc, focusing on key performance indicators to aid investment decisions. It begins with an executive summary and an introduction outlining the report's objectives. Part A delves into the price-earnings ratio, its significance, and its application in valuing companies, including discussions on trailing and forward P/E ratios, and factors influencing P/E ratios such as previous performance, growth potential, risk, corporate governance, dividend pay-out, and economic cycles. The report then describes how to use P/E multiples to assess a company's value and provides a comparative analysis of Britvic plc and AG Barr plc within the beverages and non-alcoholic industry. It further explores various investment ratios, including price-to-book value, debt-equity ratio, operating profit margin, and earnings per share, emphasizing their importance in evaluating financial health and making informed investment decisions. Part B then examines the cash inflows and outflows, along with the calculation of the payback period, net present value, and internal rate of return for Grahams Inc, providing a practical application of financial analysis techniques. The report concludes with a summary of findings and references used.

Accounting and Financial
management
management
Paraphrase This Document
Need a fresh take? Get an instant paraphrase of this document with our AI Paraphraser
Table of Contents
EXECUTIVE SUMMARY.............................................................................................................1
INTRODUCTION...........................................................................................................................1
PART A...........................................................................................................................................1
PART B............................................................................................................................................6
Performance of two company's ..................................................................................................6
CASE B1: Grahams Inc:...........................................................................................................12
A. Cash inflows and outflows:..................................................................................................12
B. Calculate Payback period, Net present value and internal rate of return:............................12
CONCLUSION..............................................................................................................................13
REFERENCES .............................................................................................................................14
EXECUTIVE SUMMARY
Analysis of the financial activities in a firm makes a perfect interpretation so that the
investors can take their decisions about the investment. This report is divided into two parts. One
part is mandatory and other part is totally related to the cash inflows and outflows and net
present value of the firm. This report likewise covers various financial ratios which are
calculated on the basis of the financial performance of the both Britvic plc and Barr group plc.
Their P/E ratio is also calculated under this.
INTRODUCTION
This report is totally based no the financial performance of the Britvic plc and Barr group
plc and their main aim is to make certain decisions so that they can come to final conclusion and
able to make decisions in an effective manner. Under this report, price earnings and other
investment ratios are used so that strategy director could build their own decisions in an effective
manner. In addition to this, they are also planning to merge or takeover with their competitors
after analysing their competitors’ performance.
PART A
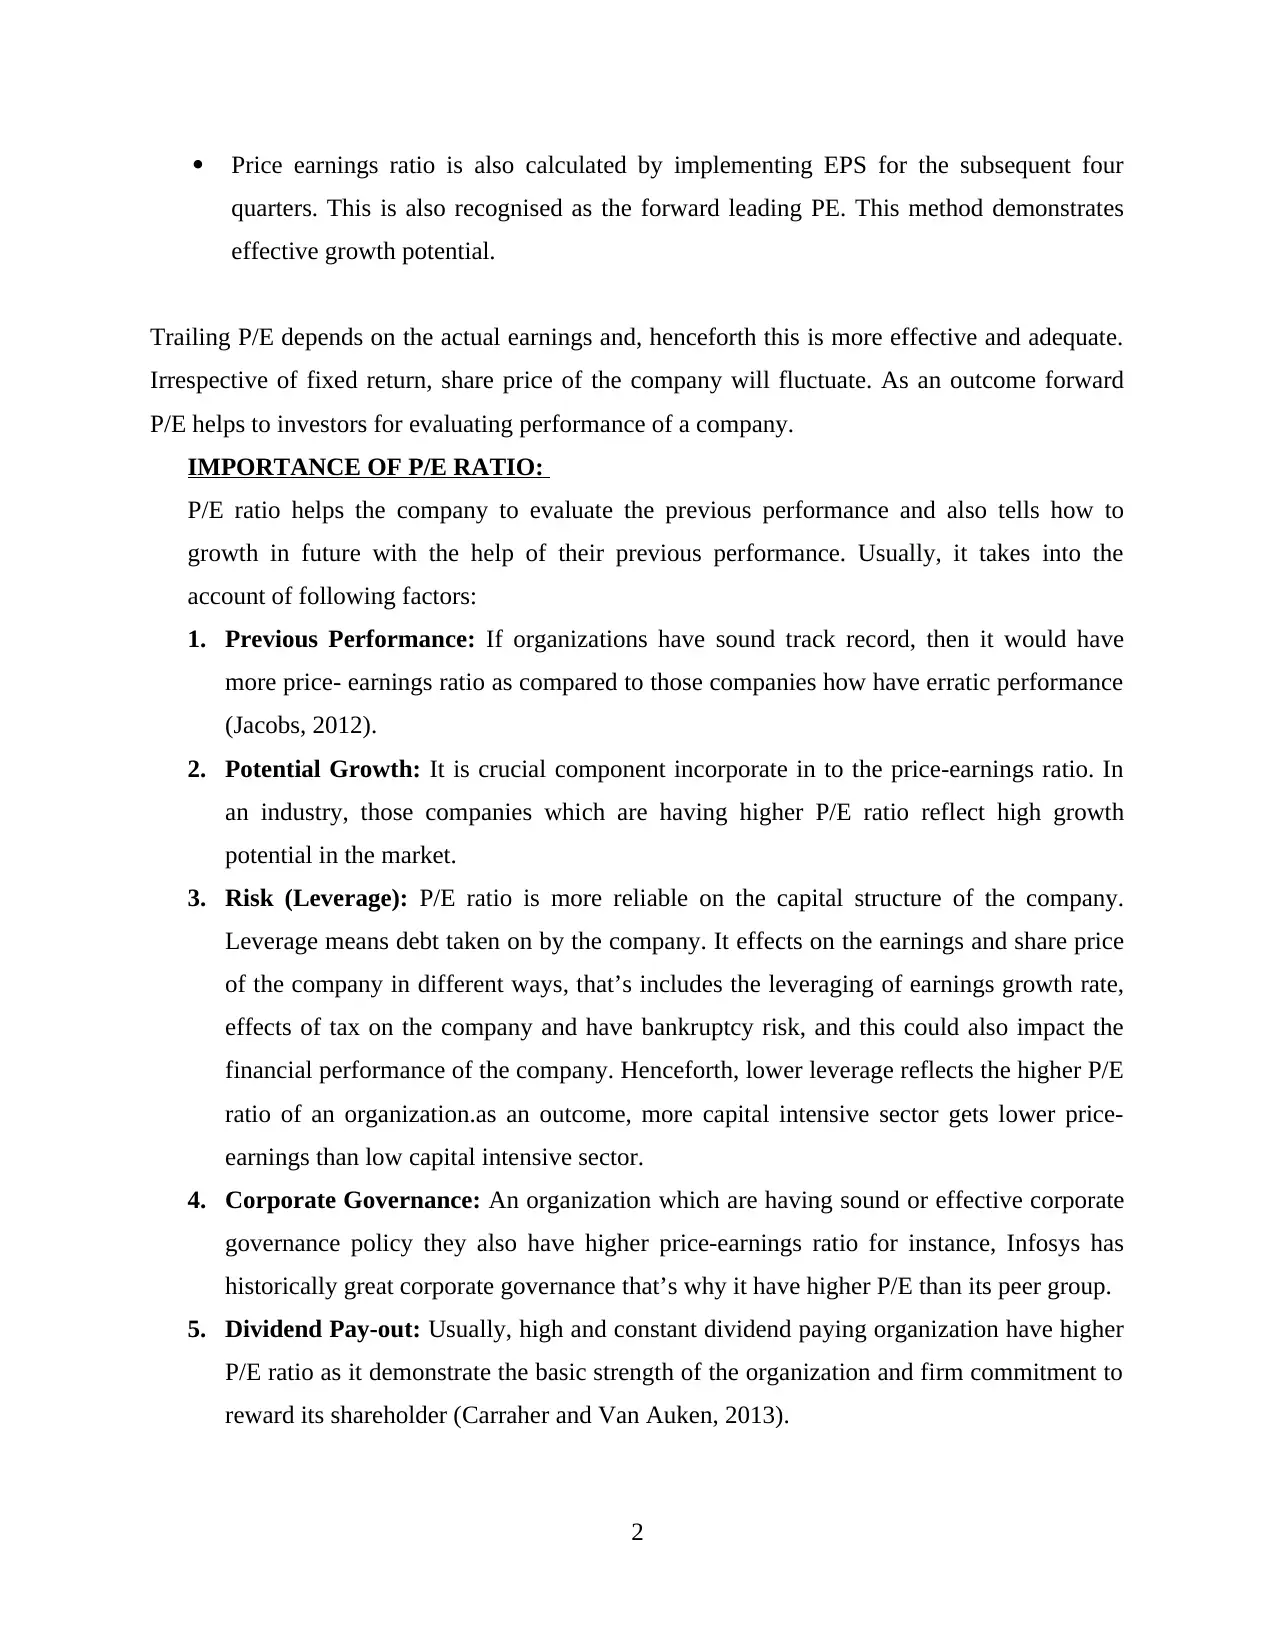
Explanation of price earnings ratio: Price earnings ratio is used for valuing of stock price. This
is mostly applied for valuing stocks. This is complicated one for evaluating the stock price of a
company. This could be highly informative in few situations, while at the other times, this
interpret nothing. As an outcome, investors usually misinterpret this term and place more value
in it than is warranted (Ahmed and Duellman, 2013). Price to earnings ratio is applied to
interpret how expensive or cheap the stock of a share. This is a tool which can be used to forecast
an adequate value of the stock value. For calculating this,, the current stock prices of a
company’s share is adopted and divide it to its earning per share. However price to earning can
be calculated by way of under mentioned method:
Many of the time, P/E ratio is measured by using earning per share from the previous
four quarters. It is also recognised as the trailing P/E. although, such method for
calculating P/E, does not render the perfect reflection of the organisation growth
potential.
1
Analysis of the financial activities in a firm makes a perfect interpretation so that the
investors can take their decisions about the investment. This report is divided into two parts. One
part is mandatory and other part is totally related to the cash inflows and outflows and net
present value of the firm. This report likewise covers various financial ratios which are
calculated on the basis of the financial performance of the both Britvic plc and Barr group plc.
Their P/E ratio is also calculated under this.
INTRODUCTION
This report is totally based no the financial performance of the Britvic plc and Barr group
plc and their main aim is to make certain decisions so that they can come to final conclusion and
able to make decisions in an effective manner. Under this report, price earnings and other
investment ratios are used so that strategy director could build their own decisions in an effective
manner. In addition to this, they are also planning to merge or takeover with their competitors
after analysing their competitors’ performance.
PART A
Explanation of price earnings ratio: Price earnings ratio is used for valuing of stock price. This
is mostly applied for valuing stocks. This is complicated one for evaluating the stock price of a
company. This could be highly informative in few situations, while at the other times, this
interpret nothing. As an outcome, investors usually misinterpret this term and place more value
in it than is warranted (Ahmed and Duellman, 2013). Price to earnings ratio is applied to
interpret how expensive or cheap the stock of a share. This is a tool which can be used to forecast
an adequate value of the stock value. For calculating this,, the current stock prices of a
company’s share is adopted and divide it to its earning per share. However price to earning can
be calculated by way of under mentioned method:
Many of the time, P/E ratio is measured by using earning per share from the previous
four quarters. It is also recognised as the trailing P/E. although, such method for
calculating P/E, does not render the perfect reflection of the organisation growth
potential.
1
⊘ This is a preview!⊘
Do you want full access?
Subscribe today to unlock all pages.
Trusted by 1+ million students worldwide
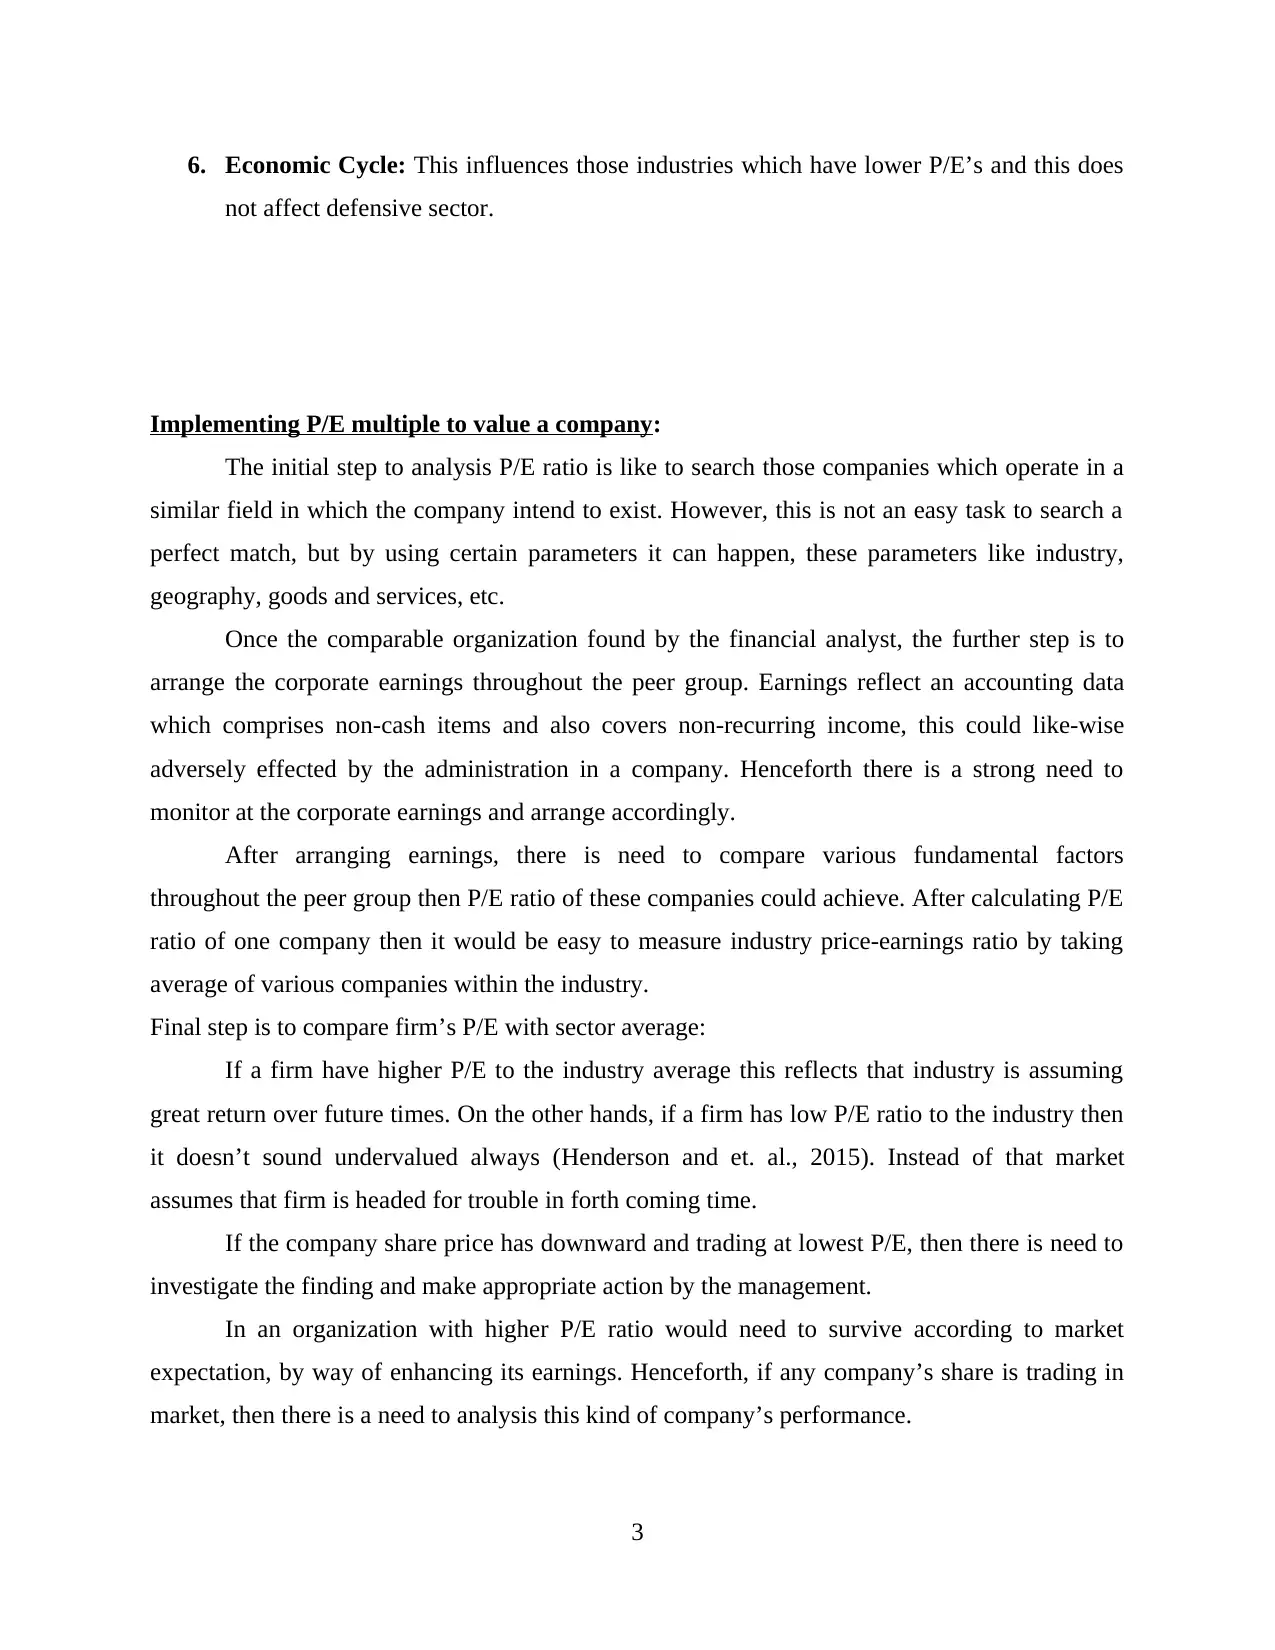
Price earnings ratio is also calculated by implementing EPS for the subsequent four
quarters. This is also recognised as the forward leading PE. This method demonstrates
effective growth potential.
Trailing P/E depends on the actual earnings and, henceforth this is more effective and adequate.
Irrespective of fixed return, share price of the company will fluctuate. As an outcome forward
P/E helps to investors for evaluating performance of a company.
IMPORTANCE OF P/E RATIO:
P/E ratio helps the company to evaluate the previous performance and also tells how to
growth in future with the help of their previous performance. Usually, it takes into the
account of following factors:
1. Previous Performance: If organizations have sound track record, then it would have
more price- earnings ratio as compared to those companies how have erratic performance
(Jacobs, 2012).
2. Potential Growth: It is crucial component incorporate in to the price-earnings ratio. In
an industry, those companies which are having higher P/E ratio reflect high growth
potential in the market.
3. Risk (Leverage): P/E ratio is more reliable on the capital structure of the company.
Leverage means debt taken on by the company. It effects on the earnings and share price
of the company in different ways, that’s includes the leveraging of earnings growth rate,
effects of tax on the company and have bankruptcy risk, and this could also impact the
financial performance of the company. Henceforth, lower leverage reflects the higher P/E
ratio of an organization.as an outcome, more capital intensive sector gets lower price-
earnings than low capital intensive sector.
4. Corporate Governance: An organization which are having sound or effective corporate
governance policy they also have higher price-earnings ratio for instance, Infosys has
historically great corporate governance that’s why it have higher P/E than its peer group.
5. Dividend Pay-out: Usually, high and constant dividend paying organization have higher
P/E ratio as it demonstrate the basic strength of the organization and firm commitment to
reward its shareholder (Carraher and Van Auken, 2013).
2
Paraphrase This Document
Need a fresh take? Get an instant paraphrase of this document with our AI Paraphraser
6. Economic Cycle: This influences those industries which have lower P/E’s and this does
not affect defensive sector.
Implementing P/E multiple to value a company:
The initial step to analysis P/E ratio is like to search those companies which operate in a
similar field in which the company intend to exist. However, this is not an easy task to search a
perfect match, but by using certain parameters it can happen, these parameters like industry,
geography, goods and services, etc.
Once the comparable organization found by the financial analyst, the further step is to
arrange the corporate earnings throughout the peer group. Earnings reflect an accounting data
which comprises non-cash items and also covers non-recurring income, this could like-wise
adversely effected by the administration in a company. Henceforth there is a strong need to
monitor at the corporate earnings and arrange accordingly.
After arranging earnings, there is need to compare various fundamental factors
throughout the peer group then P/E ratio of these companies could achieve. After calculating P/E
ratio of one company then it would be easy to measure industry price-earnings ratio by taking
average of various companies within the industry.
Final step is to compare firm’s P/E with sector average:
If a firm have higher P/E to the industry average this reflects that industry is assuming
great return over future times. On the other hands, if a firm has low P/E ratio to the industry then
it doesn’t sound undervalued always (Henderson and et. al., 2015). Instead of that market
assumes that firm is headed for trouble in forth coming time.
If the company share price has downward and trading at lowest P/E, then there is need to
investigate the finding and make appropriate action by the management.
In an organization with higher P/E ratio would need to survive according to market
expectation, by way of enhancing its earnings. Henceforth, if any company’s share is trading in
market, then there is a need to analysis this kind of company’s performance.
3
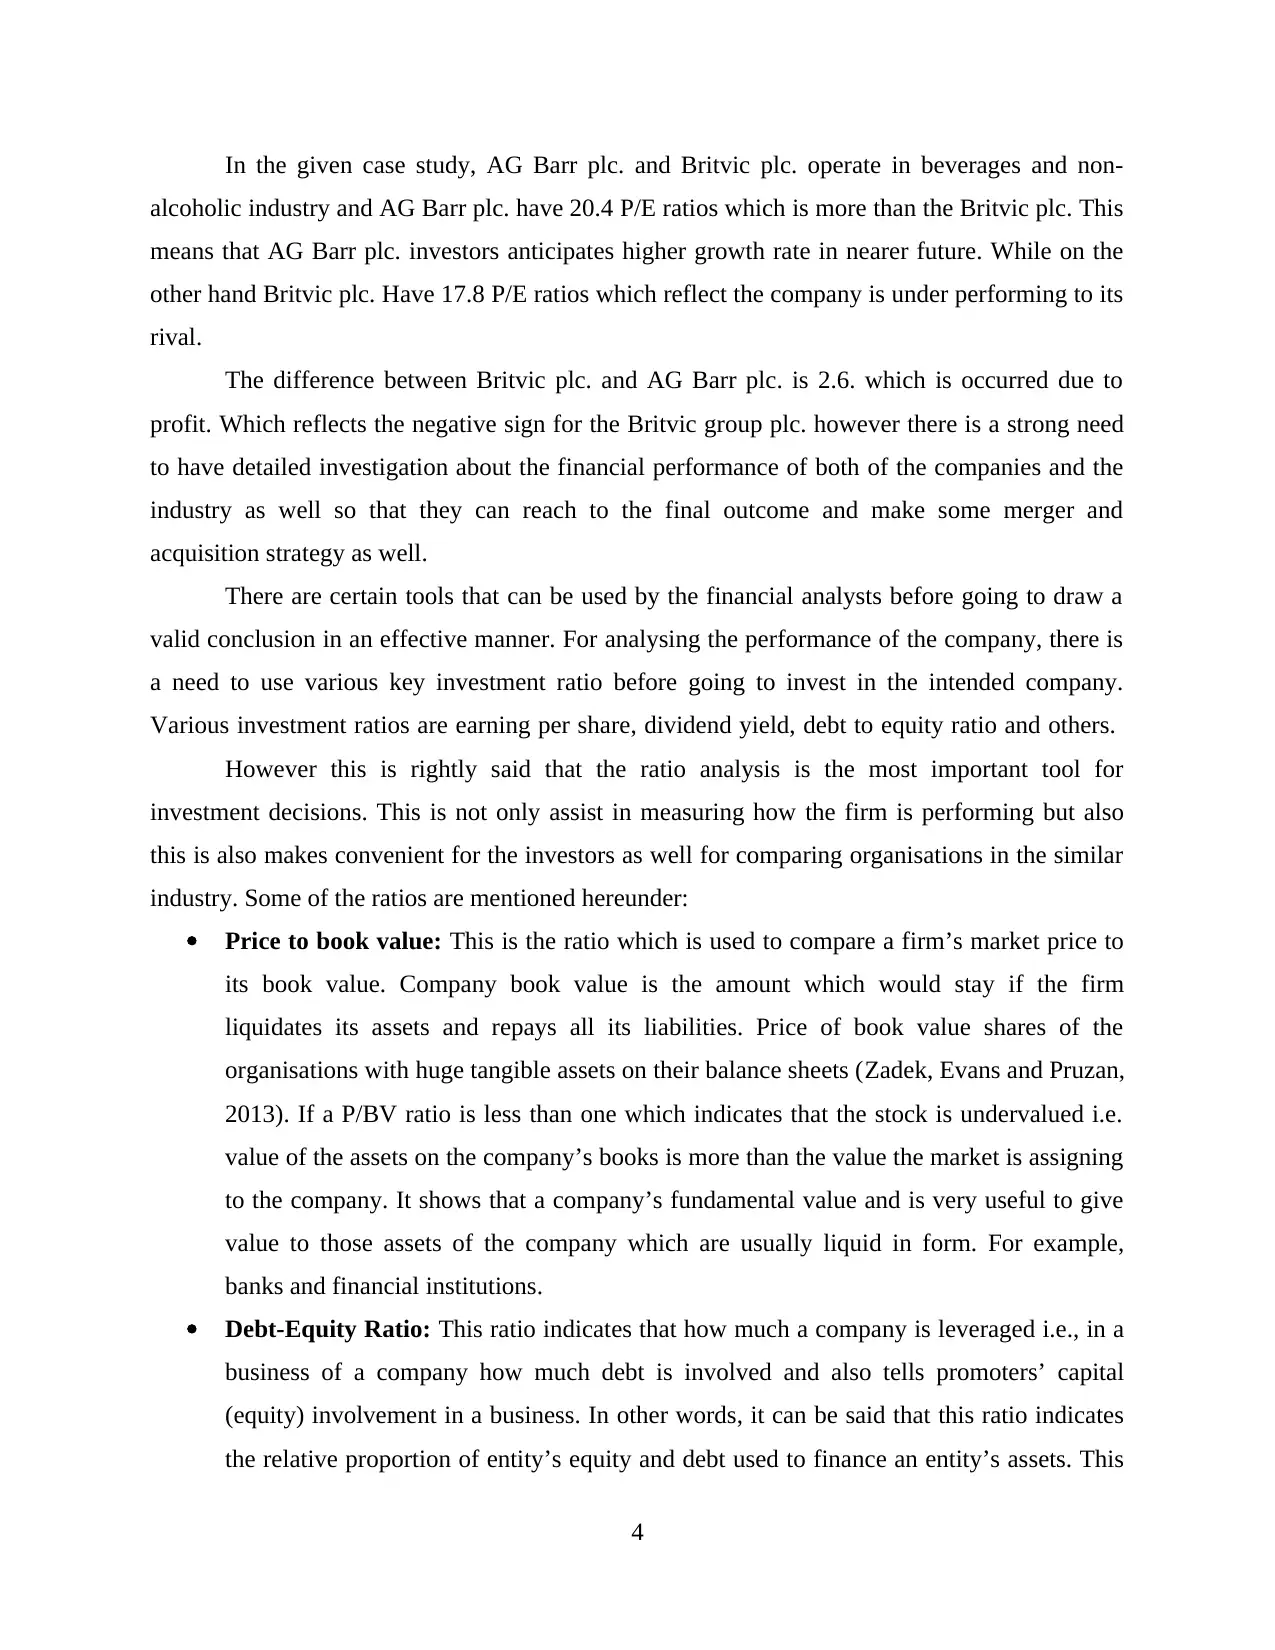
In the given case study, AG Barr plc. and Britvic plc. operate in beverages and non-
alcoholic industry and AG Barr plc. have 20.4 P/E ratios which is more than the Britvic plc. This
means that AG Barr plc. investors anticipates higher growth rate in nearer future. While on the
other hand Britvic plc. Have 17.8 P/E ratios which reflect the company is under performing to its
rival.
The difference between Britvic plc. and AG Barr plc. is 2.6. which is occurred due to
profit. Which reflects the negative sign for the Britvic group plc. however there is a strong need
to have detailed investigation about the financial performance of both of the companies and the
industry as well so that they can reach to the final outcome and make some merger and
acquisition strategy as well.
There are certain tools that can be used by the financial analysts before going to draw a
valid conclusion in an effective manner. For analysing the performance of the company, there is
a need to use various key investment ratio before going to invest in the intended company.
Various investment ratios are earning per share, dividend yield, debt to equity ratio and others.
However this is rightly said that the ratio analysis is the most important tool for
investment decisions. This is not only assist in measuring how the firm is performing but also
this is also makes convenient for the investors as well for comparing organisations in the similar
industry. Some of the ratios are mentioned hereunder:
Price to book value: This is the ratio which is used to compare a firm’s market price to
its book value. Company book value is the amount which would stay if the firm
liquidates its assets and repays all its liabilities. Price of book value shares of the
organisations with huge tangible assets on their balance sheets (Zadek, Evans and Pruzan,
2013). If a P/BV ratio is less than one which indicates that the stock is undervalued i.e.
value of the assets on the company’s books is more than the value the market is assigning
to the company. It shows that a company’s fundamental value and is very useful to give
value to those assets of the company which are usually liquid in form. For example,
banks and financial institutions.
Debt-Equity Ratio: This ratio indicates that how much a company is leveraged i.e., in a
business of a company how much debt is involved and also tells promoters’ capital
(equity) involvement in a business. In other words, it can be said that this ratio indicates
the relative proportion of entity’s equity and debt used to finance an entity’s assets. This
4
⊘ This is a preview!⊘
Do you want full access?
Subscribe today to unlock all pages.
Trusted by 1+ million students worldwide
ratio is the key financial ratio for the company and is also used to judge the standard of a
company’s financial positioning (Taipaleenmäki and Ikäheimo, 2013). It is also measure
of an organization ability to repay its liability. When measuring the health of a company,
it is important to pay attention to the debt-equity ratio. If the ratio is moving upward, the
company is being financed by creditors rather than from its own financial sources which
may be more dangerous. Lenders and investors usually prefer low debt-equity ratio
because their interests are better and well protected in the event of a business of the
company in a decline stage. Thus, a company which have high debt-equity ratios may not
be able to attract more and more investors and additional lending of capital from outside
from the investors.
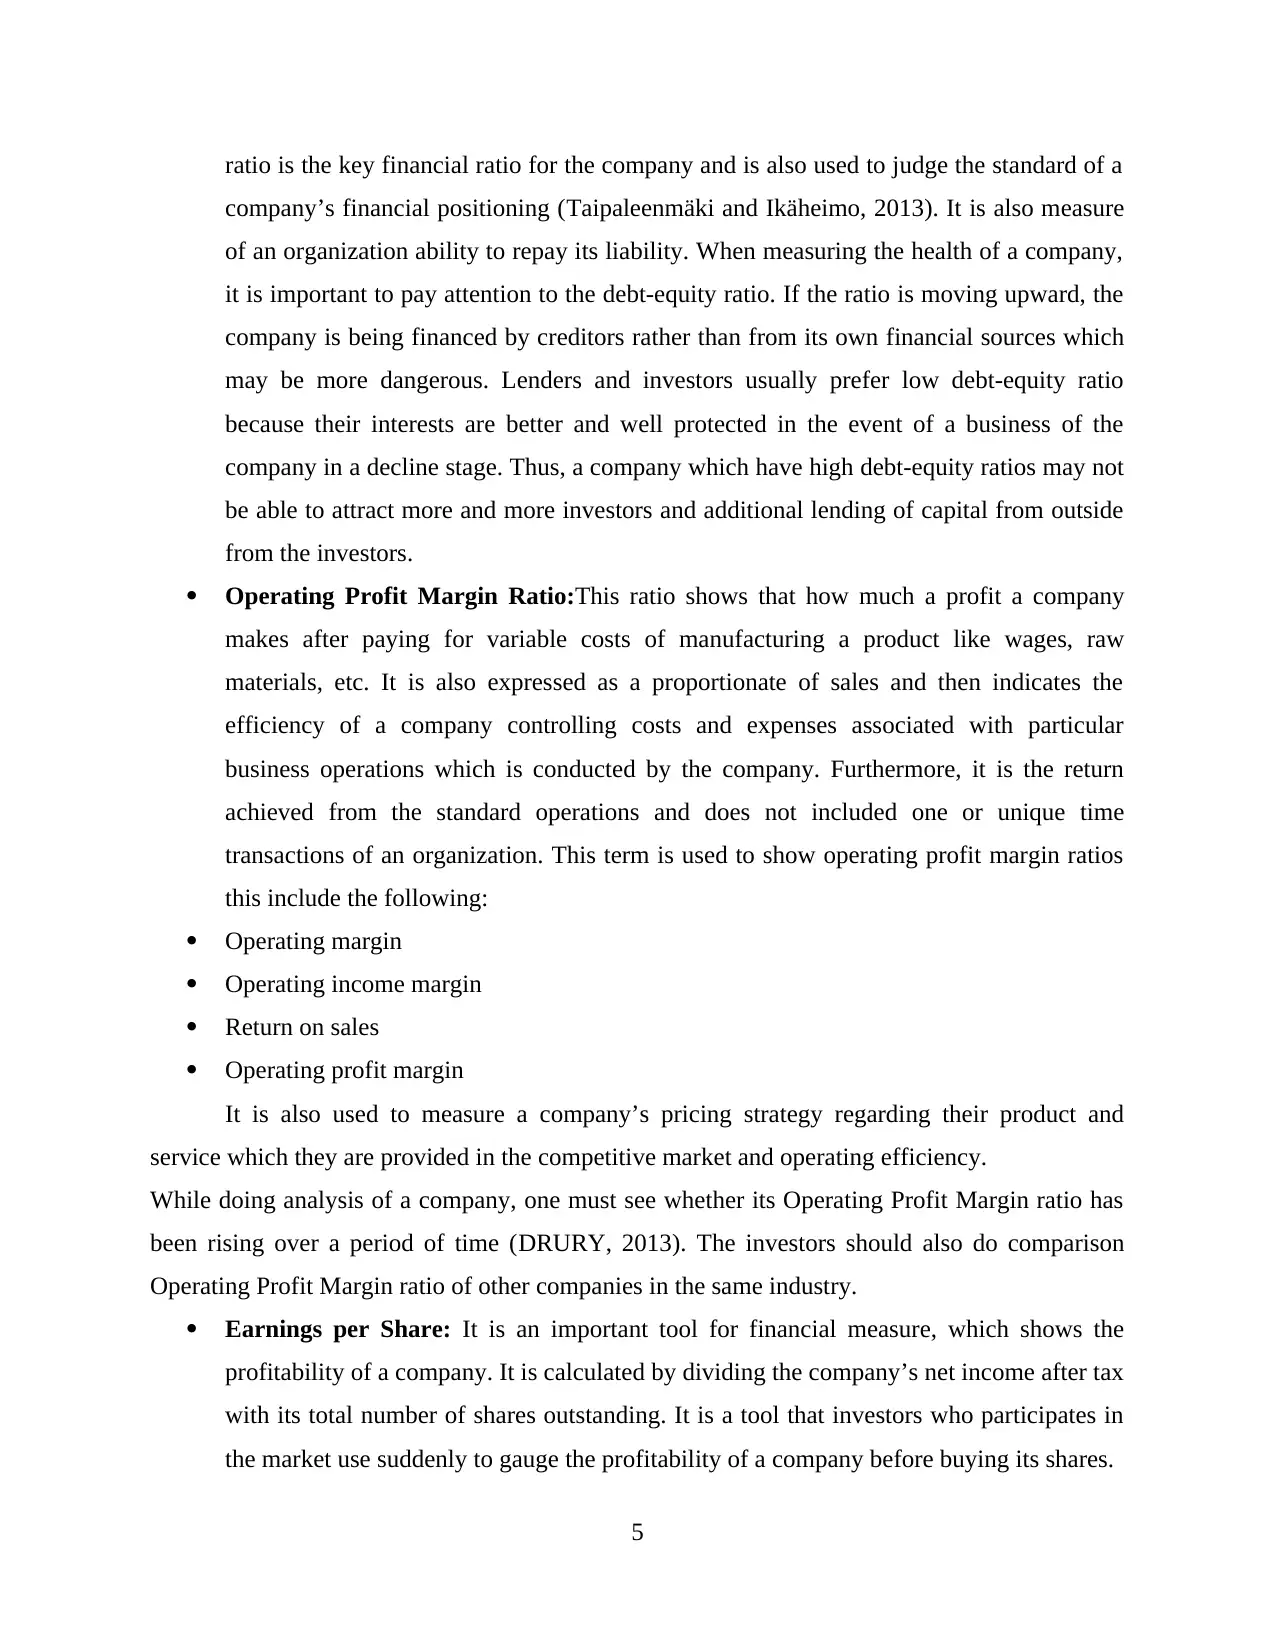
Operating Profit Margin Ratio:This ratio shows that how much a profit a company
makes after paying for variable costs of manufacturing a product like wages, raw
materials, etc. It is also expressed as a proportionate of sales and then indicates the
efficiency of a company controlling costs and expenses associated with particular
business operations which is conducted by the company. Furthermore, it is the return
achieved from the standard operations and does not included one or unique time
transactions of an organization. This term is used to show operating profit margin ratios
this include the following:
Operating margin
Operating income margin
Return on sales
Operating profit margin
It is also used to measure a company’s pricing strategy regarding their product and
service which they are provided in the competitive market and operating efficiency.
While doing analysis of a company, one must see whether its Operating Profit Margin ratio has
been rising over a period of time (DRURY, 2013). The investors should also do comparison
Operating Profit Margin ratio of other companies in the same industry.
Earnings per Share: It is an important tool for financial measure, which shows the
profitability of a company. It is calculated by dividing the company’s net income after tax
with its total number of shares outstanding. It is a tool that investors who participates in
the market use suddenly to gauge the profitability of a company before buying its shares.
5
company’s financial positioning (Taipaleenmäki and Ikäheimo, 2013). It is also measure
of an organization ability to repay its liability. When measuring the health of a company,
it is important to pay attention to the debt-equity ratio. If the ratio is moving upward, the
company is being financed by creditors rather than from its own financial sources which
may be more dangerous. Lenders and investors usually prefer low debt-equity ratio
because their interests are better and well protected in the event of a business of the
company in a decline stage. Thus, a company which have high debt-equity ratios may not
be able to attract more and more investors and additional lending of capital from outside
from the investors.
Operating Profit Margin Ratio:This ratio shows that how much a profit a company
makes after paying for variable costs of manufacturing a product like wages, raw
materials, etc. It is also expressed as a proportionate of sales and then indicates the
efficiency of a company controlling costs and expenses associated with particular
business operations which is conducted by the company. Furthermore, it is the return
achieved from the standard operations and does not included one or unique time
transactions of an organization. This term is used to show operating profit margin ratios
this include the following:
Operating margin
Operating income margin
Return on sales
Operating profit margin
It is also used to measure a company’s pricing strategy regarding their product and
service which they are provided in the competitive market and operating efficiency.
While doing analysis of a company, one must see whether its Operating Profit Margin ratio has
been rising over a period of time (DRURY, 2013). The investors should also do comparison
Operating Profit Margin ratio of other companies in the same industry.
Earnings per Share: It is an important tool for financial measure, which shows the
profitability of a company. It is calculated by dividing the company’s net income after tax
with its total number of shares outstanding. It is a tool that investors who participates in
the market use suddenly to gauge the profitability of a company before buying its shares.
5
Paraphrase This Document
Need a fresh take? Get an instant paraphrase of this document with our AI Paraphraser
The higher the earnings per share of a company, the better are its profitability. While
calculating this ratio, it is advisable to use the weighted ratio, as the number of shares
outstanding can change over a period of time.
It is calculated in two ways:
1. Net income after tax/total number of outstanding shares.
2. Weighted earnings per share: net income after tax-total dividends/total number of
outstanding shares.
For investors who are primarily interested in steady source of income, the EPS ratio can
tell him that a company has increasing its existing dividend. This ratio is important and crucial
tools for investors, it should not be looked at in isolation. Earnings per share of a company
should always be considered in relation to other companies in order to make a more informed
and prudent investment decision.
Investors can use the dividend yield formula to help analyse their return on investment in stocks.
Dividend Yield Ratio: Dividend yield ratio is the financial ratio that measures the
quantum of dividend paid out to the shareholders relative to the market value per share. It
calculated by dividing per share and multiplying the result by 100. A company which
have higher dividend yield pays a substantial share of its profits in the form of dividends.
Dividend yield of a company is always compared with the average of the industry to
which the company belonged (Brigham and Houston, 2012).
Companies which distribute their profits as dividend to their shareholders, while retaining
the remaining portion to reinvest in the business. Dividends are paid out to the shareholders of a
company.
Companies with high dividend yield normally do not keep a substantial portion of profits
as retained earnings.
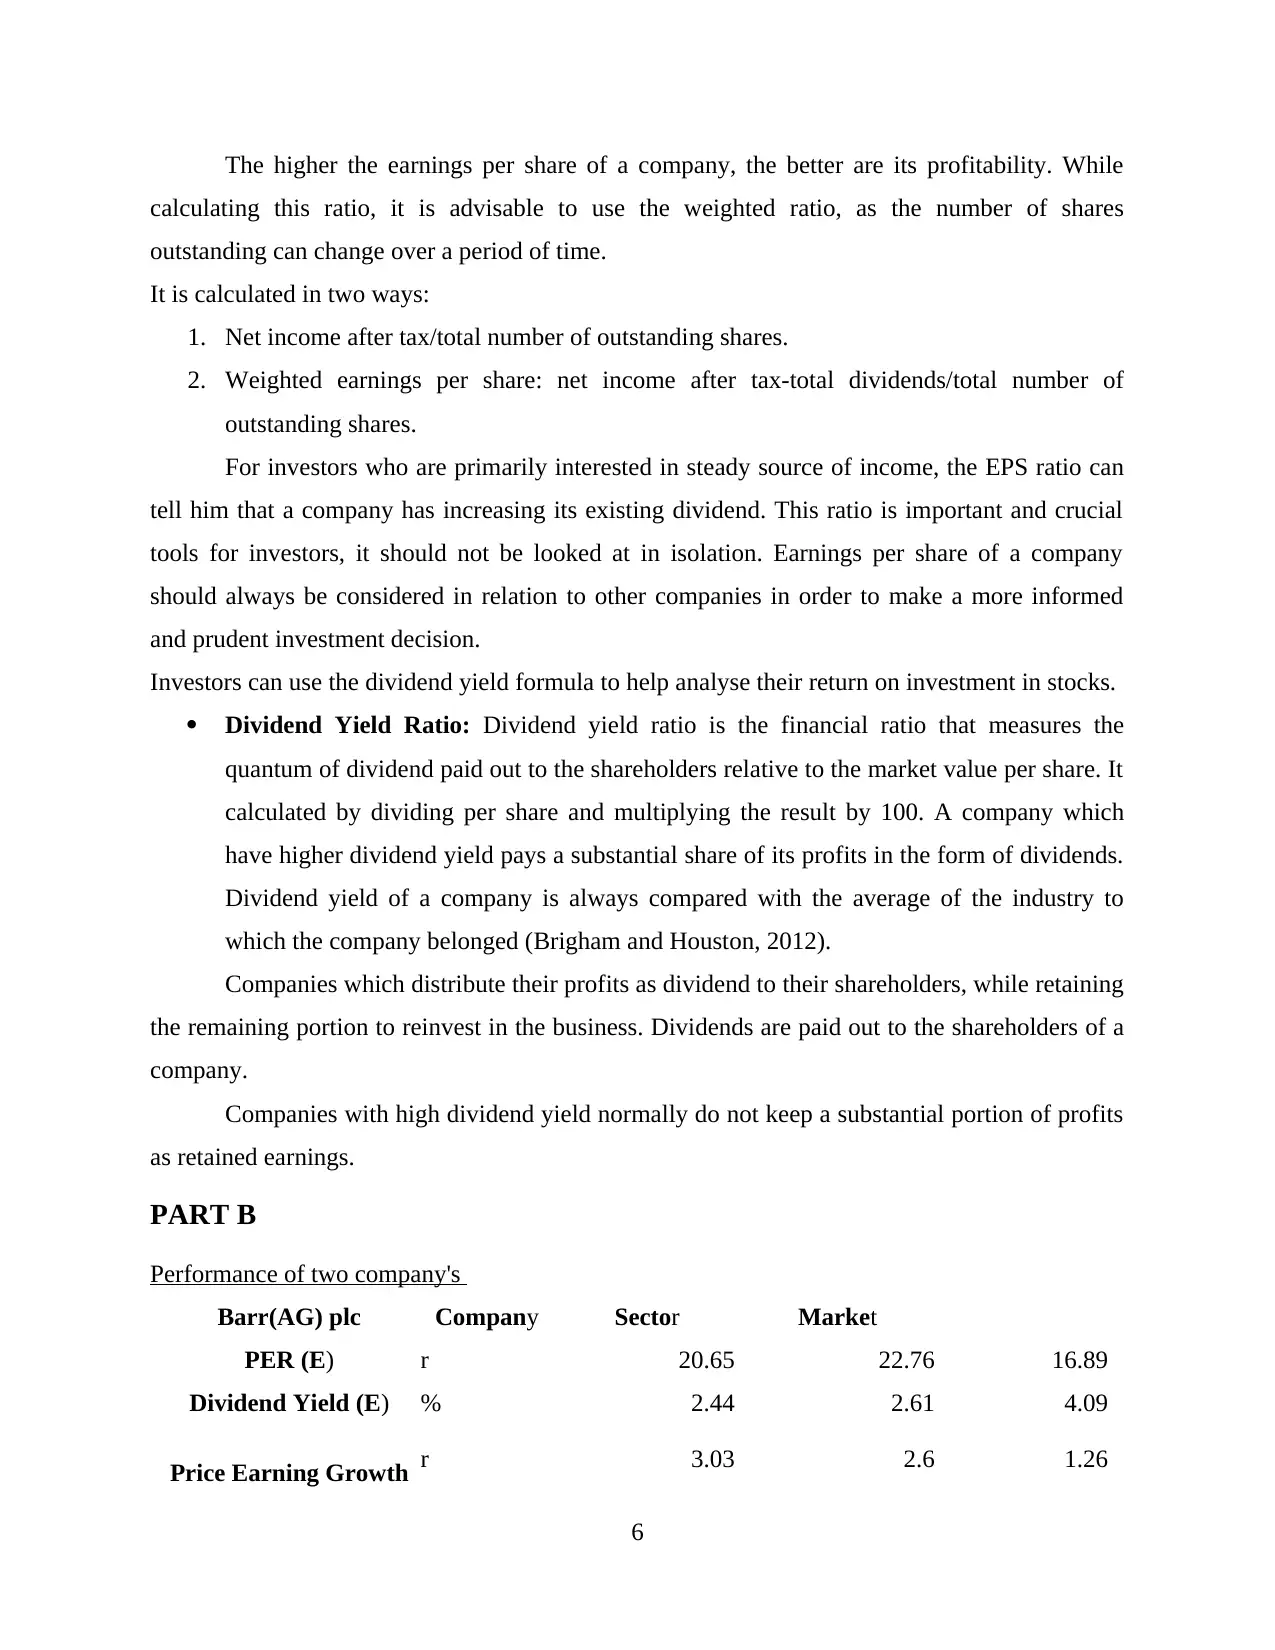
PART B
Performance of two company's
Barr(AG) plc Company Sector Market
PER (E) r 20.65 22.76 16.89
Dividend Yield (E) % 2.44 2.61 4.09
Price Earning Growth r 3.03 2.6 1.26
6
calculating this ratio, it is advisable to use the weighted ratio, as the number of shares
outstanding can change over a period of time.
It is calculated in two ways:
1. Net income after tax/total number of outstanding shares.
2. Weighted earnings per share: net income after tax-total dividends/total number of
outstanding shares.
For investors who are primarily interested in steady source of income, the EPS ratio can
tell him that a company has increasing its existing dividend. This ratio is important and crucial
tools for investors, it should not be looked at in isolation. Earnings per share of a company
should always be considered in relation to other companies in order to make a more informed
and prudent investment decision.
Investors can use the dividend yield formula to help analyse their return on investment in stocks.
Dividend Yield Ratio: Dividend yield ratio is the financial ratio that measures the
quantum of dividend paid out to the shareholders relative to the market value per share. It
calculated by dividing per share and multiplying the result by 100. A company which
have higher dividend yield pays a substantial share of its profits in the form of dividends.
Dividend yield of a company is always compared with the average of the industry to
which the company belonged (Brigham and Houston, 2012).
Companies which distribute their profits as dividend to their shareholders, while retaining
the remaining portion to reinvest in the business. Dividends are paid out to the shareholders of a
company.
Companies with high dividend yield normally do not keep a substantial portion of profits
as retained earnings.
PART B
Performance of two company's
Barr(AG) plc Company Sector Market
PER (E) r 20.65 22.76 16.89
Dividend Yield (E) % 2.44 2.61 4.09
Price Earning Growth r 3.03 2.6 1.26
6
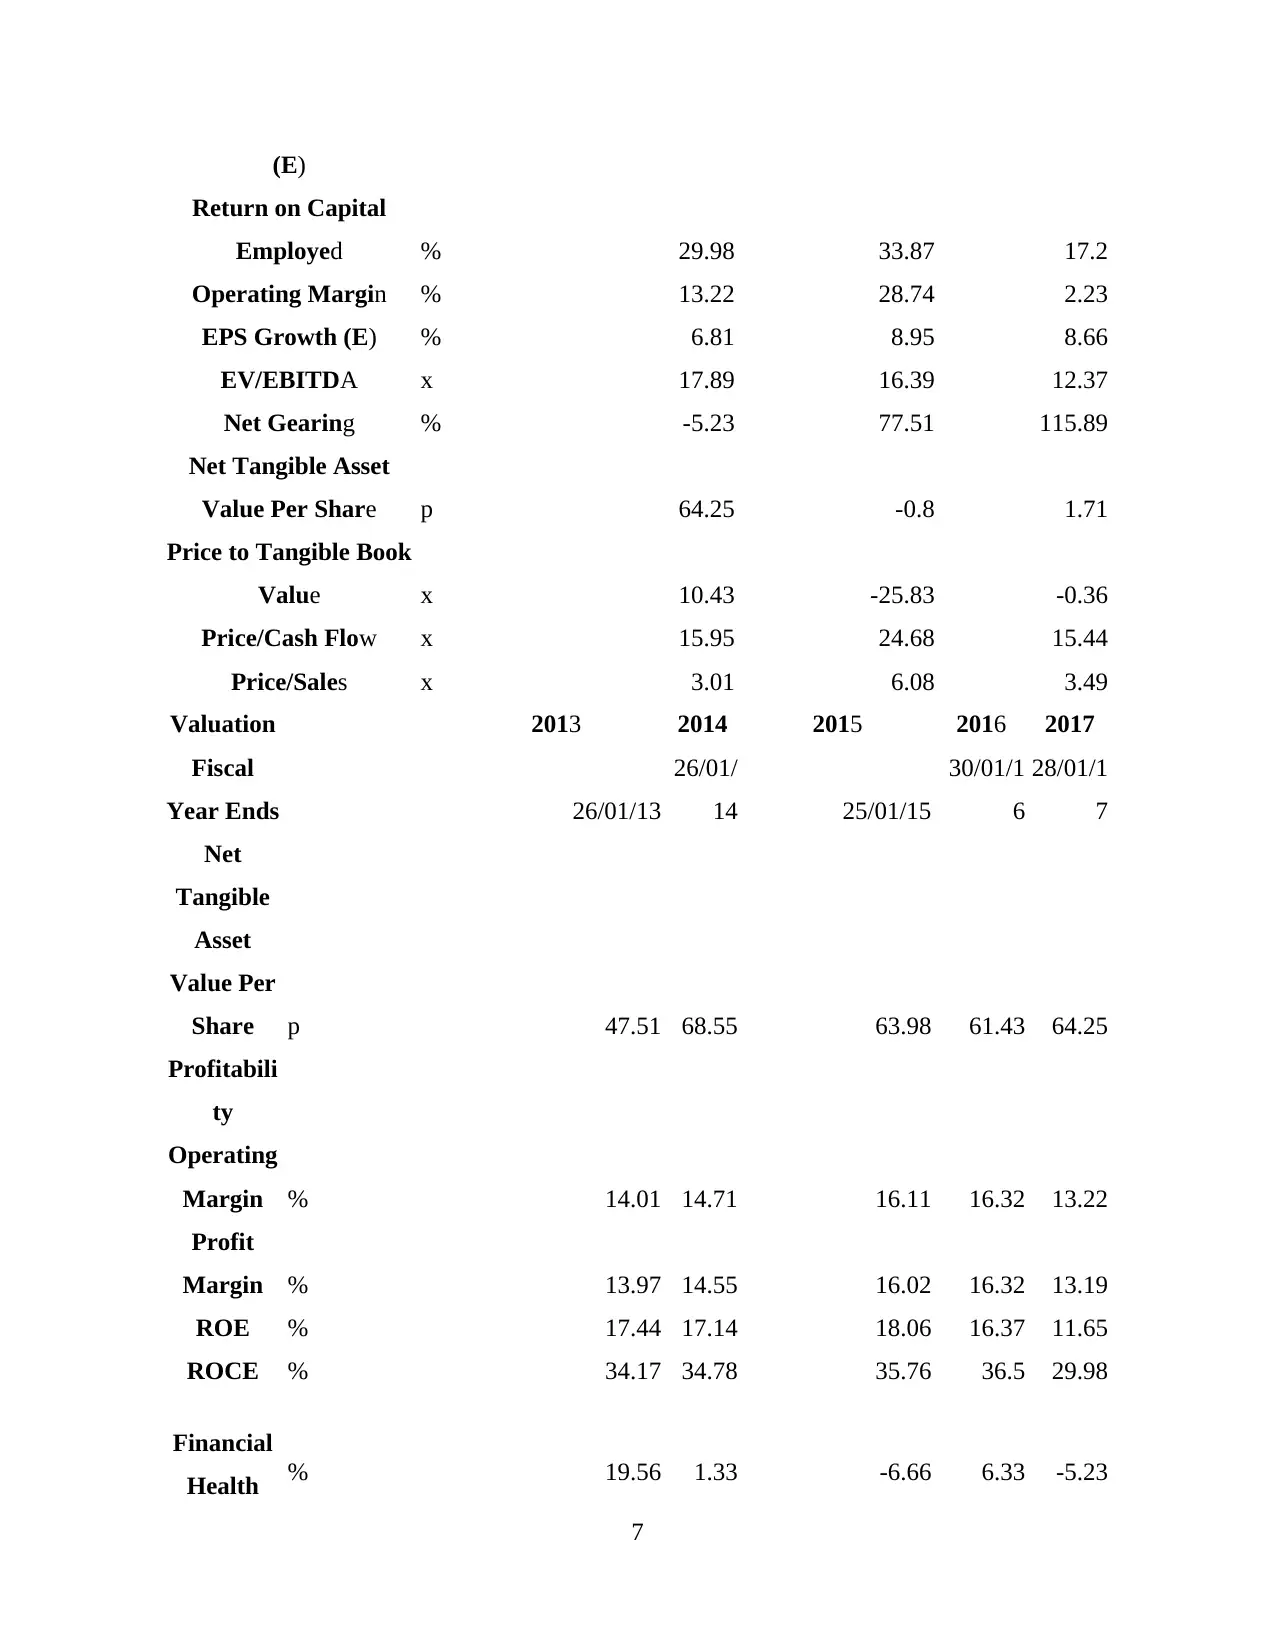
(E)
Return on Capital
Employed % 29.98 33.87 17.2
Operating Margin % 13.22 28.74 2.23
EPS Growth (E) % 6.81 8.95 8.66
EV/EBITDA x 17.89 16.39 12.37
Net Gearing % -5.23 77.51 115.89
Net Tangible Asset
Value Per Share p 64.25 -0.8 1.71
Price to Tangible Book
Value x 10.43 -25.83 -0.36
Price/Cash Flow x 15.95 24.68 15.44
Price/Sales x 3.01 6.08 3.49
Valuation 2013 2014 2015 2016 2017
Fiscal
Year Ends 26/01/13
26/01/
14 25/01/15
30/01/1
6
28/01/1
7
Net
Tangible
Asset
Value Per
Share p 47.51 68.55 63.98 61.43 64.25
Profitabili
ty
Operating
Margin % 14.01 14.71 16.11 16.32 13.22
Profit
Margin % 13.97 14.55 16.02 16.32 13.19
ROE % 17.44 17.14 18.06 16.37 11.65
ROCE % 34.17 34.78 35.76 36.5 29.98
Financial
Health % 19.56 1.33 -6.66 6.33 -5.23
7
⊘ This is a preview!⊘
Do you want full access?
Subscribe today to unlock all pages.
Trusted by 1+ million students worldwide
Net
Gearing
Gross
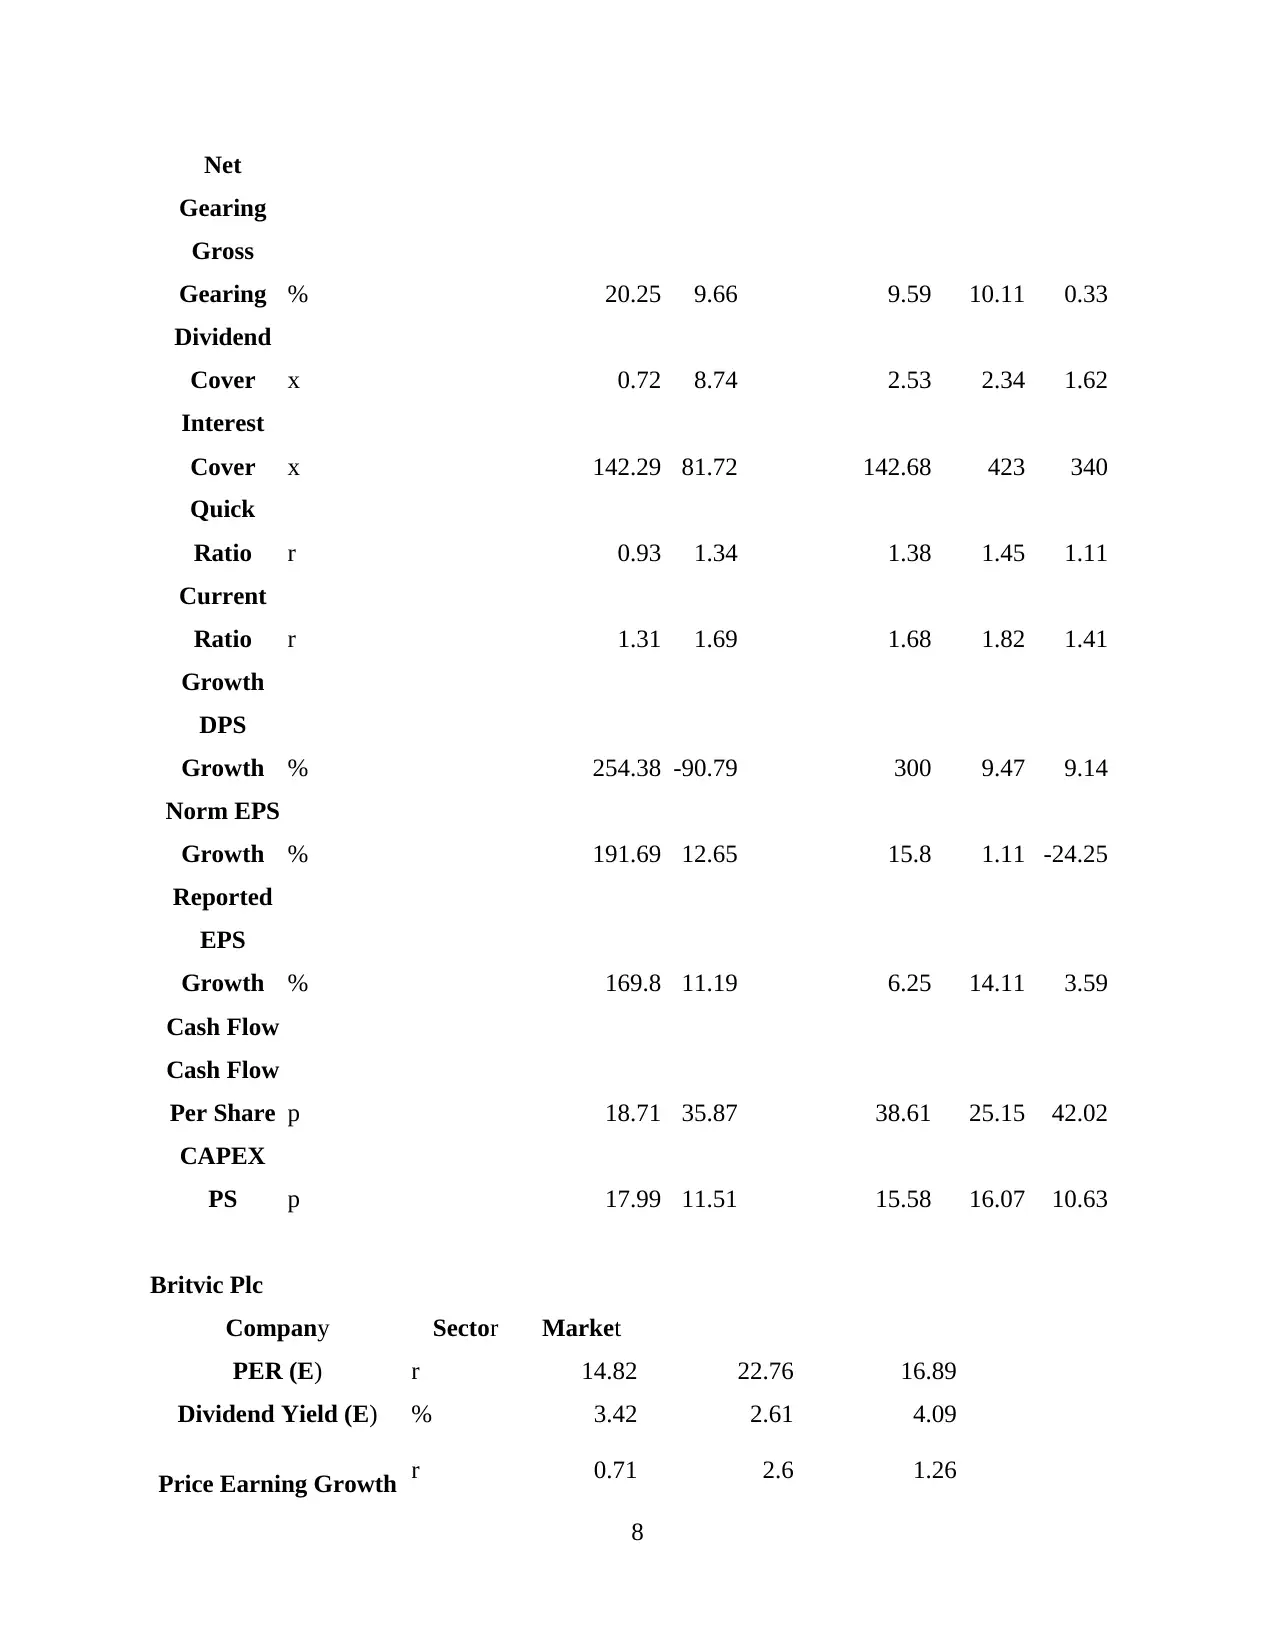
Gearing % 20.25 9.66 9.59 10.11 0.33
Dividend
Cover x 0.72 8.74 2.53 2.34 1.62
Interest
Cover x 142.29 81.72 142.68 423 340
Quick
Ratio r 0.93 1.34 1.38 1.45 1.11
Current
Ratio r 1.31 1.69 1.68 1.82 1.41
Growth
DPS
Growth % 254.38 -90.79 300 9.47 9.14
Norm EPS
Growth % 191.69 12.65 15.8 1.11 -24.25
Reported
EPS
Growth % 169.8 11.19 6.25 14.11 3.59
Cash Flow
Cash Flow
Per Share p 18.71 35.87 38.61 25.15 42.02
CAPEX
PS p 17.99 11.51 15.58 16.07 10.63
Britvic Plc
Company Sector Market
PER (E) r 14.82 22.76 16.89
Dividend Yield (E) % 3.42 2.61 4.09
Price Earning Growth r 0.71 2.6 1.26
8
Gearing
Gross
Gearing % 20.25 9.66 9.59 10.11 0.33
Dividend
Cover x 0.72 8.74 2.53 2.34 1.62
Interest
Cover x 142.29 81.72 142.68 423 340
Quick
Ratio r 0.93 1.34 1.38 1.45 1.11
Current
Ratio r 1.31 1.69 1.68 1.82 1.41
Growth
DPS
Growth % 254.38 -90.79 300 9.47 9.14
Norm EPS
Growth % 191.69 12.65 15.8 1.11 -24.25
Reported
EPS
Growth % 169.8 11.19 6.25 14.11 3.59
Cash Flow
Cash Flow
Per Share p 18.71 35.87 38.61 25.15 42.02
CAPEX
PS p 17.99 11.51 15.58 16.07 10.63
Britvic Plc
Company Sector Market
PER (E) r 14.82 22.76 16.89
Dividend Yield (E) % 3.42 2.61 4.09
Price Earning Growth r 0.71 2.6 1.26
8
Paraphrase This Document
Need a fresh take? Get an instant paraphrase of this document with our AI Paraphraser
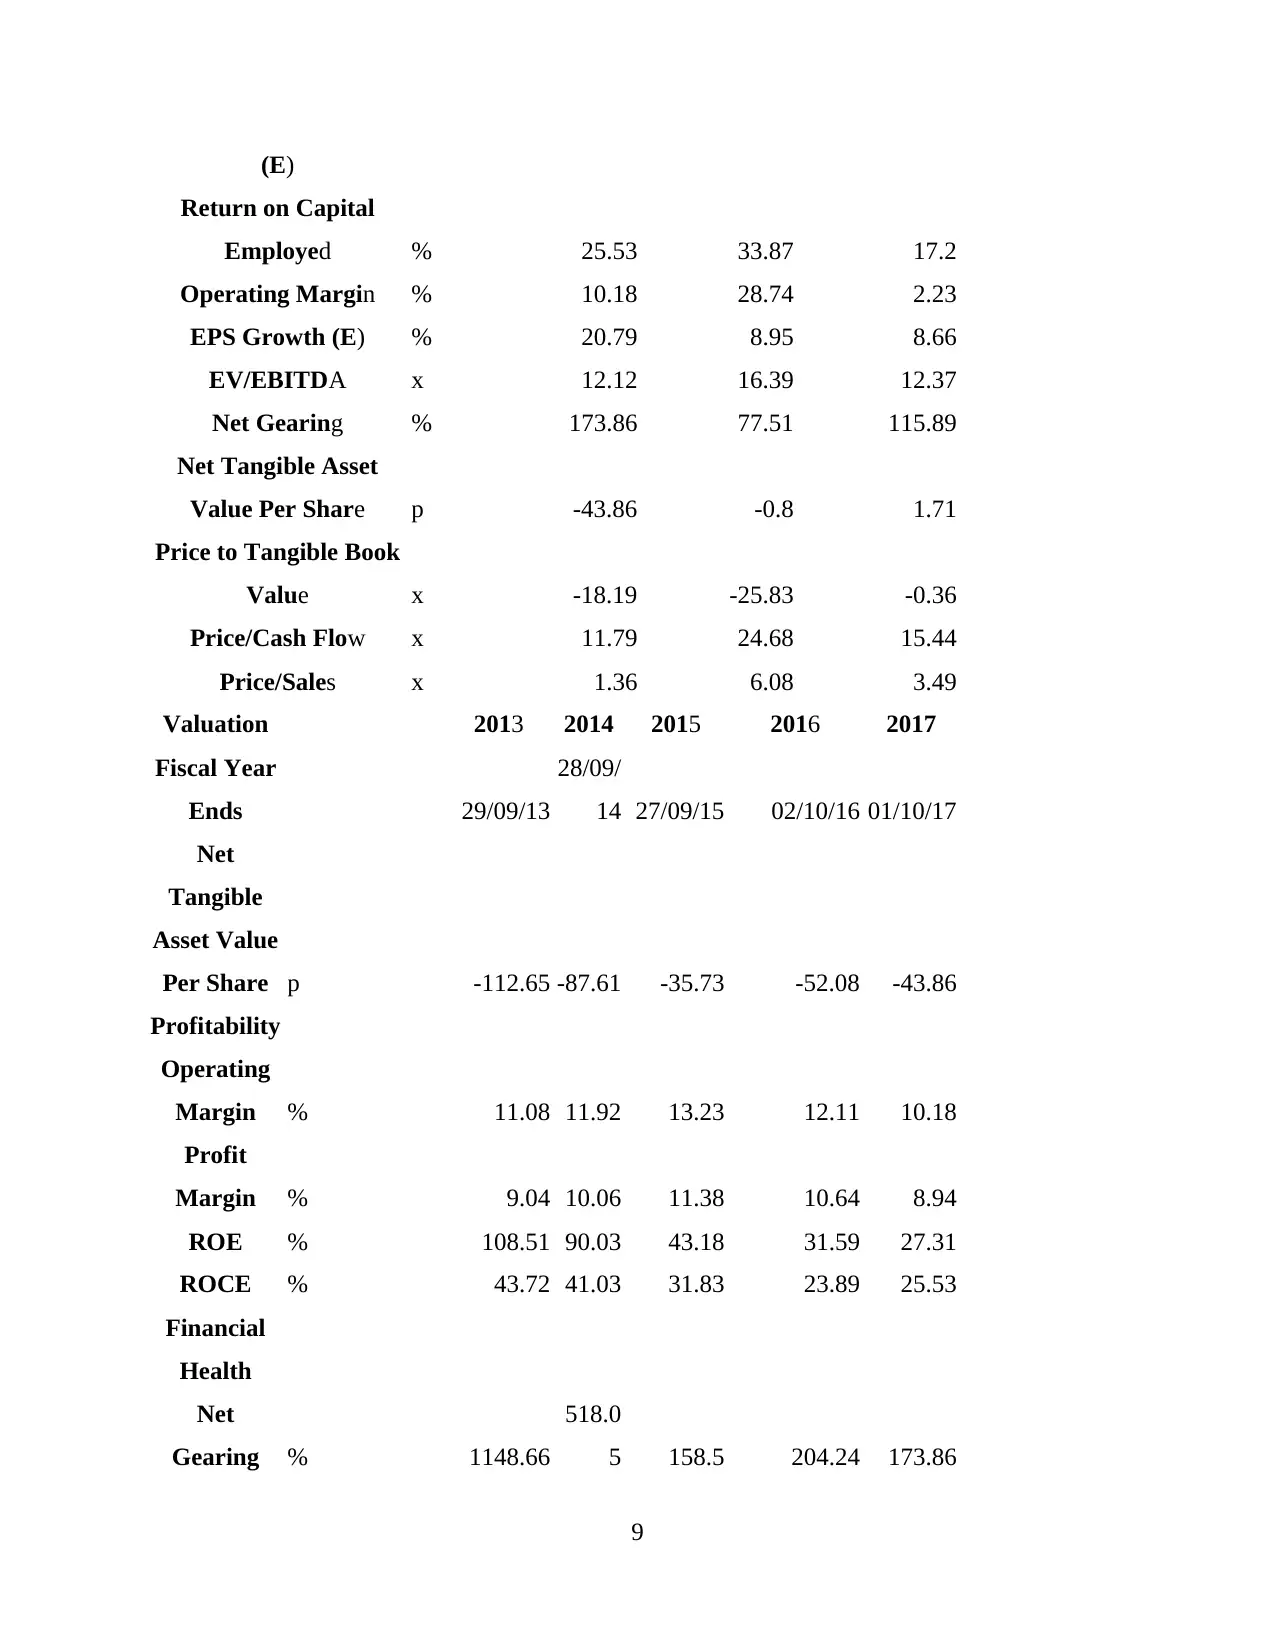
(E)
Return on Capital
Employed % 25.53 33.87 17.2
Operating Margin % 10.18 28.74 2.23
EPS Growth (E) % 20.79 8.95 8.66
EV/EBITDA x 12.12 16.39 12.37
Net Gearing % 173.86 77.51 115.89
Net Tangible Asset
Value Per Share p -43.86 -0.8 1.71
Price to Tangible Book
Value x -18.19 -25.83 -0.36
Price/Cash Flow x 11.79 24.68 15.44
Price/Sales x 1.36 6.08 3.49
Valuation 2013 2014 2015 2016 2017
Fiscal Year
Ends 29/09/13
28/09/
14 27/09/15 02/10/16 01/10/17
Net
Tangible
Asset Value
Per Share p -112.65 -87.61 -35.73 -52.08 -43.86
Profitability
Operating
Margin % 11.08 11.92 13.23 12.11 10.18
Profit
Margin % 9.04 10.06 11.38 10.64 8.94
ROE % 108.51 90.03 43.18 31.59 27.31
ROCE % 43.72 41.03 31.83 23.89 25.53
Financial
Health
Net
Gearing % 1148.66
518.0
5 158.5 204.24 173.86
9
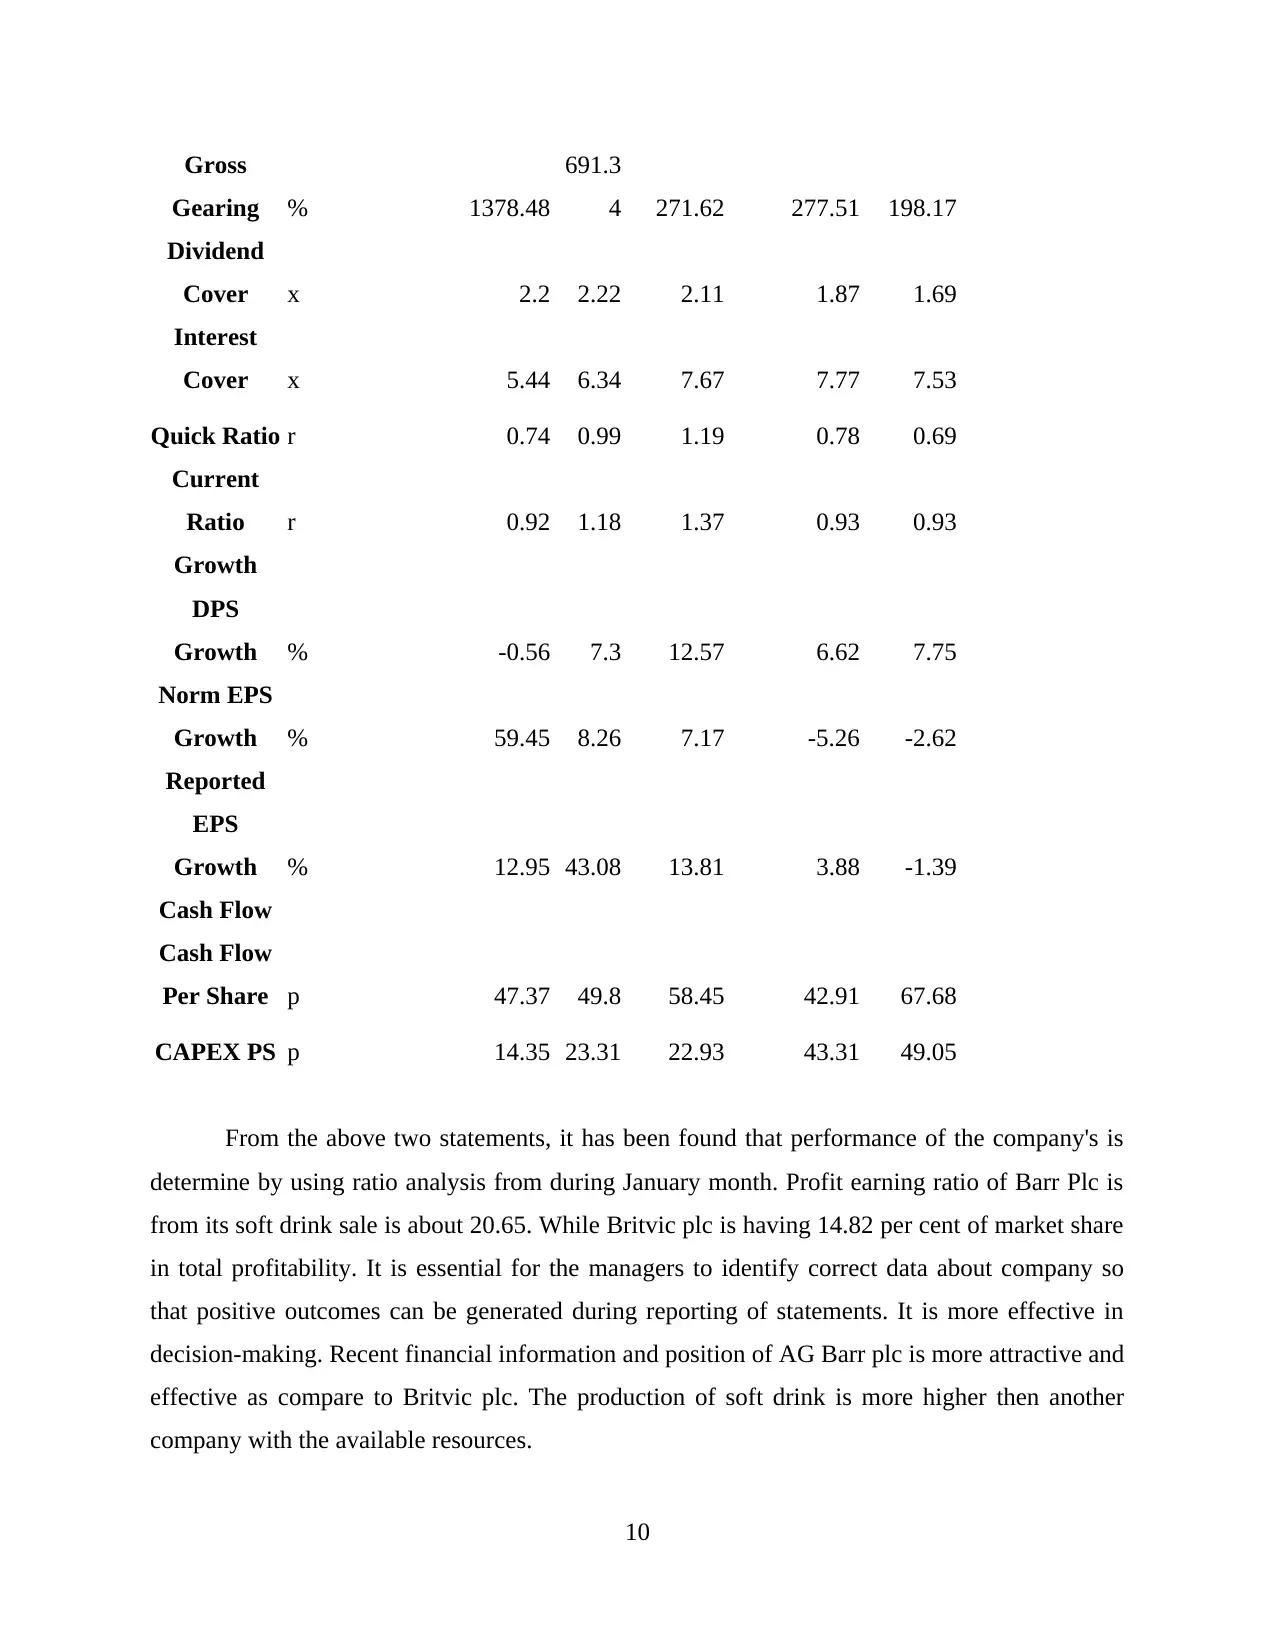
Gross
Gearing % 1378.48
691.3
4 271.62 277.51 198.17
Dividend
Cover x 2.2 2.22 2.11 1.87 1.69
Interest
Cover x 5.44 6.34 7.67 7.77 7.53
Quick Ratio r 0.74 0.99 1.19 0.78 0.69
Current
Ratio r 0.92 1.18 1.37 0.93 0.93
Growth
DPS
Growth % -0.56 7.3 12.57 6.62 7.75
Norm EPS
Growth % 59.45 8.26 7.17 -5.26 -2.62
Reported
EPS
Growth % 12.95 43.08 13.81 3.88 -1.39
Cash Flow
Cash Flow
Per Share p 47.37 49.8 58.45 42.91 67.68
CAPEX PS p 14.35 23.31 22.93 43.31 49.05
From the above two statements, it has been found that performance of the company's is
determine by using ratio analysis from during January month. Profit earning ratio of Barr Plc is
from its soft drink sale is about 20.65. While Britvic plc is having 14.82 per cent of market share
in total profitability. It is essential for the managers to identify correct data about company so
that positive outcomes can be generated during reporting of statements. It is more effective in
decision-making. Recent financial information and position of AG Barr plc is more attractive and
effective as compare to Britvic plc. The production of soft drink is more higher then another
company with the available resources.
10
⊘ This is a preview!⊘
Do you want full access?
Subscribe today to unlock all pages.
Trusted by 1+ million students worldwide
1 out of 17
Related Documents


Your All-in-One AI-Powered Toolkit for Academic Success.
+13062052269
info@desklib.com
Available 24*7 on WhatsApp / Email
![[object Object]](/_next/static/media/star-bottom.7253800d.svg)
Unlock your academic potential
Copyright © 2020–2026 A2Z Services. All Rights Reserved. Developed and managed by ZUCOL.