Analysis of Financial Performance: Abilene Oil and Gas Limited Report
VerifiedAdded on 2020/05/16
|10
|2365
|93
Report
AI Summary
This report provides a comprehensive financial performance analysis of Abilene Oil and Gas Limited, an Australian oil and gas company. The analysis includes the calculation of key financial ratios such as Return on Assets (ROA), Return on Equity (ROE), and the debt ratio, revealing trends from 2014 to 2017. The report also estimates the Weighted Average Cost of Capital (WACC), examines stock price movements, and discusses the company's dividend policy. The analysis reveals a fluctuating financial performance, with negative ROE in recent years and an increasing debt ratio. The report also incorporates stock analysis using the Capital Asset Pricing Model (CAPM) and concludes with a recommendation against including the company in an investment portfolio due to its poor performance. The report utilizes financial data from the company's annual reports, stock market data, and announcements made by the company. Furthermore, the report uses the DuPont analysis to break down ROE into its components like total assets, net profit, owner’s equity and EBIT.

Running Head: FINANCE FOR BUSINESS
financial performance analysis
financial performance analysis
Paraphrase This Document
Need a fresh take? Get an instant paraphrase of this document with our AI Paraphraser
Finance for business 1
Contents
Introduction...........................................................................................................................................2
About the company................................................................................................................................2
Structure of Governance and ownership................................................................................................2
Calculation of key ratios........................................................................................................................2
Share price analysis...............................................................................................................................4
Announcements made...........................................................................................................................5
Stock analysis........................................................................................................................................5
Computation of WACC.........................................................................................................................7
Debt Ratio analysis................................................................................................................................7
Dividend policy.....................................................................................................................................7
Recommendation...................................................................................................................................8
References.............................................................................................................................................9
Finance for business 2
Introduction
The report contains an overall analysis of company’s financial performance. It includes the
calculation of key ratios like ROA, ROE and debt ratio. It also includes the estimation of
WACC, analysis of debt ratio and details about the movements in stock prices and dividend
policy followed by the company.
About the company
Abilene Oil and Gas Limited is an Australian company engaged in production, development
and exploration of resources, focusing on oil and gas. It operates in the exploration sector
within United States. The strategy of the company is to build oil production assets, increase
drilling location and to add exploration possessions in the region. The main aim of Abilene is
to target high return projects and raise funds by keeping the overheads and corporate costs
low. It holds interest in projects like Klick East Oil field, Welch-Bornholdt Wherry project,
Kinsley Prospect situated in Oklahoma and Kanas and many other projects. The company is
listed on ASX with a ticker ASX: ABL (Abilene.com.au, 2018).
Structure of Governance and ownership
Main substantial shareholders
20% or more shareholdings: Holdrey Pty Ltd with a holding of 23.73%
More than 5% shareholdings: Zaimo Nominees Pty Ltd (15.36%), Bond Street
Custodians Limited (14.24%), Bond Street Custodian Limited (10.78%), PJP Group
Pty Ltd (5.82%), Mr Itzchak Benedikt + Mrs Rozette Benedikt (5%).
Main people involved in firm governance
The Chairman: Mr Paul Salter (Non- Executive)
Board members: Mr Craig Donald Mathieson and Mr Mordechai Benedikt (Non-
Executive Directors).
Neither of these members are involved in more than 20% shareholding nor is any shareholder
of more than 5% holding involved in firm governance.
Calculation of key ratios
1. ROA and ROE
Financial data for the years 2014 to 2017 has been taken from the annual reports of the
company.
Abilene oil and gas Limited Financial Statements for year 2014-16
Particulars 2014 2015 2016 2017
AUD
$ AUD$ AUD$ AUD$
EBIT -1,917,303 -6,632,562 -806,714 -2907657
Net profit 2,048,588 5,540,642 -882,696 -3495060
Total Assets 6,118,655 5,100,430 8,547,292 6,085,976
Total Liabilities 879,401 306,191 4,049,933 5,123,677
⊘ This is a preview!⊘
Do you want full access?
Subscribe today to unlock all pages.
Trusted by 1+ million students worldwide
Finance for business 3
Shareholders' Equity 5,239,254 4,794,239 4,497,359 962,299
1. Rate of Return on Assets
2014 2015 2016 2017
A. Net income 2,048,588 5,540,642 -882,696 -3,495,060
B. Total assets 6,118,655 5,100,430 8,547,292 6,085,976
(A/B) 33.48% 109% -10% -57%
2. Rate of Return on Equity
2014 2015 2016 2017
A. Net income available to equity
shareholders 2,048,588 5,540,642 -882,696 -
3,495,060
B. Shareholder’s Equity 5,239,254 4,794,239 4,497,359 962,299
(A/B) 39.10% 115.57% -19.63% -363.20%
3. Debt Ratio
2014 2015 2016 2017
A. Total Liabilities 879,401 306,191 4,049,93
3 5,123,677
B. Total assets 6,118,655 5,100,430 8,547,29
2 6,085,976
(A/B) 14% 6% 47% 84%
Proving the equation
EBIT
TA X NPAT
EBIT X TA
OE = NPAT
OE
2014 2015 2016 2017
AUD
$ AUD$
AUD
$ AUD$
EBIT -1,917,303 -6,632,562 -806,714 -2,907,657
NPAT 2,048,588 5,540,642 -882,696 -3,495,060
OE 5,239,254 4,794,239 4,497,359 962,299
TA 6,118,655 5,100,430 8,547,292 6,085,976
EBIT/TA (1) 0 -1 0 0
NPAT/EBIT (2) - 1.07 - 0.84 1.09 1.20
Paraphrase This Document
Need a fresh take? Get an instant paraphrase of this document with our AI Paraphraser
Finance for business 4
TA/OE (3) 1.17 1.06 1.90 6.32
NPAT/OE (4) 0.39 1.16 - 0.20 - 3.63
1*2*3 = 4 0.39 1.16 - 0.20 - 3.63
2. The variable TA/ OE reflects the concept of DuPont analysis, in which it is used as an
equity multiplier. The analysis breaks down ROE into its components like total assets,
net profit, owner’s equity and EBIT. The equity multiplier is used to measure the
changes in ROE with respect to the changes in its components. Fluctuations in the
multiplier do affect the relationship between return on assets and return on equity. In
regards to ROA, equity multiplier has negative or no relationship with this ratio. A
high multiplier denotes high degree of financial leverage and increase in it will result
in rise of ROE and fall of ROA. When sales increases, ROA rises making the ROE to
increase but the variable TA/OE remains the same. Hence changes in the return on
asset ratio does not affect equity multiplier, but both can equally bring changes in
ROE (Leach and Melicher, 2011).
3. In 2014 and 2015, company’s ROE was greater than its ROA and especially in year
2015, company had the highest profits resulting in a huge increase in its return on
equity ratio as compare to 2014. Moreover, with an upsurge in its net income, the
owners’ equity had fall in the same year which boosts up the ROE. The company
made losses in the next two years, resulting in negative ratios. A major fall in ROE
can be noticed in 2016 and 2017 as compare to ROA. The negative profits are the
reason for negative returns (Wright, et. al. 2013).
Share price analysis
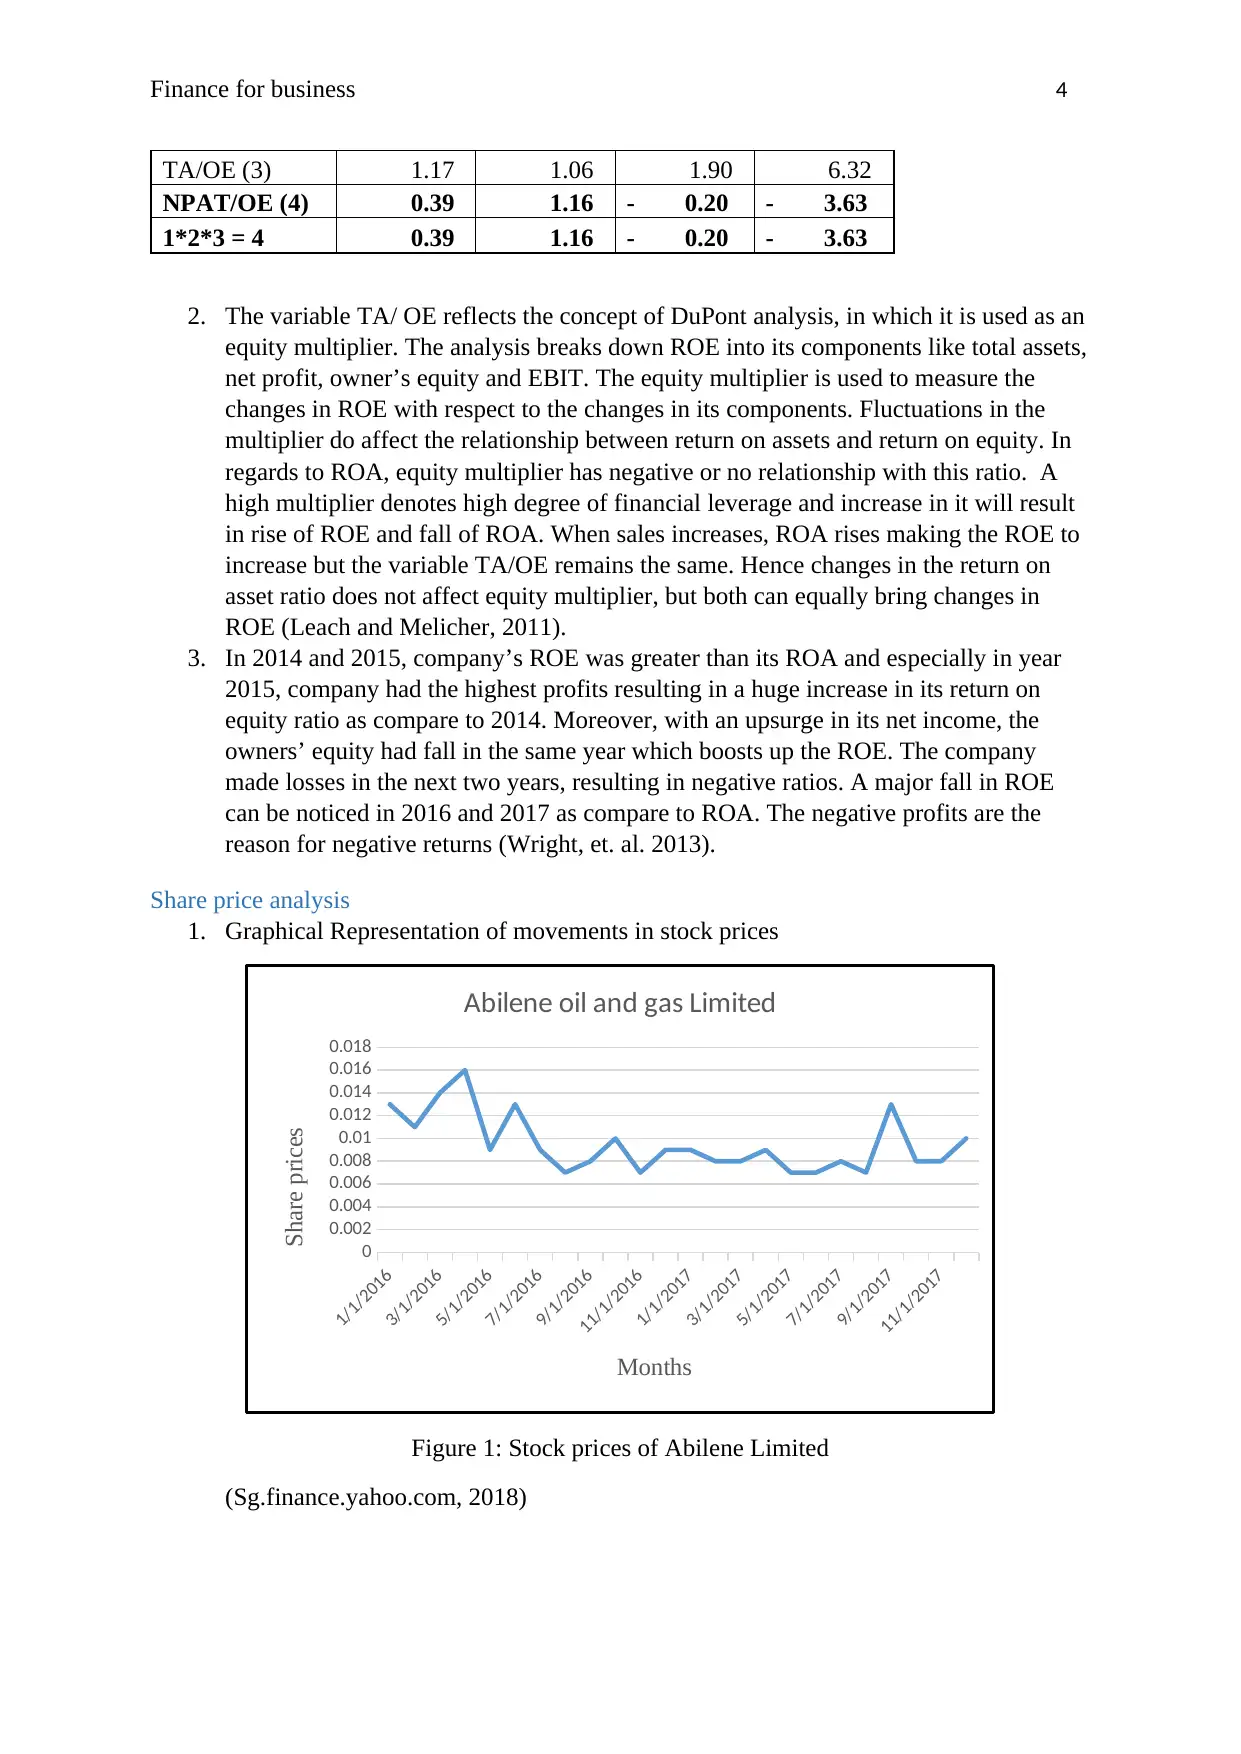
1. Graphical Representation of movements in stock prices
1/1/2016
3/1/2016
5/1/2016
7/1/2016
9/1/2016
11/1/2016
1/1/2017
3/1/2017
5/1/2017
7/1/2017
9/1/2017
11/1/2017
0
0.002
0.004
0.006
0.008
0.01
0.012
0.014
0.016
0.018
Abilene oil and gas Limited
Months
Share prices
Figure 1: Stock prices of Abilene Limited
(Sg.finance.yahoo.com, 2018)
TA/OE (3) 1.17 1.06 1.90 6.32
NPAT/OE (4) 0.39 1.16 - 0.20 - 3.63
1*2*3 = 4 0.39 1.16 - 0.20 - 3.63
2. The variable TA/ OE reflects the concept of DuPont analysis, in which it is used as an
equity multiplier. The analysis breaks down ROE into its components like total assets,
net profit, owner’s equity and EBIT. The equity multiplier is used to measure the
changes in ROE with respect to the changes in its components. Fluctuations in the
multiplier do affect the relationship between return on assets and return on equity. In
regards to ROA, equity multiplier has negative or no relationship with this ratio. A
high multiplier denotes high degree of financial leverage and increase in it will result
in rise of ROE and fall of ROA. When sales increases, ROA rises making the ROE to
increase but the variable TA/OE remains the same. Hence changes in the return on
asset ratio does not affect equity multiplier, but both can equally bring changes in
ROE (Leach and Melicher, 2011).
3. In 2014 and 2015, company’s ROE was greater than its ROA and especially in year
2015, company had the highest profits resulting in a huge increase in its return on
equity ratio as compare to 2014. Moreover, with an upsurge in its net income, the
owners’ equity had fall in the same year which boosts up the ROE. The company
made losses in the next two years, resulting in negative ratios. A major fall in ROE
can be noticed in 2016 and 2017 as compare to ROA. The negative profits are the
reason for negative returns (Wright, et. al. 2013).
Share price analysis
1. Graphical Representation of movements in stock prices
1/1/2016
3/1/2016
5/1/2016
7/1/2016
9/1/2016
11/1/2016
1/1/2017
3/1/2017
5/1/2017
7/1/2017
9/1/2017
11/1/2017
0
0.002
0.004
0.006
0.008
0.01
0.012
0.014
0.016
0.018
Abilene oil and gas Limited
Months
Share prices
Figure 1: Stock prices of Abilene Limited
(Sg.finance.yahoo.com, 2018)
Finance for business 5
1/1/2016
3/1/2016
5/1/2016
7/1/2016
9/1/2016
11/1/2016
1/1/2017
3/1/2017
5/1/2017
7/1/2017
9/1/2017
11/1/2017
-
1,000.00
2,000.00
3,000.00
4,000.00
5,000.00
6,000.00
7,000.00
All Ordinaries Index
Months
Share Prices
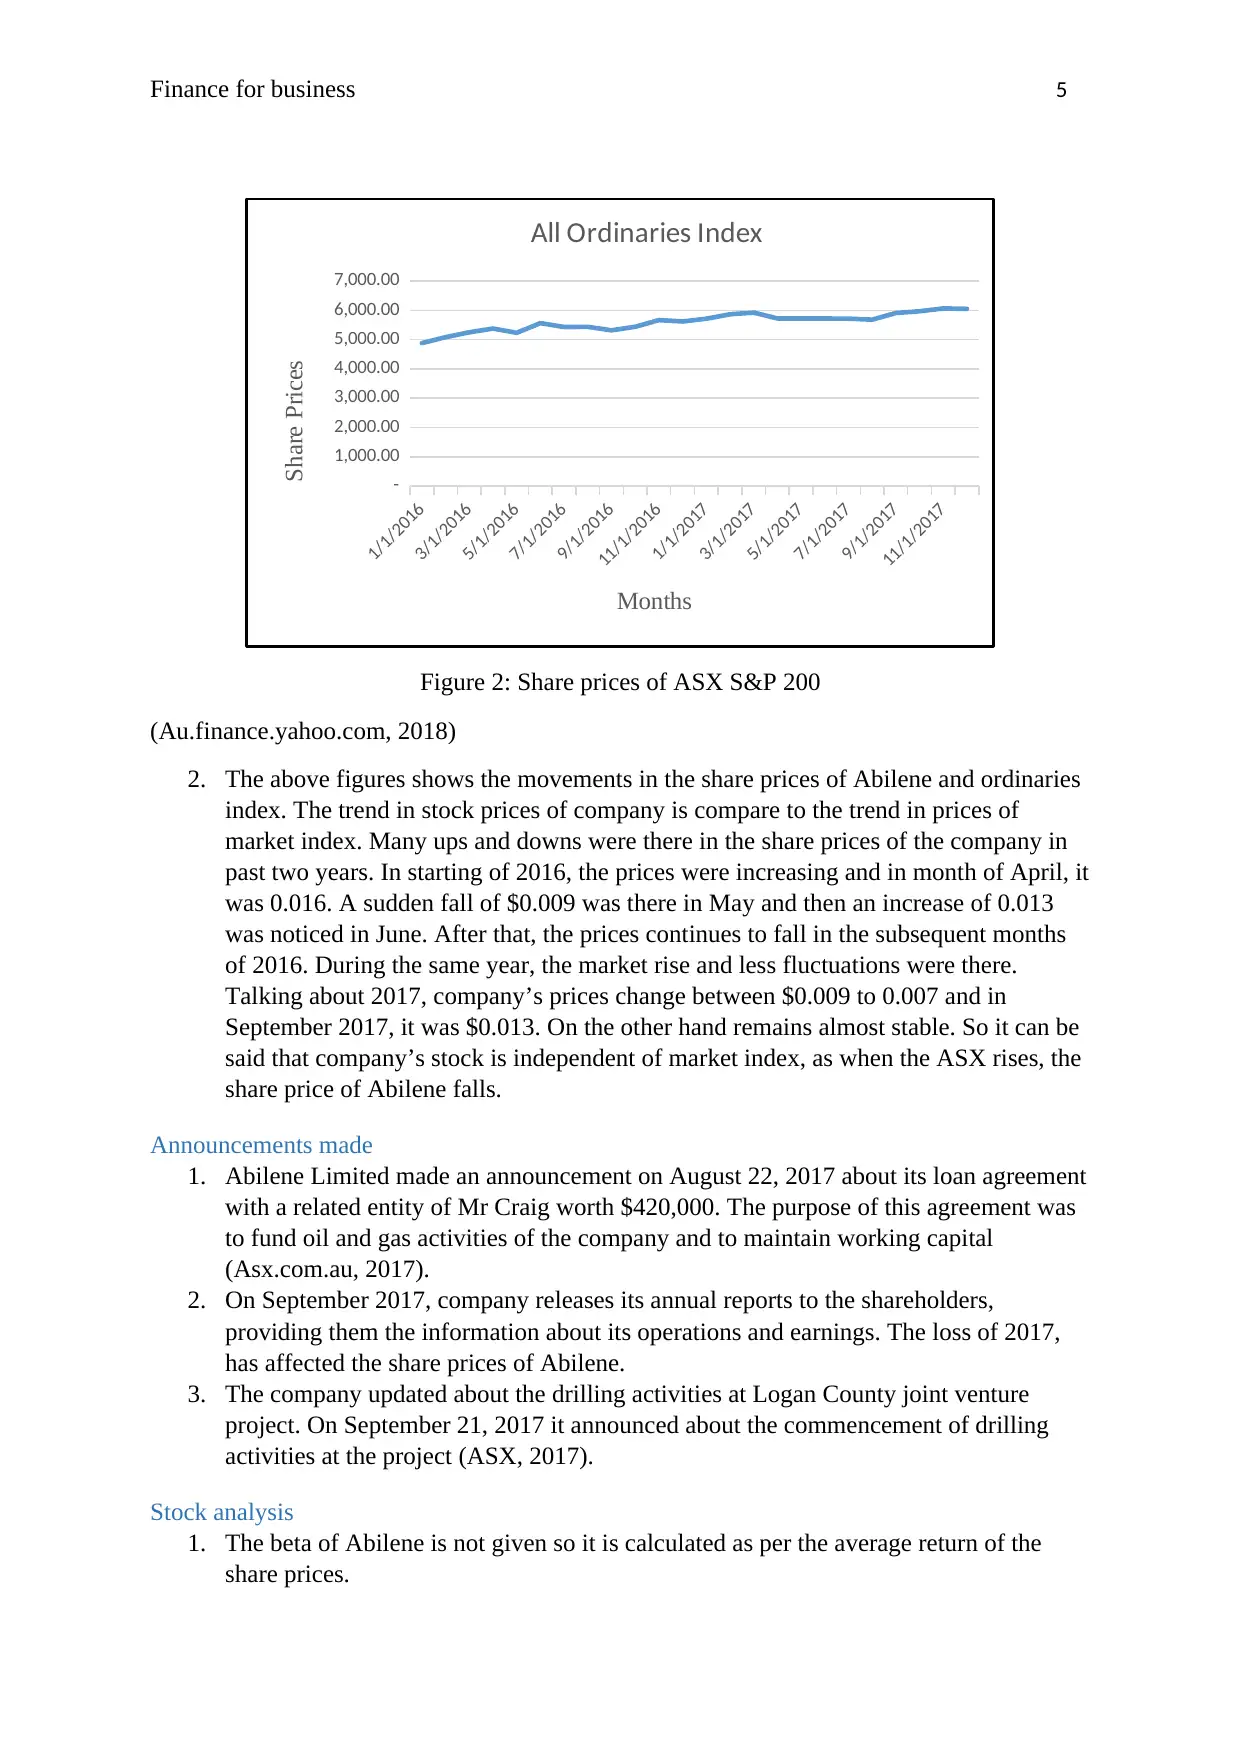
Figure 2: Share prices of ASX S&P 200
(Au.finance.yahoo.com, 2018)
2. The above figures shows the movements in the share prices of Abilene and ordinaries
index. The trend in stock prices of company is compare to the trend in prices of
market index. Many ups and downs were there in the share prices of the company in
past two years. In starting of 2016, the prices were increasing and in month of April, it
was 0.016. A sudden fall of $0.009 was there in May and then an increase of 0.013
was noticed in June. After that, the prices continues to fall in the subsequent months
of 2016. During the same year, the market rise and less fluctuations were there.
Talking about 2017, company’s prices change between $0.009 to 0.007 and in
September 2017, it was $0.013. On the other hand remains almost stable. So it can be
said that company’s stock is independent of market index, as when the ASX rises, the
share price of Abilene falls.
Announcements made
1. Abilene Limited made an announcement on August 22, 2017 about its loan agreement
with a related entity of Mr Craig worth $420,000. The purpose of this agreement was
to fund oil and gas activities of the company and to maintain working capital
(Asx.com.au, 2017).
2. On September 2017, company releases its annual reports to the shareholders,
providing them the information about its operations and earnings. The loss of 2017,
has affected the share prices of Abilene.
3. The company updated about the drilling activities at Logan County joint venture
project. On September 21, 2017 it announced about the commencement of drilling
activities at the project (ASX, 2017).
Stock analysis
1. The beta of Abilene is not given so it is calculated as per the average return of the
share prices.
1/1/2016
3/1/2016
5/1/2016
7/1/2016
9/1/2016
11/1/2016
1/1/2017
3/1/2017
5/1/2017
7/1/2017
9/1/2017
11/1/2017
-
1,000.00
2,000.00
3,000.00
4,000.00
5,000.00
6,000.00
7,000.00
All Ordinaries Index
Months
Share Prices
Figure 2: Share prices of ASX S&P 200
(Au.finance.yahoo.com, 2018)
2. The above figures shows the movements in the share prices of Abilene and ordinaries
index. The trend in stock prices of company is compare to the trend in prices of
market index. Many ups and downs were there in the share prices of the company in
past two years. In starting of 2016, the prices were increasing and in month of April, it
was 0.016. A sudden fall of $0.009 was there in May and then an increase of 0.013
was noticed in June. After that, the prices continues to fall in the subsequent months
of 2016. During the same year, the market rise and less fluctuations were there.
Talking about 2017, company’s prices change between $0.009 to 0.007 and in
September 2017, it was $0.013. On the other hand remains almost stable. So it can be
said that company’s stock is independent of market index, as when the ASX rises, the
share price of Abilene falls.
Announcements made
1. Abilene Limited made an announcement on August 22, 2017 about its loan agreement
with a related entity of Mr Craig worth $420,000. The purpose of this agreement was
to fund oil and gas activities of the company and to maintain working capital
(Asx.com.au, 2017).
2. On September 2017, company releases its annual reports to the shareholders,
providing them the information about its operations and earnings. The loss of 2017,
has affected the share prices of Abilene.
3. The company updated about the drilling activities at Logan County joint venture
project. On September 21, 2017 it announced about the commencement of drilling
activities at the project (ASX, 2017).
Stock analysis
1. The beta of Abilene is not given so it is calculated as per the average return of the
share prices.
⊘ This is a preview!⊘
Do you want full access?
Subscribe today to unlock all pages.
Trusted by 1+ million students worldwide
Finance for business 6
SUMMARY
OUTPUT
Regression
Statistics
Multiple R
0.357390
78
R Square
0.127728
169
Adjusted R
Square
0.086191
416
Standard Error
0.284319
251
Observations 23
ANOVA
df SS MS F
Signif
icanc
e F
Regression 1
0.2485
80278
0.2485
80278
3.075
0638
0.094
08696
4
Residual 21
1.6975
86169
0.0808
37437
Total 22
1.9461
66447
Coefficie
nts
Standa
rd
Error t Stat
P-
value
Lowe
r 95%
Uppe
r 95%
Lowe
r
95.0
%
Upper
95.0%
Intercept
-
0.013301
134
0.0638
41209
-
0.2083
47152
0.836
9654
-
0.146
06619
7
0.119
4639
-
0.146
06619
7
0.1194
6393
X Variable 1
4.295659
411
2.4496
42863
1.7535
85992
0.094
087
-
0.798
65180
2
9.389
9706
-
0.798
65180
2
9.3899
7062
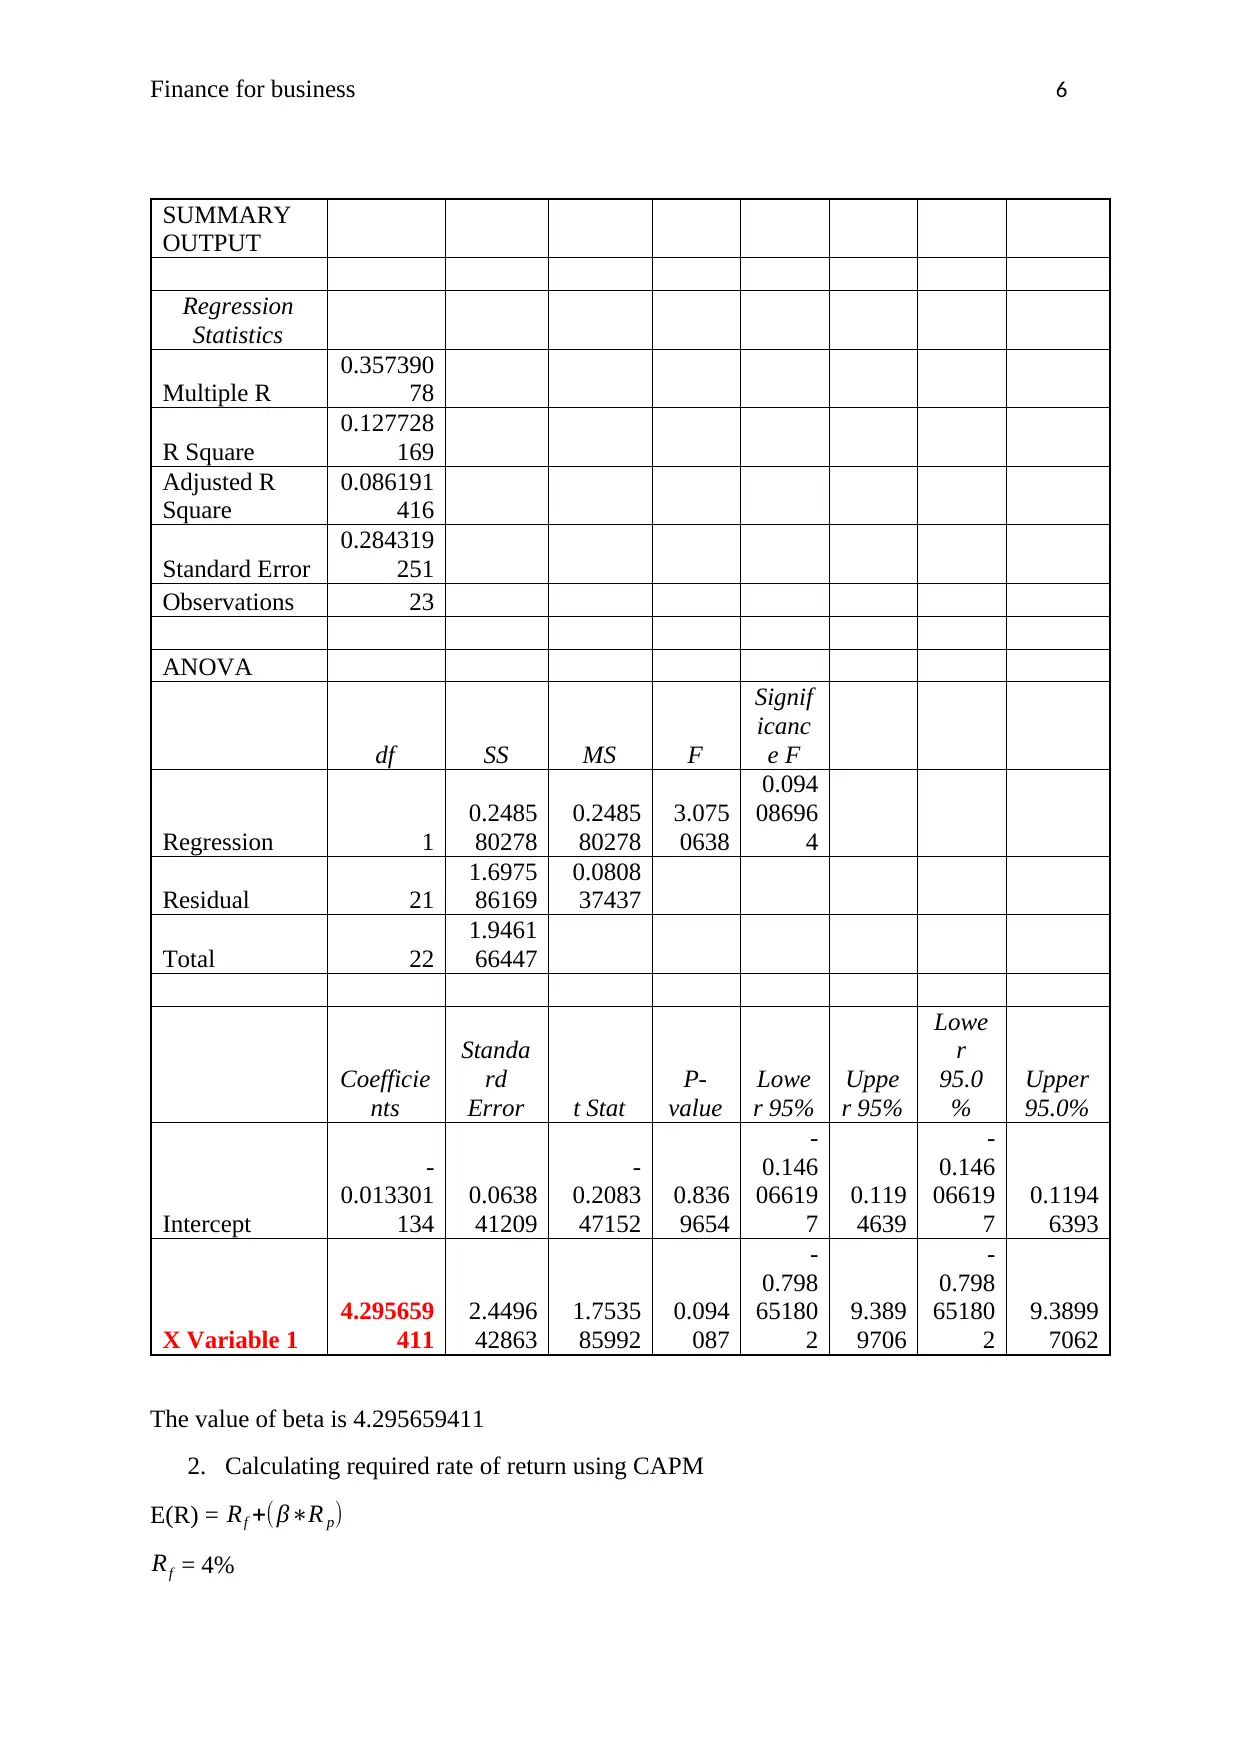
The value of beta is 4.295659411
2. Calculating required rate of return using CAPM
E(R) = Rf +( β∗R p)
Rf = 4%
SUMMARY
OUTPUT
Regression
Statistics
Multiple R
0.357390
78
R Square
0.127728
169
Adjusted R
Square
0.086191
416
Standard Error
0.284319
251
Observations 23
ANOVA
df SS MS F
Signif
icanc
e F
Regression 1
0.2485
80278
0.2485
80278
3.075
0638
0.094
08696
4
Residual 21
1.6975
86169
0.0808
37437
Total 22
1.9461
66447
Coefficie
nts
Standa
rd
Error t Stat
P-
value
Lowe
r 95%
Uppe
r 95%
Lowe
r
95.0
%
Upper
95.0%
Intercept
-
0.013301
134
0.0638
41209
-
0.2083
47152
0.836
9654
-
0.146
06619
7
0.119
4639
-
0.146
06619
7
0.1194
6393
X Variable 1
4.295659
411
2.4496
42863
1.7535
85992
0.094
087
-
0.798
65180
2
9.389
9706
-
0.798
65180
2
9.3899
7062
The value of beta is 4.295659411
2. Calculating required rate of return using CAPM
E(R) = Rf +( β∗R p)
Rf = 4%
Paraphrase This Document
Need a fresh take? Get an instant paraphrase of this document with our AI Paraphraser
Finance for business 7
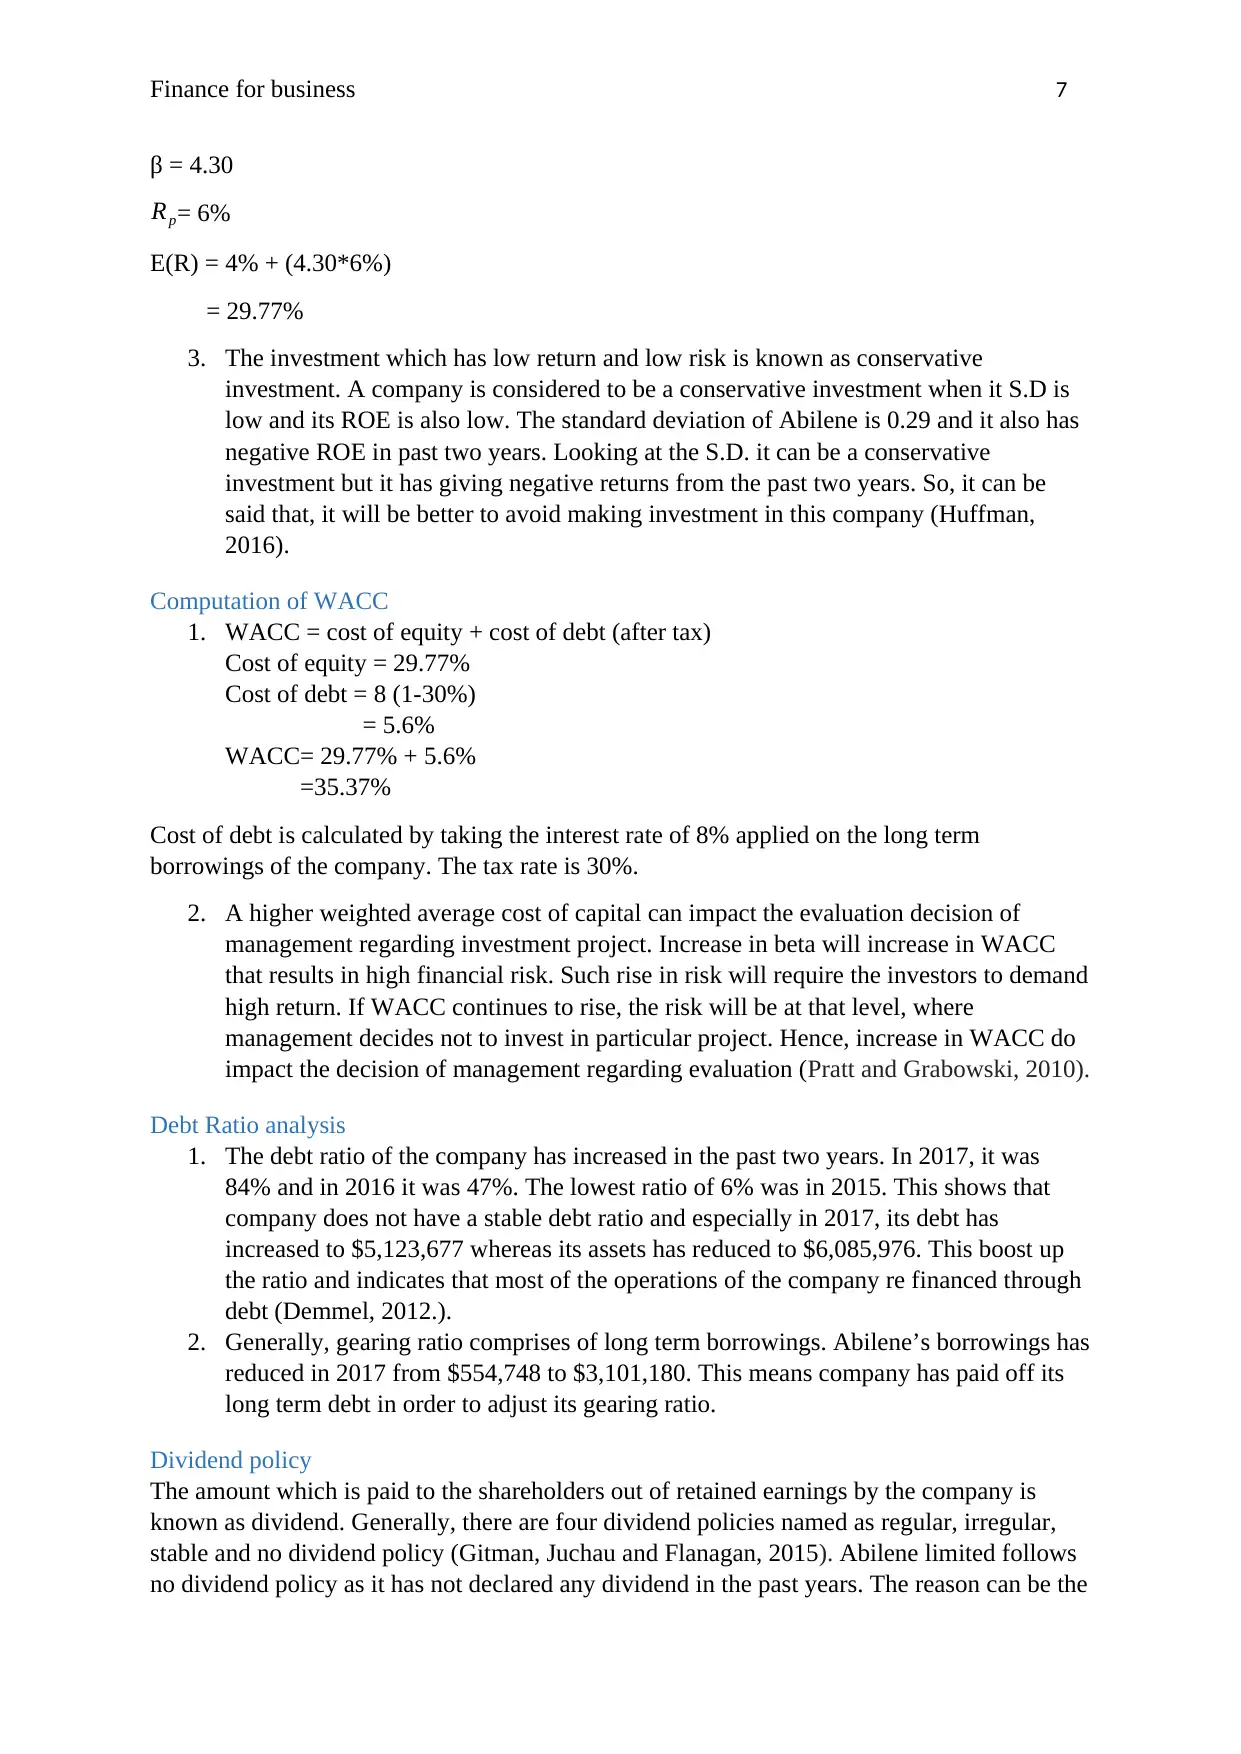
β = 4.30
Rp= 6%
E(R) = 4% + (4.30*6%)
= 29.77%
3. The investment which has low return and low risk is known as conservative
investment. A company is considered to be a conservative investment when it S.D is
low and its ROE is also low. The standard deviation of Abilene is 0.29 and it also has
negative ROE in past two years. Looking at the S.D. it can be a conservative
investment but it has giving negative returns from the past two years. So, it can be
said that, it will be better to avoid making investment in this company (Huffman,
2016).
Computation of WACC
1. WACC = cost of equity + cost of debt (after tax)
Cost of equity = 29.77%
Cost of debt = 8 (1-30%)
= 5.6%
WACC= 29.77% + 5.6%
=35.37%
Cost of debt is calculated by taking the interest rate of 8% applied on the long term
borrowings of the company. The tax rate is 30%.
2. A higher weighted average cost of capital can impact the evaluation decision of
management regarding investment project. Increase in beta will increase in WACC
that results in high financial risk. Such rise in risk will require the investors to demand
high return. If WACC continues to rise, the risk will be at that level, where
management decides not to invest in particular project. Hence, increase in WACC do
impact the decision of management regarding evaluation (Pratt and Grabowski, 2010).
Debt Ratio analysis
1. The debt ratio of the company has increased in the past two years. In 2017, it was
84% and in 2016 it was 47%. The lowest ratio of 6% was in 2015. This shows that
company does not have a stable debt ratio and especially in 2017, its debt has
increased to $5,123,677 whereas its assets has reduced to $6,085,976. This boost up
the ratio and indicates that most of the operations of the company re financed through
debt (Demmel, 2012.).
2. Generally, gearing ratio comprises of long term borrowings. Abilene’s borrowings has
reduced in 2017 from $554,748 to $3,101,180. This means company has paid off its
long term debt in order to adjust its gearing ratio.
Dividend policy
The amount which is paid to the shareholders out of retained earnings by the company is
known as dividend. Generally, there are four dividend policies named as regular, irregular,
stable and no dividend policy (Gitman, Juchau and Flanagan, 2015). Abilene limited follows
no dividend policy as it has not declared any dividend in the past years. The reason can be the
Finance for business 8
losses occurred due to the inefficiency in the operations. Company does not have enough
earnings to pay dividends to its shareholders.
Recommendation
After conducting the above analysis, it will be advisable not to include this company in an
investment portfolio because of its poor financial performance in past years, which can be
judged from its key ratios, its dividend policy and trend in its share prices. The ROE and
ROA both were negative, debt ratio increased and the falling trend was there in share prices.
Along with these, the company does not pay any dividend to its stockholders. Looking at all
these aspects, it will be better not to put this company on an investment portfolio.
⊘ This is a preview!⊘
Do you want full access?
Subscribe today to unlock all pages.
Trusted by 1+ million students worldwide
Finance for business 9
References
Abilene.com.au. (2018). Abilene Oil and Gas Limited | Development and Exploration.
[online] Available at: http://www.abilene.com.au/ [Accessed 30 Jan. 2018].
ASX. (2017). https://www.asx.com.au/asxpdf/20170921/pdf/43mjcdw3238m6q.pdf. [online]
Available at: https://www.asx.com.au/asxpdf/20170921/pdf/43mjcdw3238m6q.pdfhttps://
www.asx.com.au/asxpdf/20170921/pdf/43mjcdw3238m6q.pdf [Accessed 30 Jan. 2018].
Asx.com.au. (2017). https://www.asx.com.au/asxpdf/20170822/pdf/43llr6f9gr1sd1.pdf.
[online] Available at: https://www.asx.com.au/asxpdf/20170822/pdf/43llr6f9gr1sd1.pdf
[Accessed 30 Jan. 2018].
Au.finance.yahoo.com. (2018). ^AXJO Historical prices | S&P/ASX 200 Stock - Yahoo
Finance. [online] Available at: https://au.finance.yahoo.com/quote/%5EAXJO/history?
period1=1454092200&period2=1517250600&interval=1mo&filter=history&frequency=1mo
[Accessed 30 Jan. 2018].
Demmel, R., 2012. Fiscal policy, public debt and the term structure of interest rates (Vol.
476). Springer Science & Business Media.
Gitman, L.J., Juchau, R. and Flanagan, J., 2015. Principles of managerial finance. Pearson
Higher Education AU.
Huffman, B., 2016. Assessing the Risk of Conservative Investments. Journal of Applied
Financial Research, 1, p.42.
Leach, J.C. and Melicher, R.W., 2011. Entrepreneurial finance. Cengage Learning.
Pratt, S.P. and Grabowski, R.J., 2010. Cost of capital in litigation: applications and
examples (Vol. 647). John Wiley & Sons.
Sg.finance.yahoo.com. (2018). ABL.AX Key statistics | ABILENEOIL FPO Stock - Yahoo
Finance. [Online] Available at: https://sg.finance.yahoo.com/quote/ABL.AX/key-statistics?
p=ABL.AX [Accessed 30 Jan. 2018].
Wright, M., Siegel, D.S., Keasey, K. and Filatotchev, I. eds., 2013. The Oxford handbook of
corporate governance (Vol. 28). Oxford University Press.
1 out of 10
Related Documents


Your All-in-One AI-Powered Toolkit for Academic Success.
+13062052269
info@desklib.com
Available 24*7 on WhatsApp / Email
![[object Object]](/_next/static/media/star-bottom.7253800d.svg)
Unlock your academic potential
Copyright © 2020–2026 A2Z Services. All Rights Reserved. Developed and managed by ZUCOL.