Financial Accounting Assignment: Accent Group Limited Analysis Report
VerifiedAdded on 2021/09/13
|15
|3916
|51
Report
AI Summary
This financial analysis report examines Accent Group Limited, a company listed on the Australian Stock Exchange, focusing on its performance over the past three years. The report includes a detailed analysis of the company's balance sheet and profit and loss account using horizontal and vertical analysis techniques. Key financial ratios, such as profitability, liquidity, and gearing ratios, are analyzed to assess the company's financial health and performance trends. The analysis reveals insights into the company's revenue, expenses, and overall financial position, including changes in earnings per share and comprehensive income. The report concludes with an overall assessment of Accent Group Limited's financial performance and provides a comprehensive overview of the company's financial standing.
Financial Accounting
Assignment
Assignment
Paraphrase This Document
Need a fresh take? Get an instant paraphrase of this document with our AI Paraphraser
1
By student name
Professor
University
Date: 25 April 2018.
1 | P a g e
By student name
Professor
University
Date: 25 April 2018.
1 | P a g e
2
Executive Summary
A financial analysis report has been prepared on one of the companies, “Accent Group Limited”, which is
listed on the Australian Stock Exchange. The report does the in depth analysis of the company in terms
of performance over the past 3 years and how the same has transformed. The report highlights the
horizontal and vertical analysis of the balance sheet and profit and loss account of the company for
these years. Several key ratios like those of profitability, liquidity and the gearing ratios have also been
analysed to comment on the financial position and performance and whether the same has improved or
declined. Towards the end, the conclusion on the company for the overall performance.
2 | P a g e
⊘ This is a preview!⊘
Do you want full access?
Subscribe today to unlock all pages.
Trusted by 1+ million students worldwide
3
Table of Contents
Introduction.................................................................................................................................................4
Discussion and Analysis...............................................................................................................................4
Horizontal Analysis..................................................................................................................................4
Vertical Analysis.......................................................................................................................................7
Financial Ratio Analysis..........................................................................................................................11
Conclusion.................................................................................................................................................12
References.................................................................................................................................................13
3 | P a g e
Paraphrase This Document
Need a fresh take? Get an instant paraphrase of this document with our AI Paraphraser
4
Introduction
-
The financial analysis report has been prepared on one of the listed companies on Australian Stock
Exchange “Accent Group Limited”. The company was formerly known as RCG Corporation Limited and is
the leader in retail and distribution business of performance and lifestyle footwear in Australia and New
Zealand. It has over 420 stores and has been operating under 10 retail banners and 10 international
brands. Some of the top most and leading brands include The Athlete’s Foot, Hype DC, Platypus Shoes,
Podium Sports, Skechers, Merrell, CAT, Vans, Dr. Martens, Saucony, Timberland, Sperry Top-Sider,
Palladium, and Stance. It is also in apparel and accessories business as well. The company was founded
in 1981 and changed its name in November 2017 (Belton, 2017). The company has been a growing
company in the past few years, further information about which is given below.
Discussion and Analysis
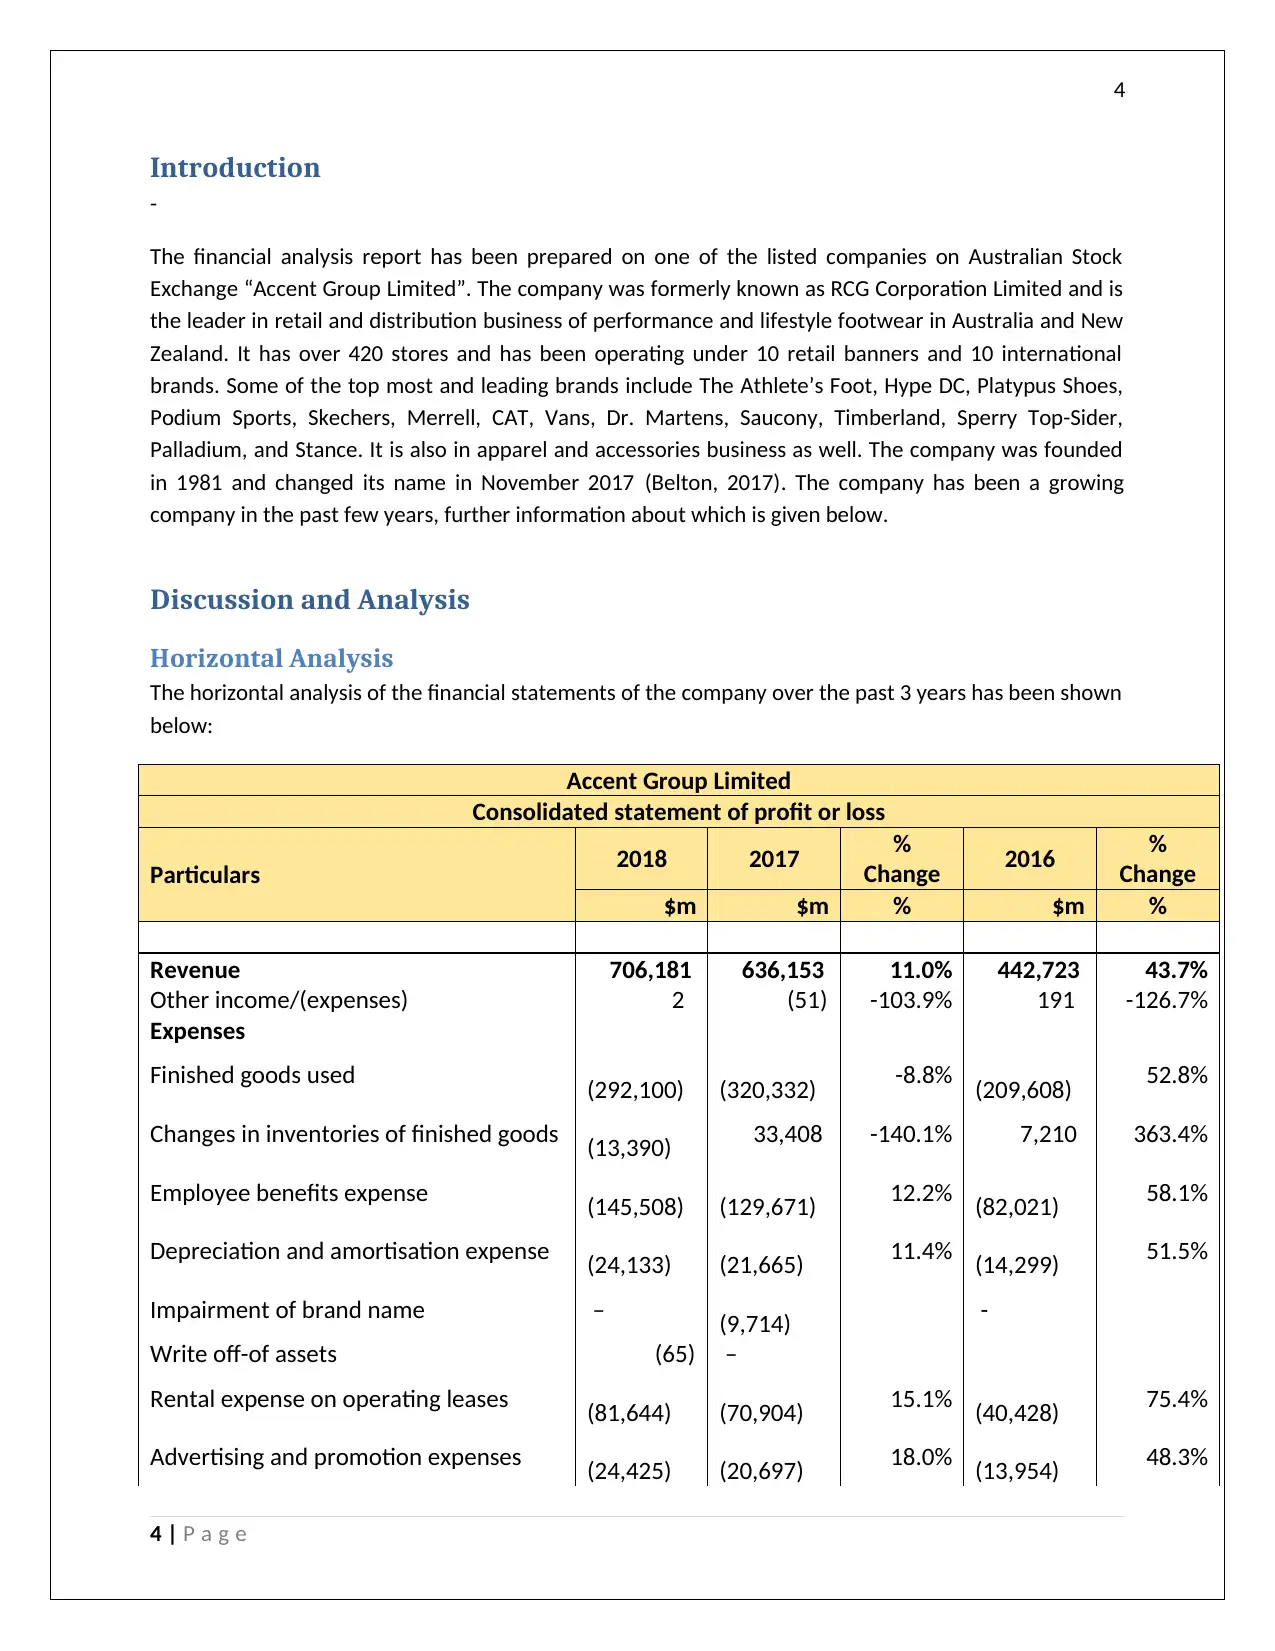
Horizontal Analysis
The horizontal analysis of the financial statements of the company over the past 3 years has been shown
below:
Accent Group Limited
Consolidated statement of profit or loss
Particulars 2018 2017 %
Change 2016 %
Change
$m $m % $m %
Revenue 706,181 636,153 11.0% 442,723 43.7%
Other income/(expenses) 2 (51) -103.9% 191 -126.7%
Expenses
Finished goods used (292,100) (320,332) -8.8% (209,608) 52.8%
Changes in inventories of finished goods (13,390) 33,408 -140.1% 7,210 363.4%
Employee benefits expense (145,508) (129,671) 12.2% (82,021) 58.1%
Depreciation and amortisation expense (24,133) (21,665) 11.4% (14,299) 51.5%
Impairment of brand name – (9,714) -
Write off-of assets (65) –
Rental expense on operating leases (81,644) (70,904) 15.1% (40,428) 75.4%
Advertising and promotion expenses (24,425) (20,697) 18.0% (13,954) 48.3%
4 | P a g e
Introduction
-
The financial analysis report has been prepared on one of the listed companies on Australian Stock
Exchange “Accent Group Limited”. The company was formerly known as RCG Corporation Limited and is
the leader in retail and distribution business of performance and lifestyle footwear in Australia and New
Zealand. It has over 420 stores and has been operating under 10 retail banners and 10 international
brands. Some of the top most and leading brands include The Athlete’s Foot, Hype DC, Platypus Shoes,
Podium Sports, Skechers, Merrell, CAT, Vans, Dr. Martens, Saucony, Timberland, Sperry Top-Sider,
Palladium, and Stance. It is also in apparel and accessories business as well. The company was founded
in 1981 and changed its name in November 2017 (Belton, 2017). The company has been a growing
company in the past few years, further information about which is given below.
Discussion and Analysis
Horizontal Analysis
The horizontal analysis of the financial statements of the company over the past 3 years has been shown
below:
Accent Group Limited
Consolidated statement of profit or loss
Particulars 2018 2017 %
Change 2016 %
Change
$m $m % $m %
Revenue 706,181 636,153 11.0% 442,723 43.7%
Other income/(expenses) 2 (51) -103.9% 191 -126.7%
Expenses
Finished goods used (292,100) (320,332) -8.8% (209,608) 52.8%
Changes in inventories of finished goods (13,390) 33,408 -140.1% 7,210 363.4%
Employee benefits expense (145,508) (129,671) 12.2% (82,021) 58.1%
Depreciation and amortisation expense (24,133) (21,665) 11.4% (14,299) 51.5%
Impairment of brand name – (9,714) -
Write off-of assets (65) –
Rental expense on operating leases (81,644) (70,904) 15.1% (40,428) 75.4%
Advertising and promotion expenses (24,425) (20,697) 18.0% (13,954) 48.3%
4 | P a g e
5
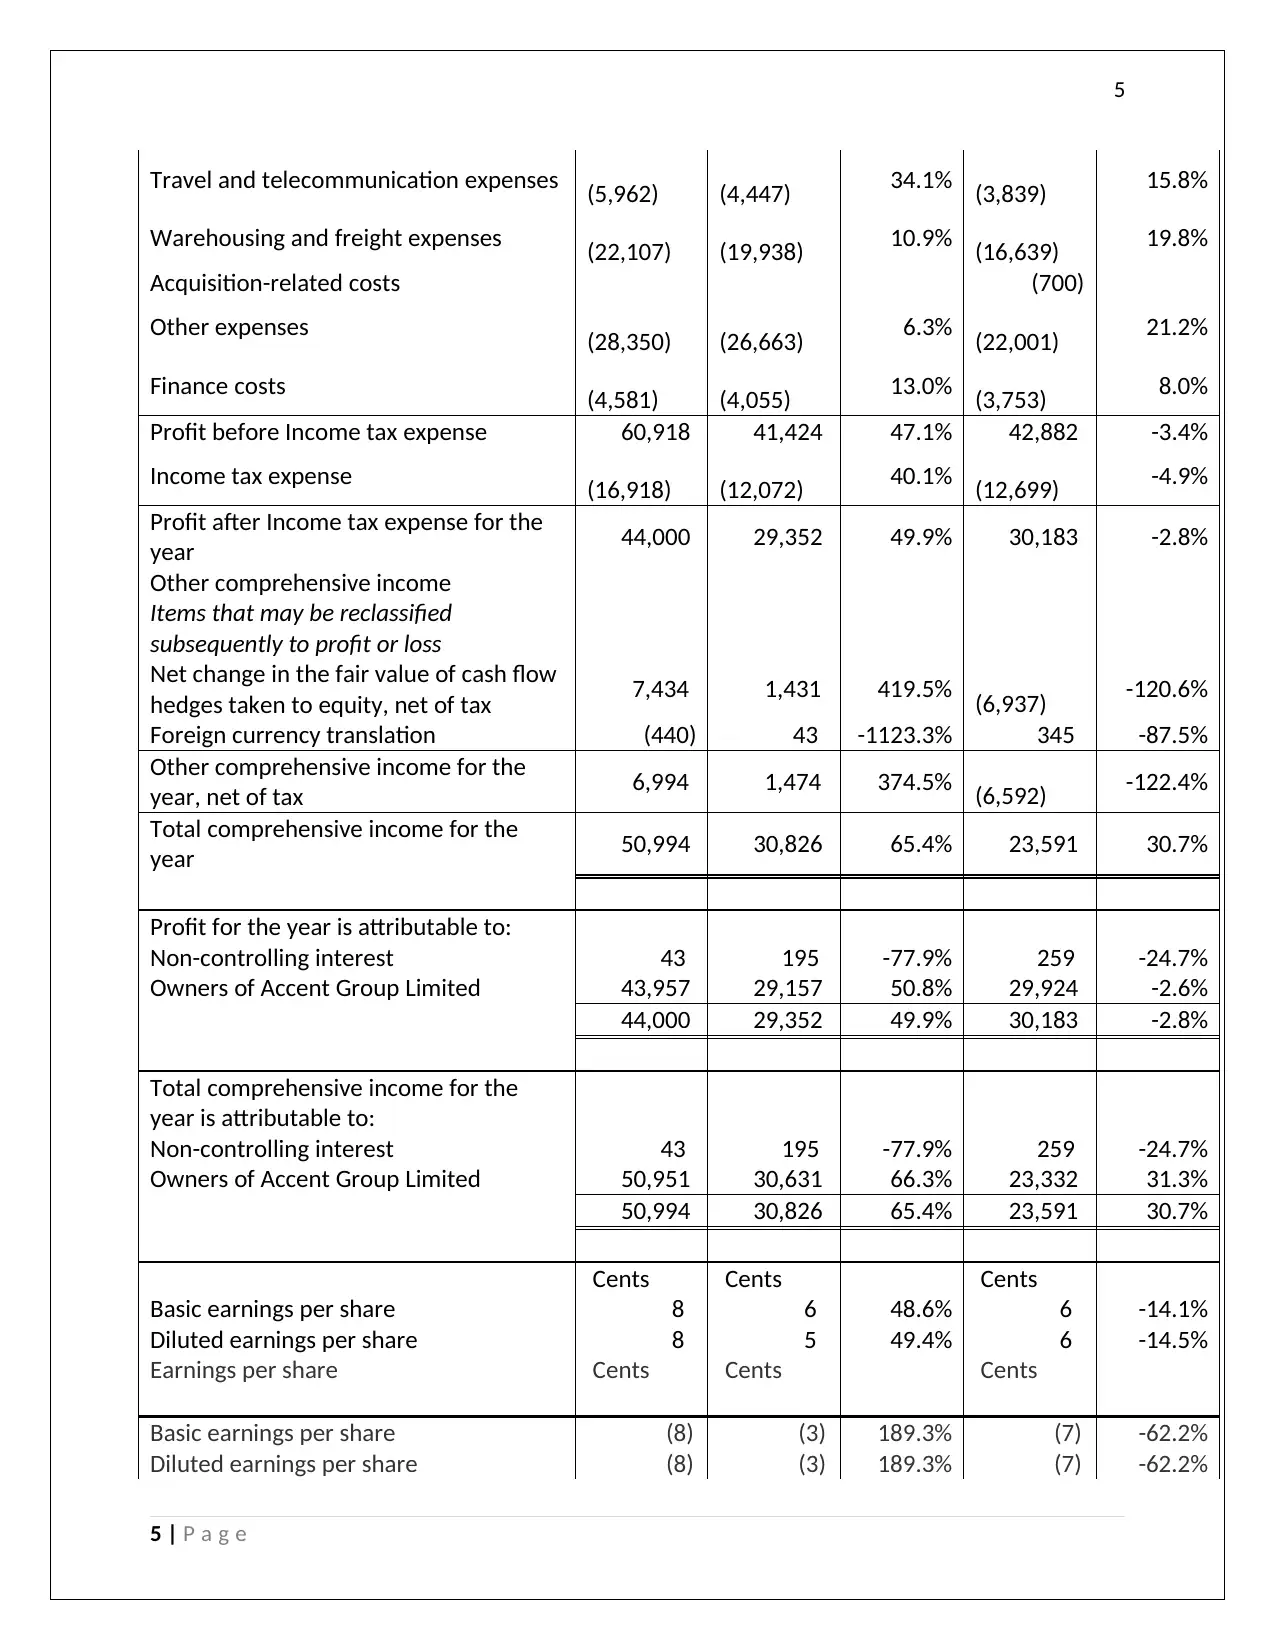
Travel and telecommunication expenses (5,962) (4,447) 34.1% (3,839) 15.8%
Warehousing and freight expenses (22,107) (19,938) 10.9% (16,639) 19.8%
Acquisition-related costs (700)
Other expenses (28,350) (26,663) 6.3% (22,001) 21.2%
Finance costs (4,581) (4,055) 13.0% (3,753) 8.0%
Profit before Income tax expense 60,918 41,424 47.1% 42,882 -3.4%
Income tax expense (16,918) (12,072) 40.1% (12,699) -4.9%
Profit after Income tax expense for the
year 44,000 29,352 49.9% 30,183 -2.8%
Other comprehensive income
Items that may be reclassified
subsequently to profit or loss
Net change in the fair value of cash flow
hedges taken to equity, net of tax 7,434 1,431 419.5% (6,937) -120.6%
Foreign currency translation (440) 43 -1123.3% 345 -87.5%
Other comprehensive income for the
year, net of tax 6,994 1,474 374.5% (6,592) -122.4%
Total comprehensive income for the
year 50,994 30,826 65.4% 23,591 30.7%
Profit for the year is attributable to:
Non-controlling interest 43 195 -77.9% 259 -24.7%
Owners of Accent Group Limited 43,957 29,157 50.8% 29,924 -2.6%
44,000 29,352 49.9% 30,183 -2.8%
Total comprehensive income for the
year is attributable to:
Non-controlling interest 43 195 -77.9% 259 -24.7%
Owners of Accent Group Limited 50,951 30,631 66.3% 23,332 31.3%
50,994 30,826 65.4% 23,591 30.7%
Cents Cents Cents
Basic earnings per share 8 6 48.6% 6 -14.1%
Diluted earnings per share 8 5 49.4% 6 -14.5%
Earnings per share Cents Cents Cents
Basic earnings per share (8) (3) 189.3% (7) -62.2%
Diluted earnings per share (8) (3) 189.3% (7) -62.2%
5 | P a g e
⊘ This is a preview!⊘
Do you want full access?
Subscribe today to unlock all pages.
Trusted by 1+ million students worldwide
6
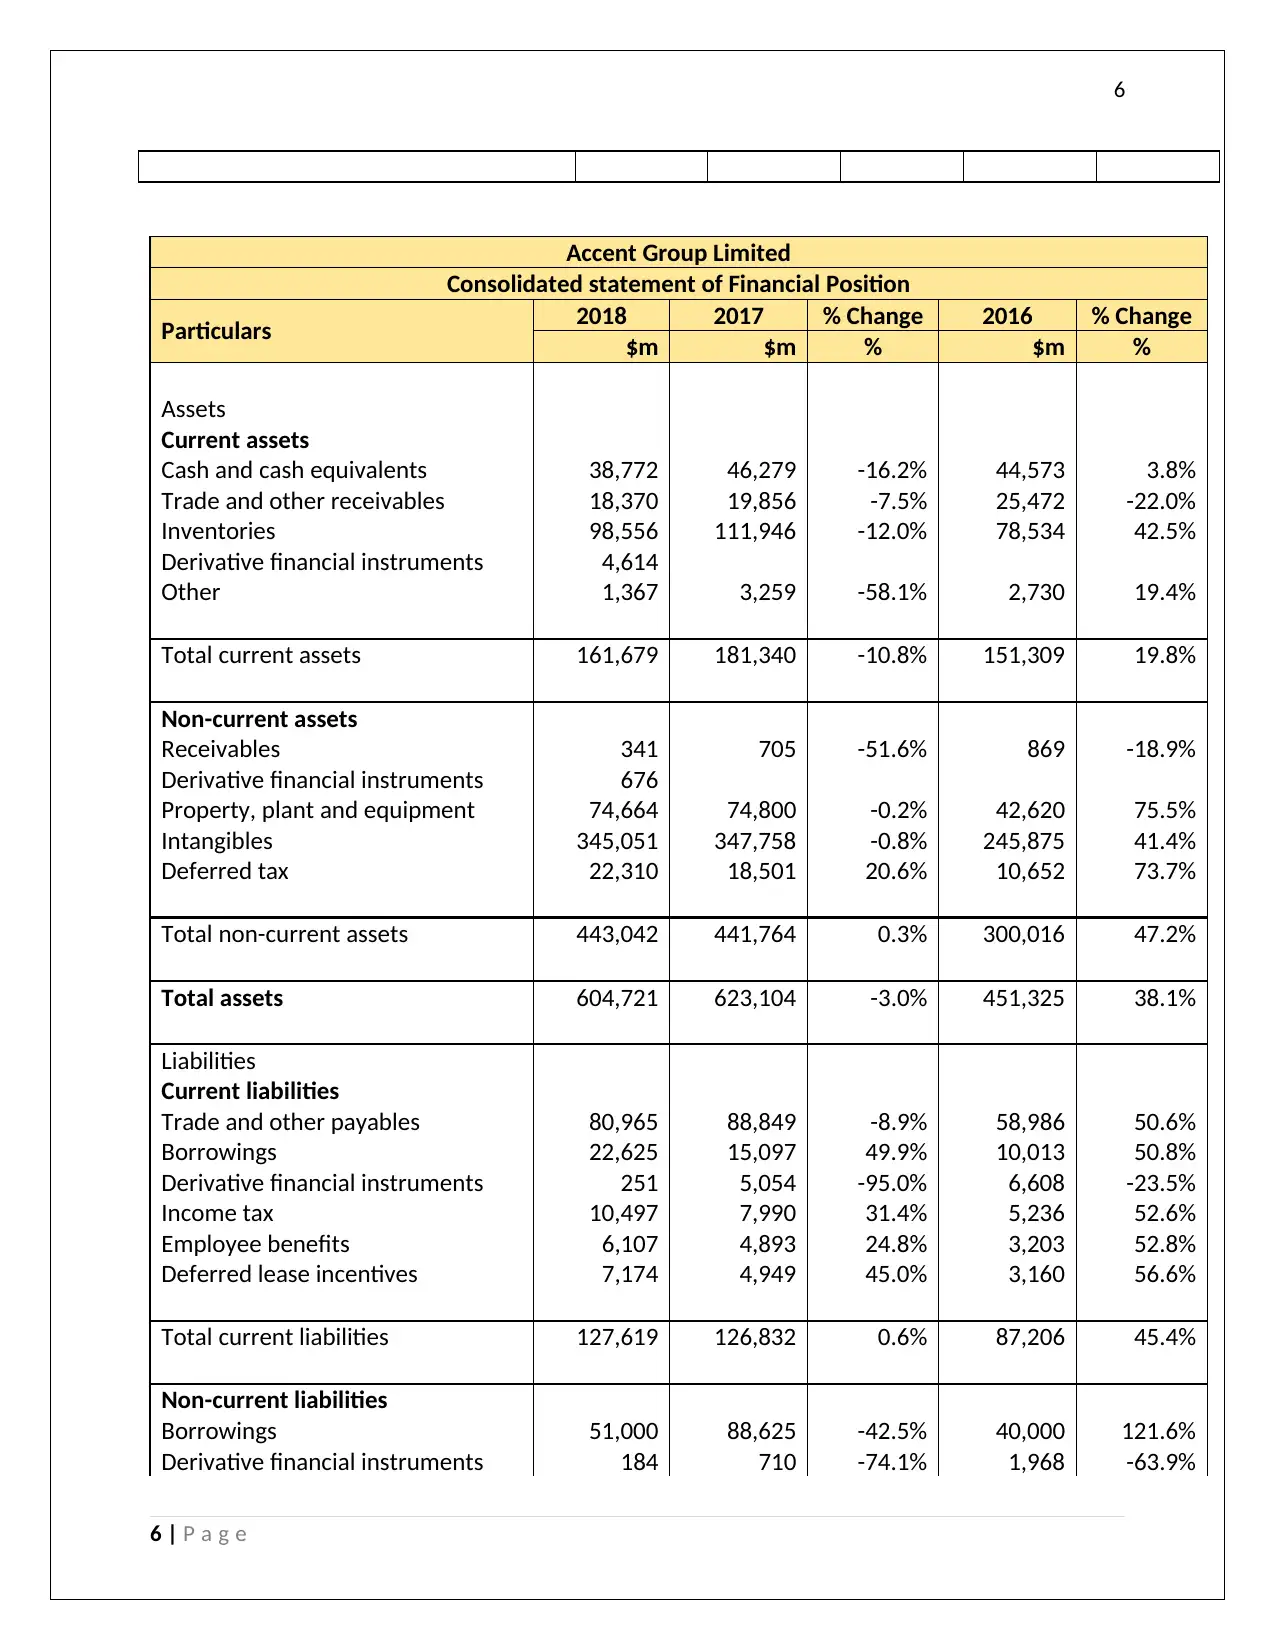
Accent Group Limited
Consolidated statement of Financial Position
Particulars 2018 2017 % Change 2016 % Change
$m $m % $m %
Assets
Current assets
Cash and cash equivalents 38,772 46,279 -16.2% 44,573 3.8%
Trade and other receivables 18,370 19,856 -7.5% 25,472 -22.0%
Inventories 98,556 111,946 -12.0% 78,534 42.5%
Derivative financial instruments 4,614
Other 1,367 3,259 -58.1% 2,730 19.4%
Total current assets 161,679 181,340 -10.8% 151,309 19.8%
Non-current assets
Receivables 341 705 -51.6% 869 -18.9%
Derivative financial instruments 676
Property, plant and equipment 74,664 74,800 -0.2% 42,620 75.5%
Intangibles 345,051 347,758 -0.8% 245,875 41.4%
Deferred tax 22,310 18,501 20.6% 10,652 73.7%
Total non-current assets 443,042 441,764 0.3% 300,016 47.2%
Total assets 604,721 623,104 -3.0% 451,325 38.1%
Liabilities
Current liabilities
Trade and other payables 80,965 88,849 -8.9% 58,986 50.6%
Borrowings 22,625 15,097 49.9% 10,013 50.8%
Derivative financial instruments 251 5,054 -95.0% 6,608 -23.5%
Income tax 10,497 7,990 31.4% 5,236 52.6%
Employee benefits 6,107 4,893 24.8% 3,203 52.8%
Deferred lease incentives 7,174 4,949 45.0% 3,160 56.6%
Total current liabilities 127,619 126,832 0.6% 87,206 45.4%
Non-current liabilities
Borrowings 51,000 88,625 -42.5% 40,000 121.6%
Derivative financial instruments 184 710 -74.1% 1,968 -63.9%
6 | P a g e
Paraphrase This Document
Need a fresh take? Get an instant paraphrase of this document with our AI Paraphraser
7
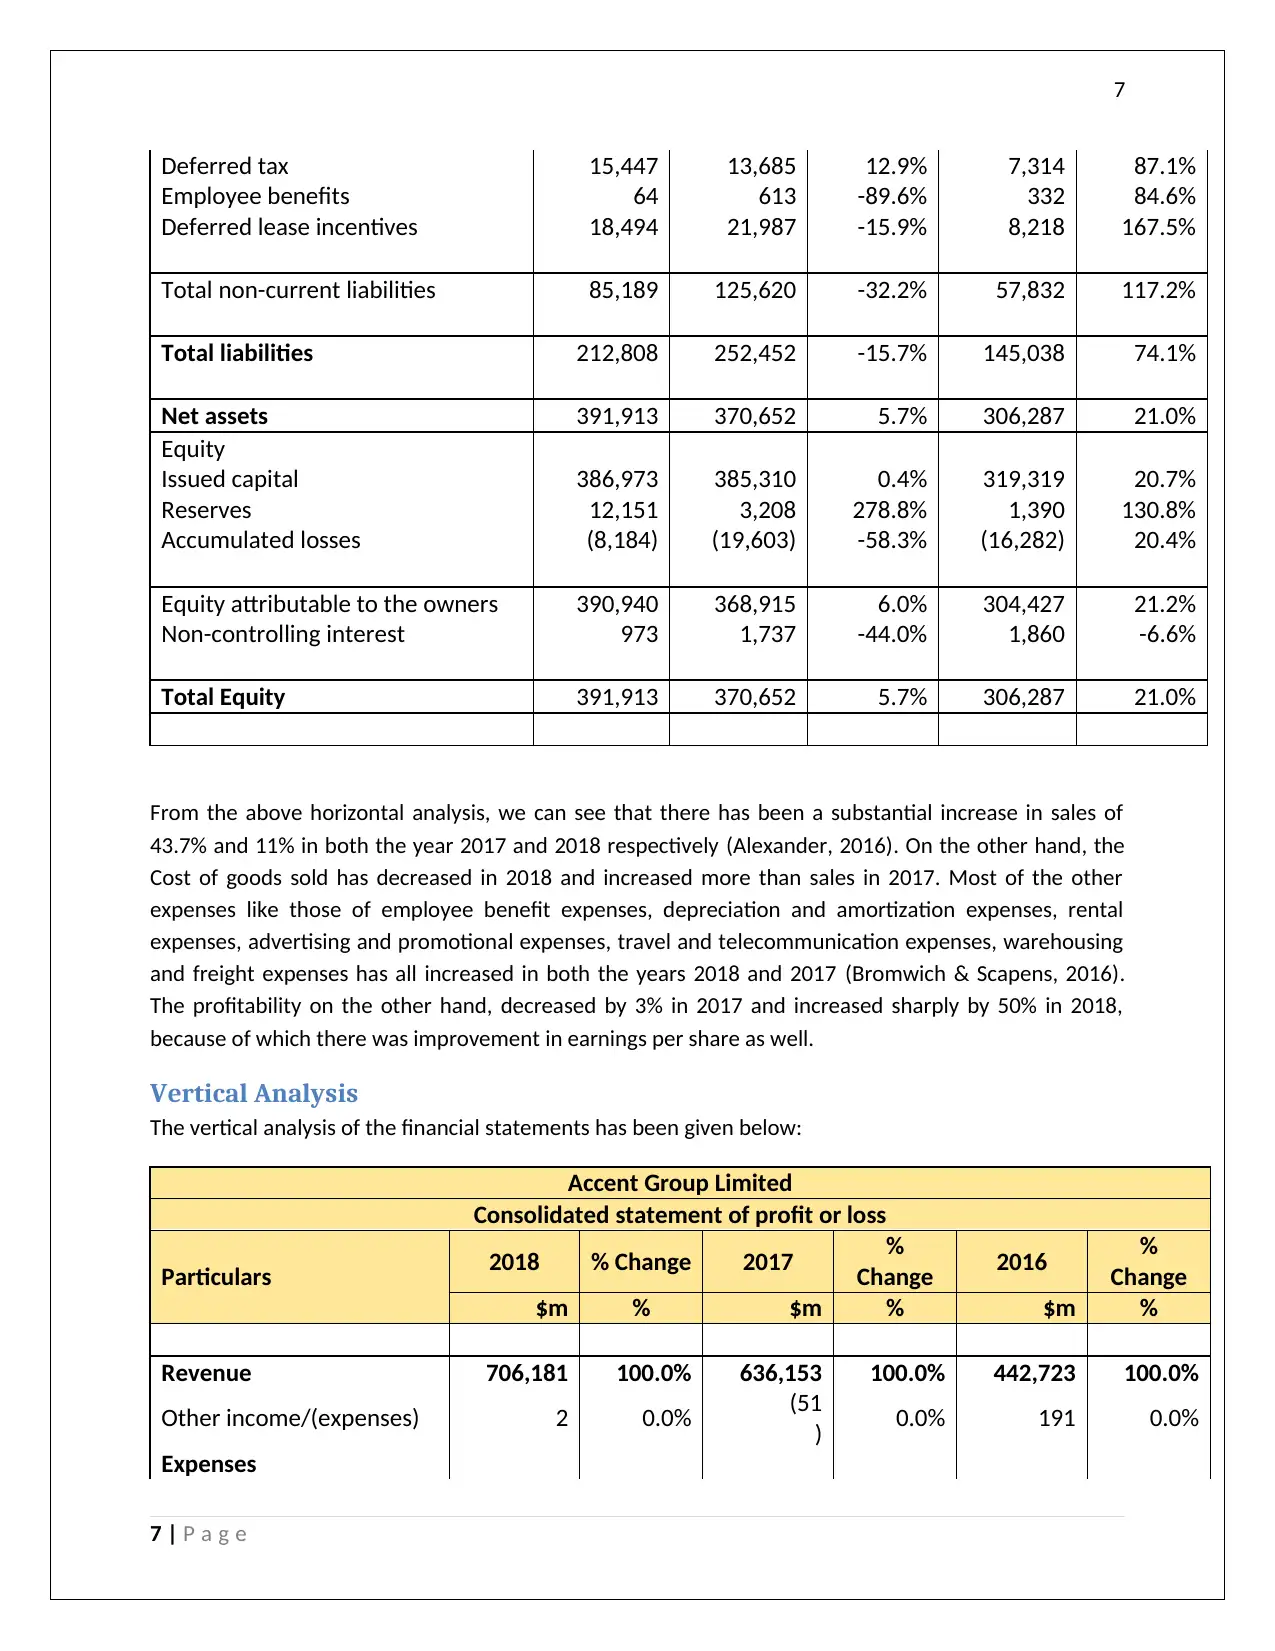
Deferred tax 15,447 13,685 12.9% 7,314 87.1%
Employee benefits 64 613 -89.6% 332 84.6%
Deferred lease incentives 18,494 21,987 -15.9% 8,218 167.5%
Total non-current liabilities 85,189 125,620 -32.2% 57,832 117.2%
Total liabilities 212,808 252,452 -15.7% 145,038 74.1%
Net assets 391,913 370,652 5.7% 306,287 21.0%
Equity
Issued capital 386,973 385,310 0.4% 319,319 20.7%
Reserves 12,151 3,208 278.8% 1,390 130.8%
Accumulated losses (8,184) (19,603) -58.3% (16,282) 20.4%
Equity attributable to the owners 390,940 368,915 6.0% 304,427 21.2%
Non-controlling interest 973 1,737 -44.0% 1,860 -6.6%
Total Equity 391,913 370,652 5.7% 306,287 21.0%
From the above horizontal analysis, we can see that there has been a substantial increase in sales of
43.7% and 11% in both the year 2017 and 2018 respectively (Alexander, 2016). On the other hand, the
Cost of goods sold has decreased in 2018 and increased more than sales in 2017. Most of the other
expenses like those of employee benefit expenses, depreciation and amortization expenses, rental
expenses, advertising and promotional expenses, travel and telecommunication expenses, warehousing
and freight expenses has all increased in both the years 2018 and 2017 (Bromwich & Scapens, 2016).
The profitability on the other hand, decreased by 3% in 2017 and increased sharply by 50% in 2018,
because of which there was improvement in earnings per share as well.
Vertical Analysis
The vertical analysis of the financial statements has been given below:
Accent Group Limited
Consolidated statement of profit or loss
Particulars 2018 % Change 2017 %
Change 2016 %
Change
$m % $m % $m %
Revenue 706,181 100.0% 636,153 100.0% 442,723 100.0%
Other income/(expenses) 2 0.0% (51
) 0.0% 191 0.0%
Expenses
7 | P a g e
8
Finished goods used (292,100
) -41.4% (320,332
) -50.4% (209,608
) -47.3%
Changes in inventories of
finished goods
(13,390
) -1.9% 33,408 5.3% 7,210 1.6%
Employee benefits
expense
(145,508
) -20.6% (129,671
) -20.4% (82,021
) -18.5%
Depreciation and
amortisation expense
(24,133
) -3.4% (21,665
) -3.4% (14,299
) -3.2%
Impairment of brand name – (9,714
) -1.5% -
Write off-of assets (65
) 0.0% – 0.0%
Rental expense on
operating leases
(81,644
) -11.6% (70,904
) -11.1% (40,428
) -9.1%
Advertising and promotion
expenses
(24,425
) -3.5% (20,697
) -3.3% (13,954
) -3.2%
Travel and
telecommunication
expenses
(5,962
) -0.8% (4,447
) -0.7% (3,839
) -0.9%
Warehousing and freight
expenses
(22,107
) -3.1% (19,938
) -3.1% (16,639
) -3.8%
Acquisition-related costs 0.0% 0.0% (700
) -0.2%
Other expenses (28,350
) -4.0% (26,663
) -4.2% (22,001
) -5.0%
Finance costs (4,581
) -0.6% (4,055
) -0.6% (3,753
) -0.8%
Profit before Income tax
expense 60,918 8.6% 41,424 6.5% 42,882 9.7%
Income tax expense (16,918
) -2.4% (12,072
) -1.9% (12,699
) -2.9%
Profit after Income tax
expense for the year 44,000 6.2% 29,352 4.6% 30,183 6.8%
Other comprehensive
income 0.0% 0.0% 0.0%
Items that may be
reclassified subsequently
to profit or loss
0.0% 0.0% 0.0%
Net change in the fair
value of cash flow hedges
taken to equity, net of tax
7,434 1.1% 1,431 0.2% (6,937
) -1.6%
Foreign currency
translation
(440
) -0.1% 43 0.0% 345 0.1%
Other comprehensive 6,994 1.0% 1,474 0.2% (6,592 -1.5%
8 | P a g e
⊘ This is a preview!⊘
Do you want full access?
Subscribe today to unlock all pages.
Trusted by 1+ million students worldwide
9
income for the year, net of
tax )
Total comprehensive
income for the year 50,994 7.2% 30,826 4.8% 23,591 5.3%
Profit for the year is
attributable to:
Non-controlling interest 43 0.0% 195 0.0% 259 0.1%
Owners of Accent Group
Limited 43,957 6.2% 29,157 4.6% 29,924 6.8%
44,000 6.2% 29,352 4.6% 30,183 6.8%
Total comprehensive
income for the year is
attributable to:
Non-controlling interest 43 0.0% 195 0.0% 259 0.1%
Owners of Accent Group
Limited 50,951 7.2% 30,631 4.8% 23,332 5.3%
50,994 7.2% 30,826 4.8% 23,591 5.3%
Cents Cents Cents
Basic earnings per share 8 6 6
Diluted earnings per share 8 5 6
Earnings per share Cents Cents Cents
Basic earnings per share (8) (3) (7)
Diluted earnings per share (8) (3) (7)
Accent Group Limited
Consolidated statement of Financial Position
Particulars 2018 %
Change 2017 %
Change 2016
%
Chang
e
$m % $m % $m %
Assets
Current assets
Cash and cash equivalents 38,772 6.4% 46,279 7.4% 44,573 9.9%
Trade and other receivables 18,370 3.0% 19,856 3.2% 25,472 5.6%
Inventories 98,556 16.3% 111,946 18.0% 78,534 17.4%
Derivative financial instruments 4,614 0.8% 0.0% 0.0%
9 | P a g e
Paraphrase This Document
Need a fresh take? Get an instant paraphrase of this document with our AI Paraphraser
10
Other 1,367 0.2% 3,259 0.5% 2,730 0.6%
Total current assets 161,679 26.7% 181,340 29.1% 151,309 33.5%
Non-current assets
Receivables 341 0.1% 705 0.1% 869 0.2%
Derivative financial instruments 676 0.1% 0.0% 0.0%
Property, plant and equipment 74,664 12.3% 74,800 12.0% 42,620 9.4%
Intangibles 345,051 57.1% 347,758 55.8% 245,875 54.5%
Deferred tax 22,310 3.7% 18,501 3.0% 10,652 2.4%
Total non-current assets 443,042 73.3% 441,764 70.9% 300,016 66.5%
Total assets 604,721 100.0% 623,104 100.0% 451,325 100.0
%
Liabilities
Current liabilities
Trade and other payables 80,965 13.4% 88,849 14.3% 58,986 13.1%
Borrowings 22,625 3.7% 15,097 2.4% 10,013 2.2%
Derivative financial instruments 251 0.0% 5,054 0.8% 6,608 1.5%
Income tax 10,497 1.7% 7,990 1.3% 5,236 1.2%
Employee benefits 6,107 1.0% 4,893 0.8% 3,203 0.7%
Deferred lease incentives 7,174 1.2% 4,949 0.8% 3,160 0.7%
Total current liabilities 127,619 21.1% 126,832 20.4% 87,206 19.3%
Non-current liabilities
Borrowings 51,000 8.4% 88,625 14.2% 40,000 8.9%
Derivative financial instruments 184 0.0% 710 0.1% 1,968 0.4%
Deferred tax 15,447 2.6% 13,685 2.2% 7,314 1.6%
Employee benefits 64 0.0% 613 0.1% 332 0.1%
Deferred lease incentives 18,494 3.1% 21,987 3.5% 8,218 1.8%
Total non-current liabilities 85,189 14.1% 125,620 20.2% 57,832 12.8%
Total liabilities 212,808 35.2% 252,452 40.5% 145,038 32.1%
Net assets 391,913 64.8% 370,652 59.5% 306,287 67.9%
Equity
Issued capital 386,973 64.0% 385,310 61.8% 319,319 70.8%
Reserves 12,151 2.0% 3,208 0.5% 1,390 0.3%
Accumulated losses (8,184) -1.4% (19,603) -3.1% (16,282) -3.6%
10 | P a g e
11
Equity attributable to the owners 390,940 64.6% 368,915 59.2% 304,427 67.5%
Non-controlling interest 973 0.2% 1,737 0.3% 1,860 0.4%
Total Equity 391,913 64.8% 370,652 59.5% 306,287 67.9%
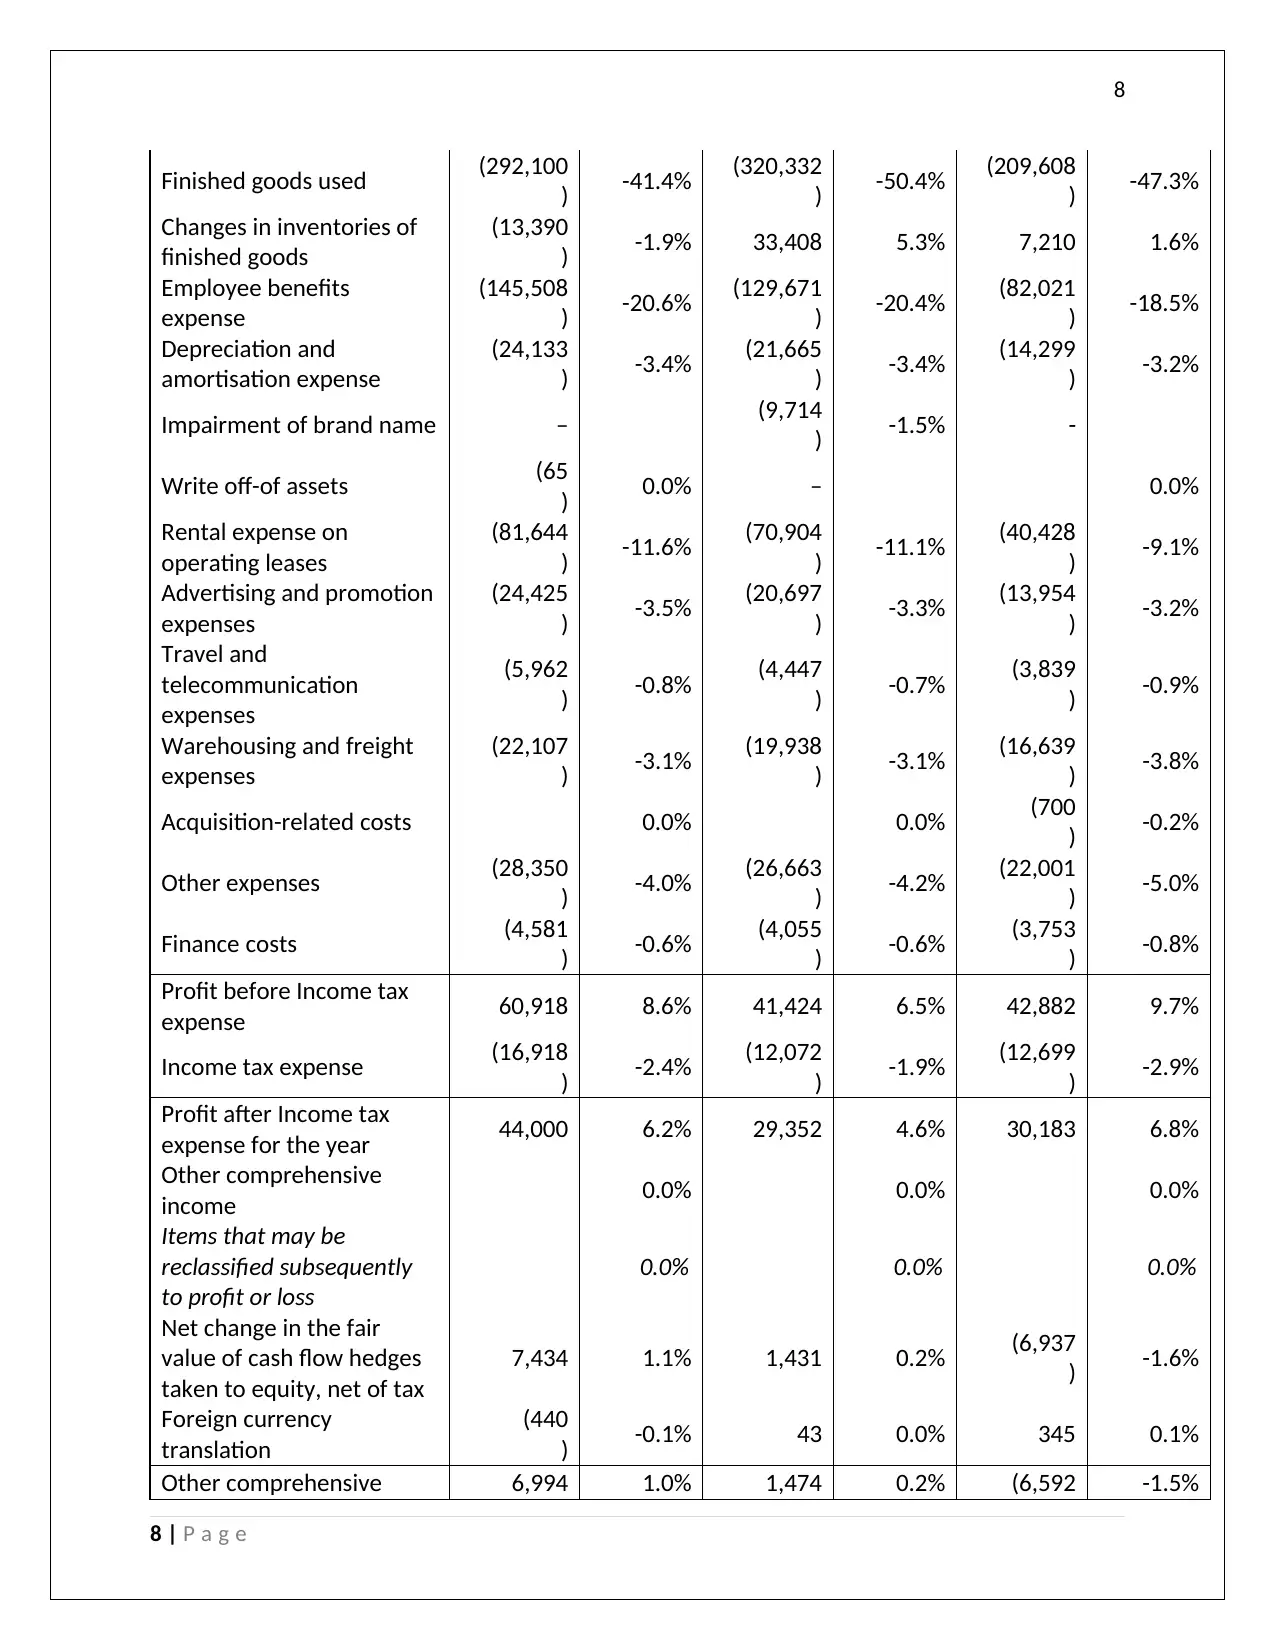
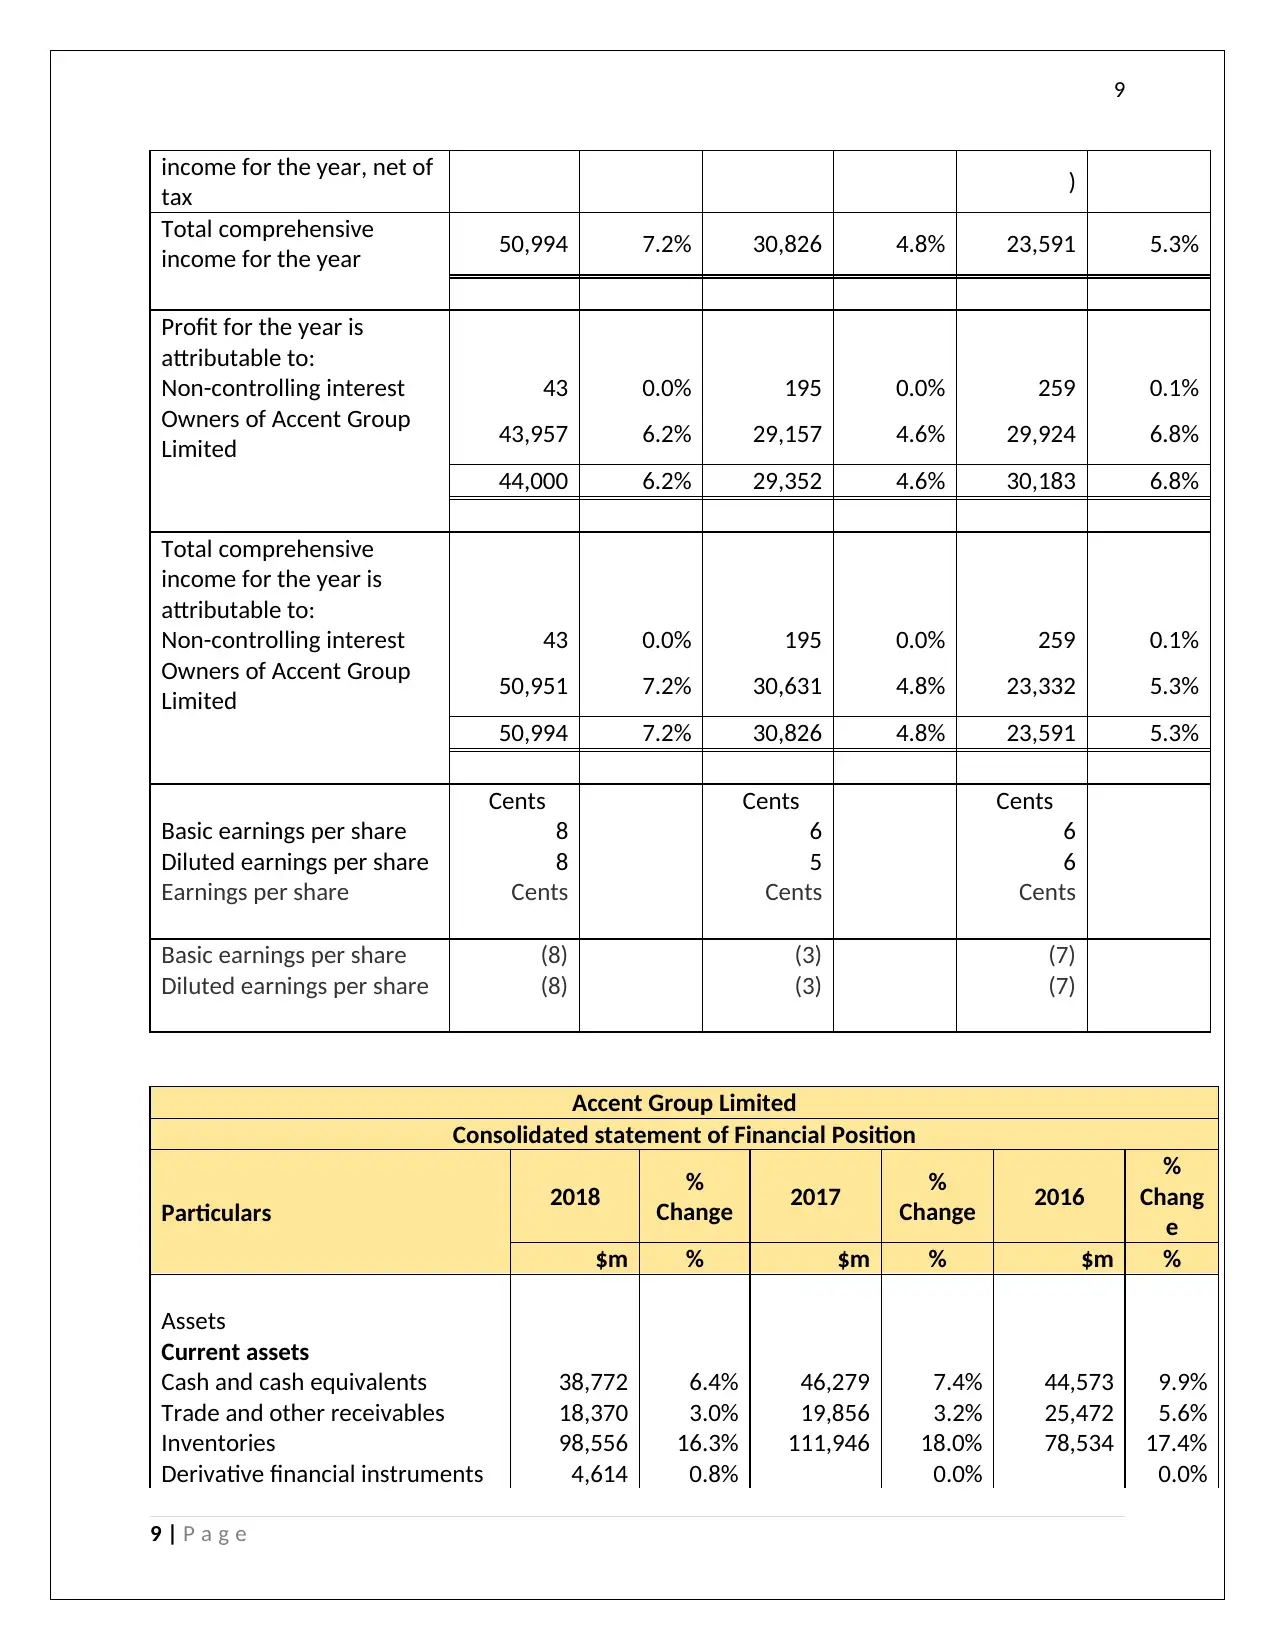
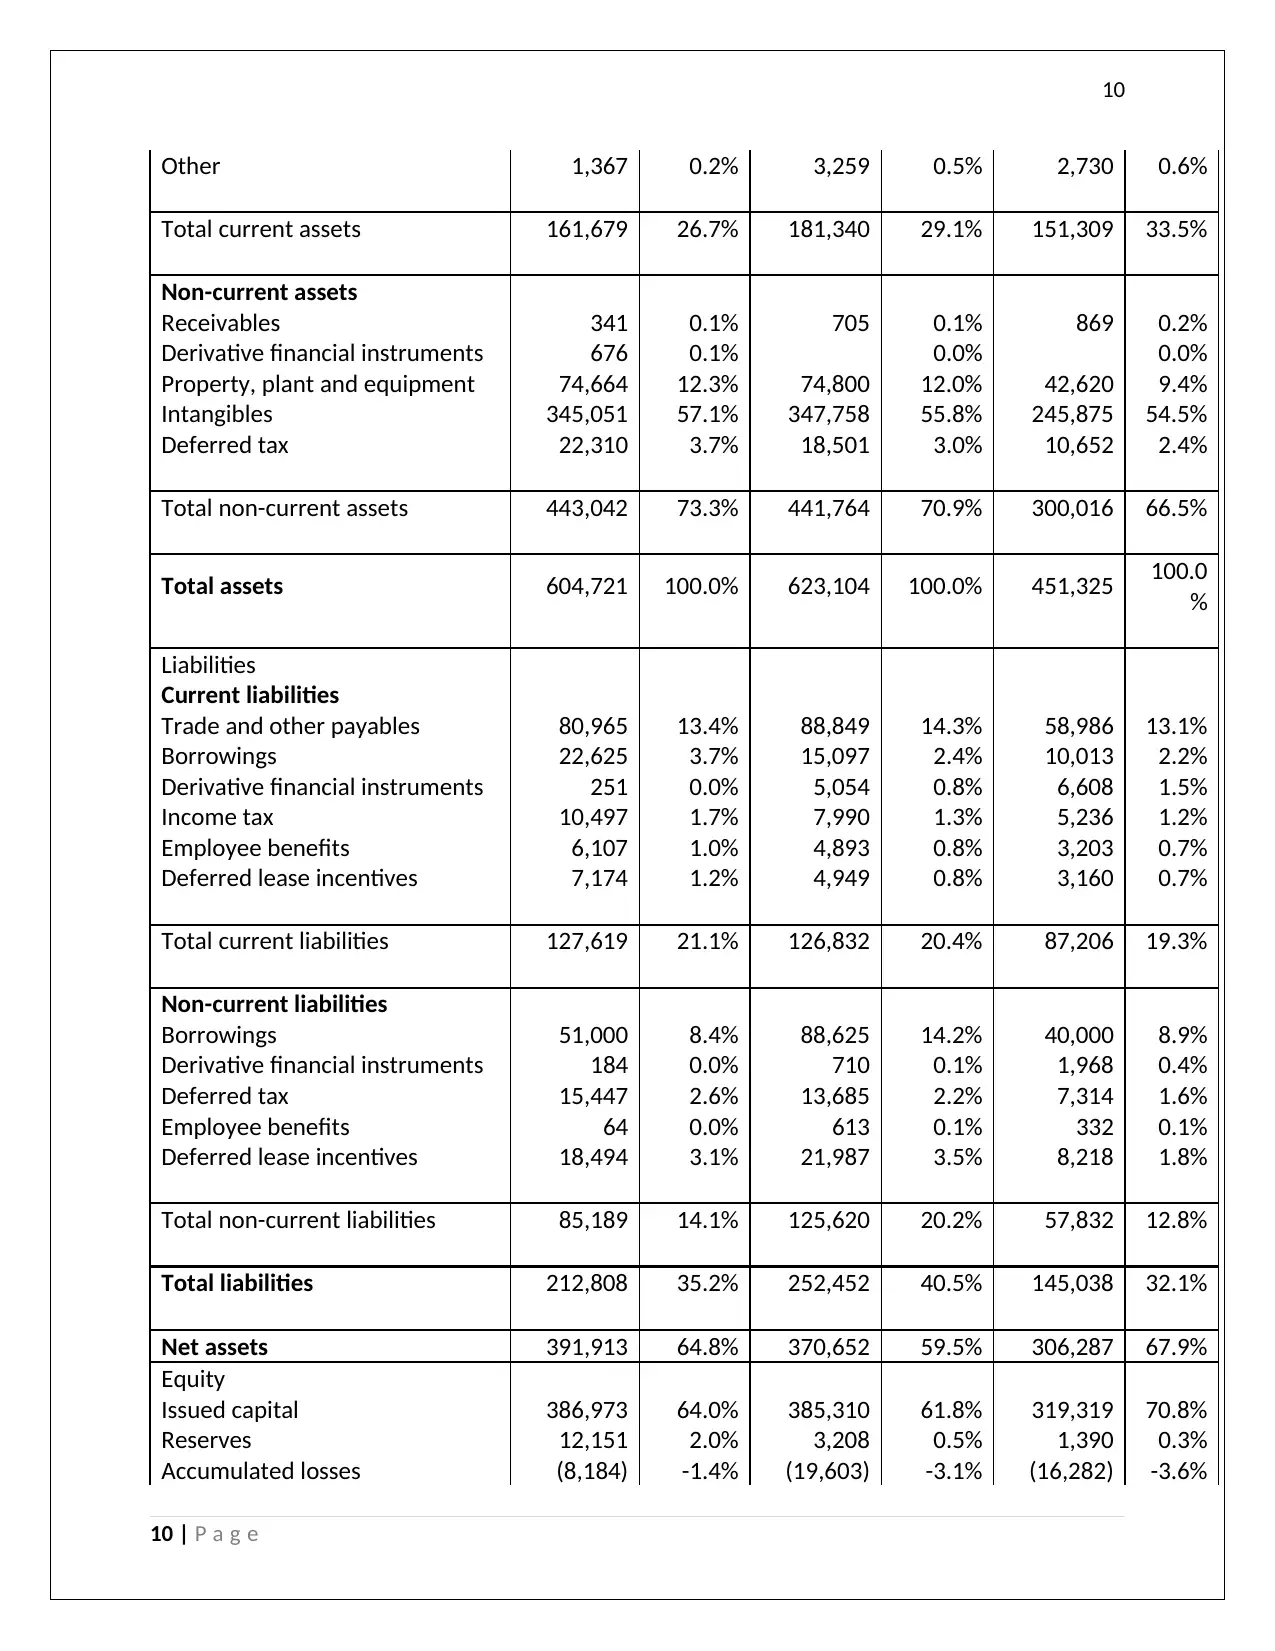
From the above vertical analysis, we can see that the finished goods used as a proportion of the sales
has come down considerably from 50% to 41% in 20118, indicating efficiency in production operations
(Chron, 2017). The employee benefit expenses, depreciation and amortization expenses, rental
expenses on operating leases, travel and communication expenses, advertisement and publicity
expenses and warehousing and freight expenses has all been constant over the years when compared as
a proportion of sales. The profit however decreased in 2017 and then increased in 2018 (Johnson, 2017).
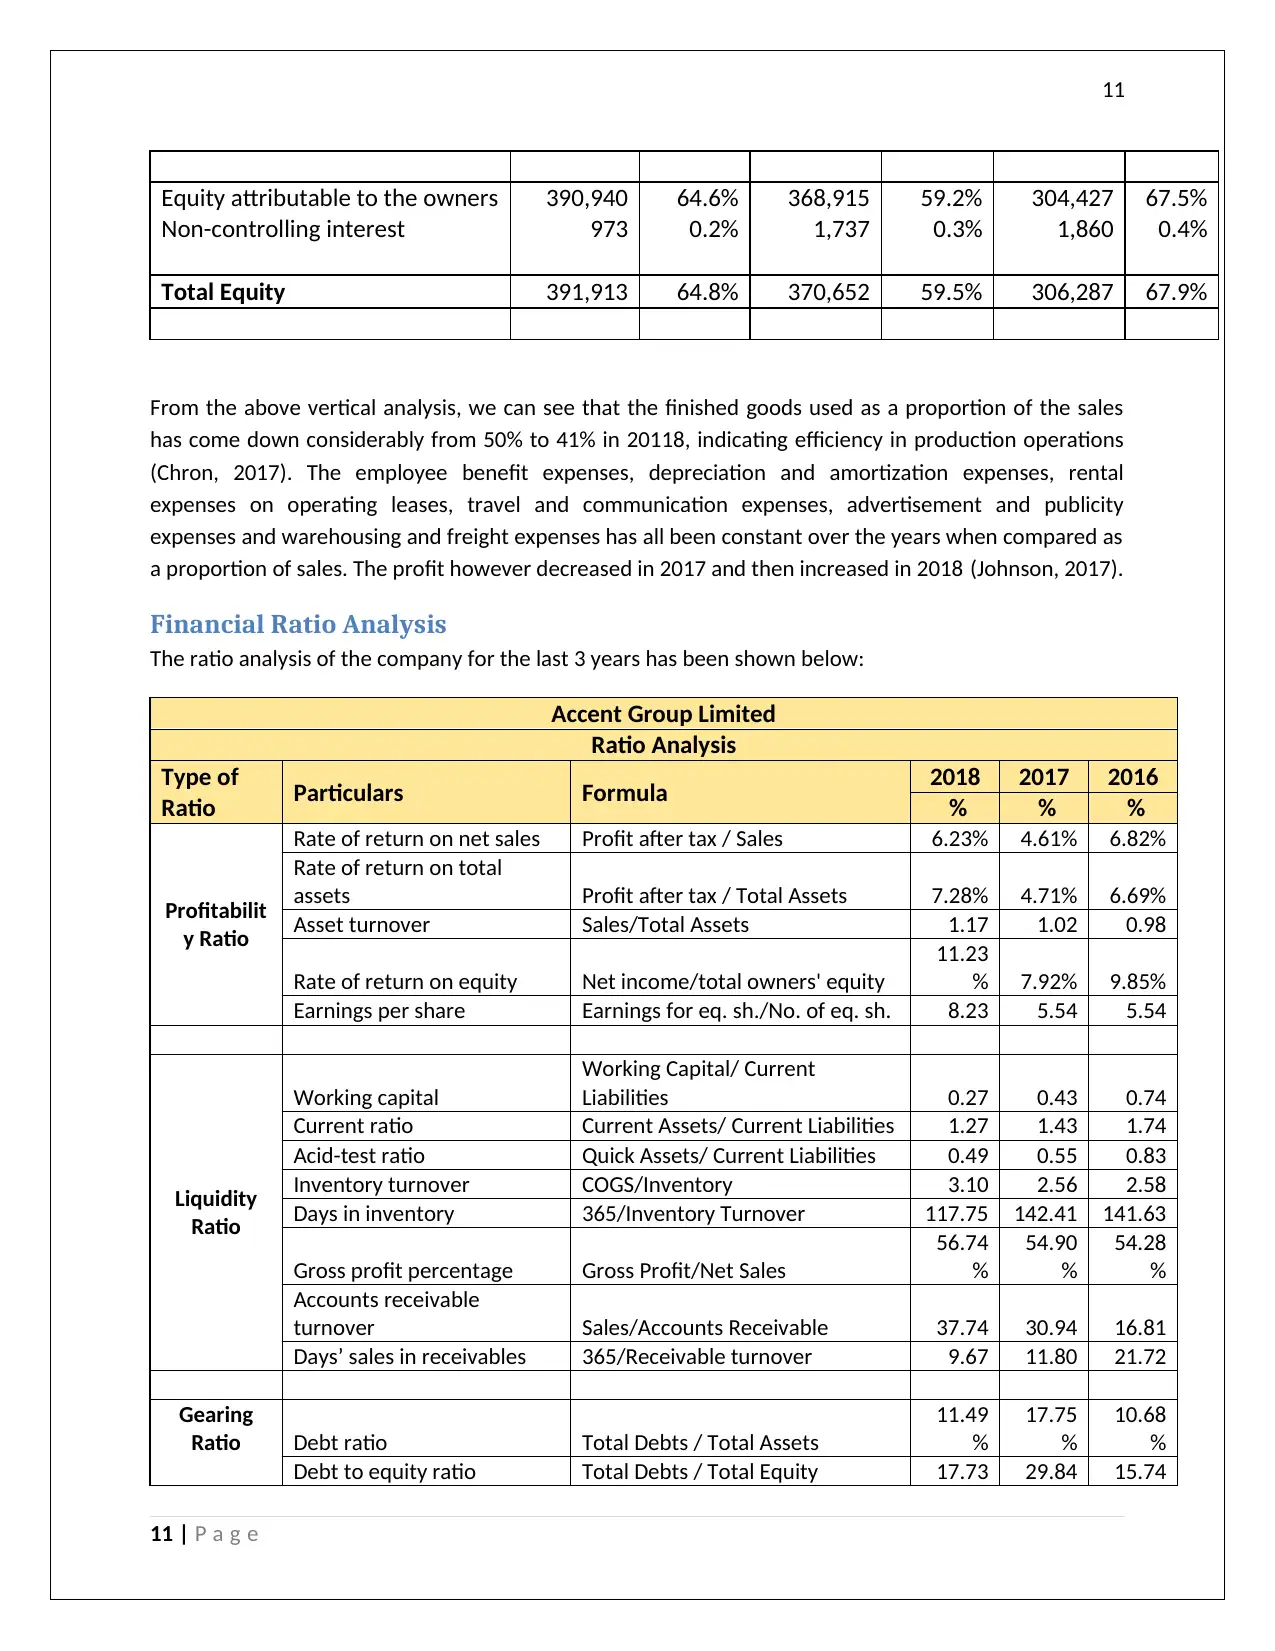
Financial Ratio Analysis
The ratio analysis of the company for the last 3 years has been shown below:
Accent Group Limited
Ratio Analysis
Type of
Ratio Particulars Formula 2018 2017 2016
% % %
Profitabilit
y Ratio
Rate of return on net sales Profit after tax / Sales 6.23% 4.61% 6.82%
Rate of return on total
assets Profit after tax / Total Assets 7.28% 4.71% 6.69%
Asset turnover Sales/Total Assets 1.17 1.02 0.98
Rate of return on equity Net income/total owners' equity
11.23
% 7.92% 9.85%
Earnings per share Earnings for eq. sh./No. of eq. sh. 8.23 5.54 5.54
Liquidity
Ratio
Working capital
Working Capital/ Current
Liabilities 0.27 0.43 0.74
Current ratio Current Assets/ Current Liabilities 1.27 1.43 1.74
Acid-test ratio Quick Assets/ Current Liabilities 0.49 0.55 0.83
Inventory turnover COGS/Inventory 3.10 2.56 2.58
Days in inventory 365/Inventory Turnover 117.75 142.41 141.63
Gross profit percentage Gross Profit/Net Sales
56.74
%
54.90
%
54.28
%
Accounts receivable
turnover Sales/Accounts Receivable 37.74 30.94 16.81
Days’ sales in receivables 365/Receivable turnover 9.67 11.80 21.72
Gearing
Ratio Debt ratio Total Debts / Total Assets
11.49
%
17.75
%
10.68
%
Debt to equity ratio Total Debts / Total Equity 17.73 29.84 15.74
11 | P a g e
Equity attributable to the owners 390,940 64.6% 368,915 59.2% 304,427 67.5%
Non-controlling interest 973 0.2% 1,737 0.3% 1,860 0.4%
Total Equity 391,913 64.8% 370,652 59.5% 306,287 67.9%
From the above vertical analysis, we can see that the finished goods used as a proportion of the sales
has come down considerably from 50% to 41% in 20118, indicating efficiency in production operations
(Chron, 2017). The employee benefit expenses, depreciation and amortization expenses, rental
expenses on operating leases, travel and communication expenses, advertisement and publicity
expenses and warehousing and freight expenses has all been constant over the years when compared as
a proportion of sales. The profit however decreased in 2017 and then increased in 2018 (Johnson, 2017).
Financial Ratio Analysis
The ratio analysis of the company for the last 3 years has been shown below:
Accent Group Limited
Ratio Analysis
Type of
Ratio Particulars Formula 2018 2017 2016
% % %
Profitabilit
y Ratio
Rate of return on net sales Profit after tax / Sales 6.23% 4.61% 6.82%
Rate of return on total
assets Profit after tax / Total Assets 7.28% 4.71% 6.69%
Asset turnover Sales/Total Assets 1.17 1.02 0.98
Rate of return on equity Net income/total owners' equity
11.23
% 7.92% 9.85%
Earnings per share Earnings for eq. sh./No. of eq. sh. 8.23 5.54 5.54
Liquidity
Ratio
Working capital
Working Capital/ Current
Liabilities 0.27 0.43 0.74
Current ratio Current Assets/ Current Liabilities 1.27 1.43 1.74
Acid-test ratio Quick Assets/ Current Liabilities 0.49 0.55 0.83
Inventory turnover COGS/Inventory 3.10 2.56 2.58
Days in inventory 365/Inventory Turnover 117.75 142.41 141.63
Gross profit percentage Gross Profit/Net Sales
56.74
%
54.90
%
54.28
%
Accounts receivable
turnover Sales/Accounts Receivable 37.74 30.94 16.81
Days’ sales in receivables 365/Receivable turnover 9.67 11.80 21.72
Gearing
Ratio Debt ratio Total Debts / Total Assets
11.49
%
17.75
%
10.68
%
Debt to equity ratio Total Debts / Total Equity 17.73 29.84 15.74
11 | P a g e
⊘ This is a preview!⊘
Do you want full access?
Subscribe today to unlock all pages.
Trusted by 1+ million students worldwide
1 out of 15
Related Documents


Your All-in-One AI-Powered Toolkit for Academic Success.
+13062052269
info@desklib.com
Available 24*7 on WhatsApp / Email
![[object Object]](/_next/static/media/star-bottom.7253800d.svg)
Unlock your academic potential
Copyright © 2020–2026 A2Z Services. All Rights Reserved. Developed and managed by ZUCOL.