Managing Operations and Finance: Adidas vs. Puma Financial Report
VerifiedAdded on 2022/08/24
|29
|3738
|11
Report
AI Summary
This report provides a comprehensive financial analysis of Adidas and Puma, two leading companies in the sportswear industry. The analysis begins with an overview of the industry and a company background, followed by an examination of their business strategies and operational analyses. The core of the report focuses on evaluating the financial performance of both companies using key financial ratios, including net profit margin, operating return on equity, and return on capital employed. Risk analysis is also conducted, looking at current and debt-equity ratios, and operating leverage. Furthermore, managerial performance, market performance, and sustainability aspects are assessed, providing a holistic view of each company's financial health and operational effectiveness. The report concludes with a comparative analysis of both companies, highlighting their strengths, weaknesses, and overall financial performance in the competitive sportswear market.
Running head: MANAGE OPERATIONS AND FINANCE
Manage Operations and Finance
Name of the Student
Name of the University
Authors Note
Course ID
Manage Operations and Finance
Name of the Student
Name of the University
Authors Note
Course ID
Paraphrase This Document
Need a fresh take? Get an instant paraphrase of this document with our AI Paraphraser
1MANAGE OPERATIONS AND FINANCE
Table of Contents
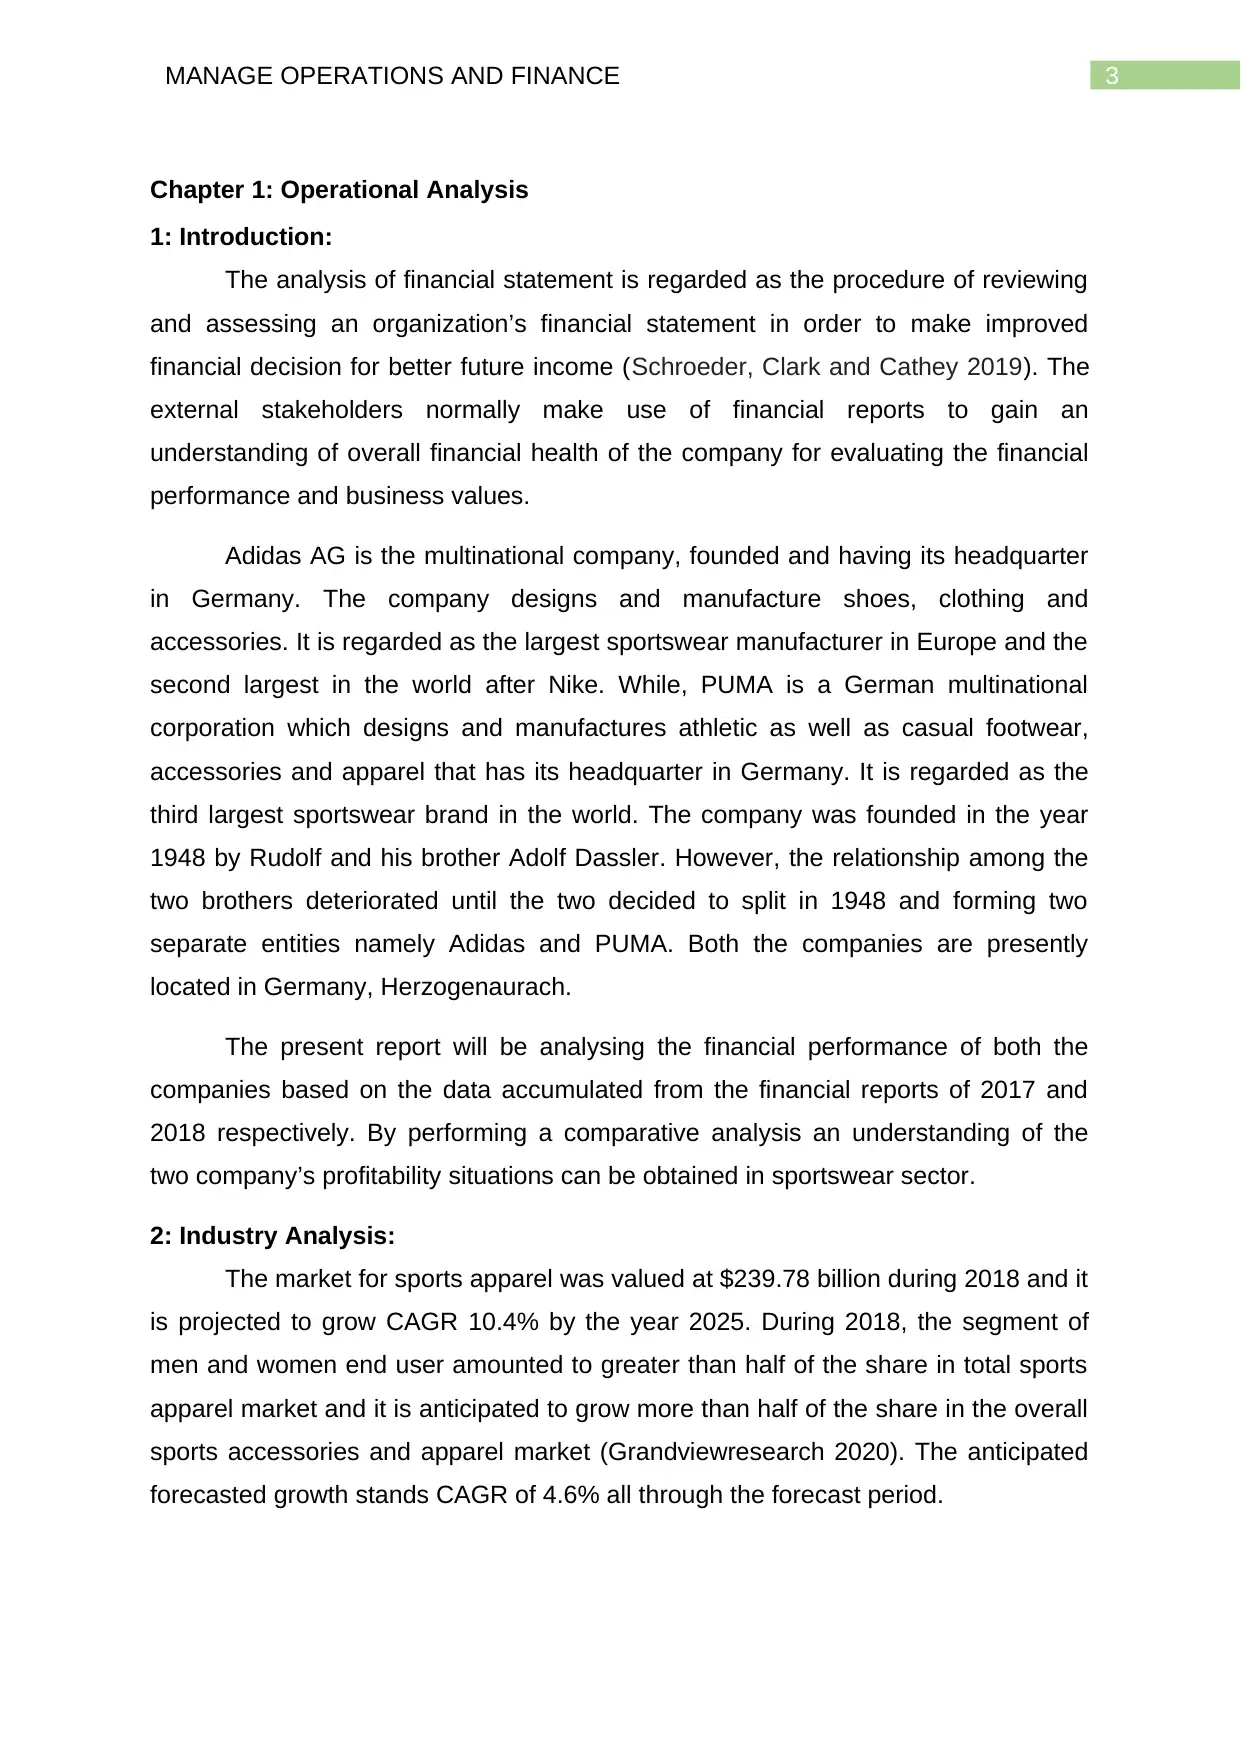
Chapter 1: Operational Analysis...................................................................................3
1: Introduction:..........................................................................................................3
2: Industry Analysis:..................................................................................................3
3: Company overview:..............................................................................................4
4: Business strategy:.................................................................................................6
5: Operational Analysis:............................................................................................7
Chapter 2 Evaluation of performance...........................................................................8
1: Financial performance..........................................................................................8
Table 1: Net profit margin...................................................................................8
Table 2: Operating return on equity......................................................................9
Table 3: Return on capital employed..............................................................10
2: Risk analysis.......................................................................................................11
Table 5: Current ratio........................................................................................11
Table 6: Debt equity ratio.................................................................................12
Table 7: Operating leverage................................................................................13
3: Managerial Performance.....................................................................................14
Table 8: Asset turnover....................................................................................14
Table 9: Inventory turnover..............................................................................16
Table 10: Debt collection period......................................................................17
4: Market Performance:..........................................................................................17
Table 11: Earnings per Share...........................................................................18
Table 12: Price-Earnings per share....................................................................19
Table 13: Dividend Yield.....................................................................................19
6: Sustainability and CSR:..........................................................................................20
7: Conclusion:.............................................................................................................21
References:................................................................................................................22
Table of Contents
Chapter 1: Operational Analysis...................................................................................3
1: Introduction:..........................................................................................................3
2: Industry Analysis:..................................................................................................3
3: Company overview:..............................................................................................4
4: Business strategy:.................................................................................................6
5: Operational Analysis:............................................................................................7
Chapter 2 Evaluation of performance...........................................................................8
1: Financial performance..........................................................................................8
Table 1: Net profit margin...................................................................................8
Table 2: Operating return on equity......................................................................9
Table 3: Return on capital employed..............................................................10
2: Risk analysis.......................................................................................................11
Table 5: Current ratio........................................................................................11
Table 6: Debt equity ratio.................................................................................12
Table 7: Operating leverage................................................................................13
3: Managerial Performance.....................................................................................14
Table 8: Asset turnover....................................................................................14
Table 9: Inventory turnover..............................................................................16
Table 10: Debt collection period......................................................................17
4: Market Performance:..........................................................................................17
Table 11: Earnings per Share...........................................................................18
Table 12: Price-Earnings per share....................................................................19
Table 13: Dividend Yield.....................................................................................19
6: Sustainability and CSR:..........................................................................................20
7: Conclusion:.............................................................................................................21
References:................................................................................................................22
2MANAGE OPERATIONS AND FINANCE
Appendix A: Adidas:...................................................................................................24
Appendix B: PUMA.....................................................................................................26
Appendix A: Adidas:...................................................................................................24
Appendix B: PUMA.....................................................................................................26
⊘ This is a preview!⊘
Do you want full access?
Subscribe today to unlock all pages.
Trusted by 1+ million students worldwide
3MANAGE OPERATIONS AND FINANCE
Chapter 1: Operational Analysis
1: Introduction:
The analysis of financial statement is regarded as the procedure of reviewing
and assessing an organization’s financial statement in order to make improved
financial decision for better future income (Schroeder, Clark and Cathey 2019). The
external stakeholders normally make use of financial reports to gain an
understanding of overall financial health of the company for evaluating the financial
performance and business values.
Adidas AG is the multinational company, founded and having its headquarter
in Germany. The company designs and manufacture shoes, clothing and
accessories. It is regarded as the largest sportswear manufacturer in Europe and the
second largest in the world after Nike. While, PUMA is a German multinational
corporation which designs and manufactures athletic as well as casual footwear,
accessories and apparel that has its headquarter in Germany. It is regarded as the
third largest sportswear brand in the world. The company was founded in the year
1948 by Rudolf and his brother Adolf Dassler. However, the relationship among the
two brothers deteriorated until the two decided to split in 1948 and forming two
separate entities namely Adidas and PUMA. Both the companies are presently
located in Germany, Herzogenaurach.
The present report will be analysing the financial performance of both the
companies based on the data accumulated from the financial reports of 2017 and
2018 respectively. By performing a comparative analysis an understanding of the
two company’s profitability situations can be obtained in sportswear sector.
2: Industry Analysis:
The market for sports apparel was valued at $239.78 billion during 2018 and it
is projected to grow CAGR 10.4% by the year 2025. During 2018, the segment of
men and women end user amounted to greater than half of the share in total sports
apparel market and it is anticipated to grow more than half of the share in the overall
sports accessories and apparel market (Grandviewresearch 2020). The anticipated
forecasted growth stands CAGR of 4.6% all through the forecast period.
Paraphrase This Document
Need a fresh take? Get an instant paraphrase of this document with our AI Paraphraser
4MANAGE OPERATIONS AND FINANCE
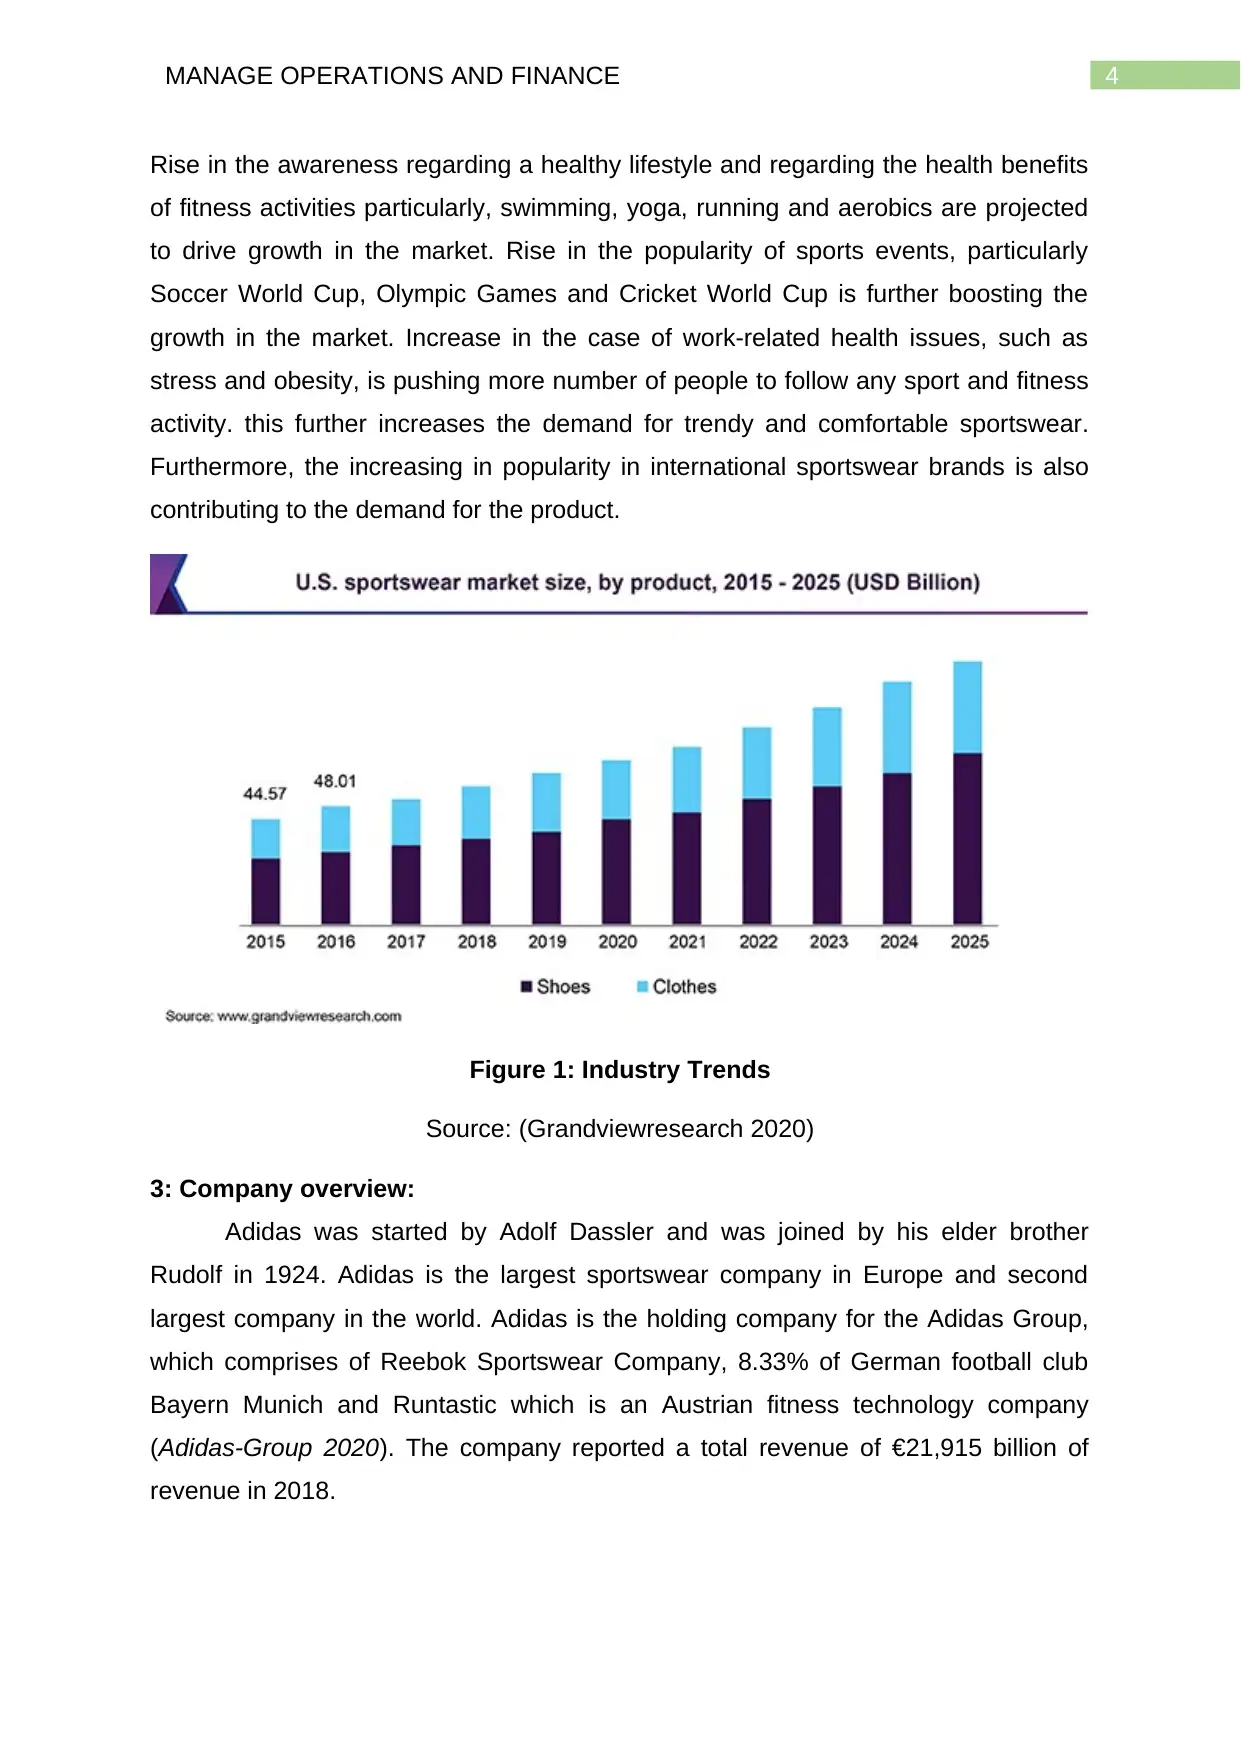
Rise in the awareness regarding a healthy lifestyle and regarding the health benefits
of fitness activities particularly, swimming, yoga, running and aerobics are projected
to drive growth in the market. Rise in the popularity of sports events, particularly
Soccer World Cup, Olympic Games and Cricket World Cup is further boosting the
growth in the market. Increase in the case of work-related health issues, such as
stress and obesity, is pushing more number of people to follow any sport and fitness
activity. this further increases the demand for trendy and comfortable sportswear.
Furthermore, the increasing in popularity in international sportswear brands is also
contributing to the demand for the product.
Figure 1: Industry Trends
Source: (Grandviewresearch 2020)
3: Company overview:
Adidas was started by Adolf Dassler and was joined by his elder brother
Rudolf in 1924. Adidas is the largest sportswear company in Europe and second
largest company in the world. Adidas is the holding company for the Adidas Group,
which comprises of Reebok Sportswear Company, 8.33% of German football club
Bayern Munich and Runtastic which is an Austrian fitness technology company
(Adidas-Group 2020). The company reported a total revenue of €21,915 billion of
revenue in 2018.
5MANAGE OPERATIONS AND FINANCE
Figure 2: Adidas Logo
Source: (Adidas-Group 2020)
PUMA, on the other hand, is the third largest company of sportswear and
accessories in the world. The company was founded by in 1948 by Rudolf Dassler
which has its base in Herzogenaurach, Germany. PUMA employs greater than
13,000 people across the world and sells its product in greater than 120 countries
(PUMA SE 2020). PUMA has been listed as public company since 1986 and since
2013 the company has been led by a former football professional Bjorn Gulden.
Figure 3: PUMA Logo
Source: (PUMA SE 2020)
⊘ This is a preview!⊘
Do you want full access?
Subscribe today to unlock all pages.
Trusted by 1+ million students worldwide
6MANAGE OPERATIONS AND FINANCE
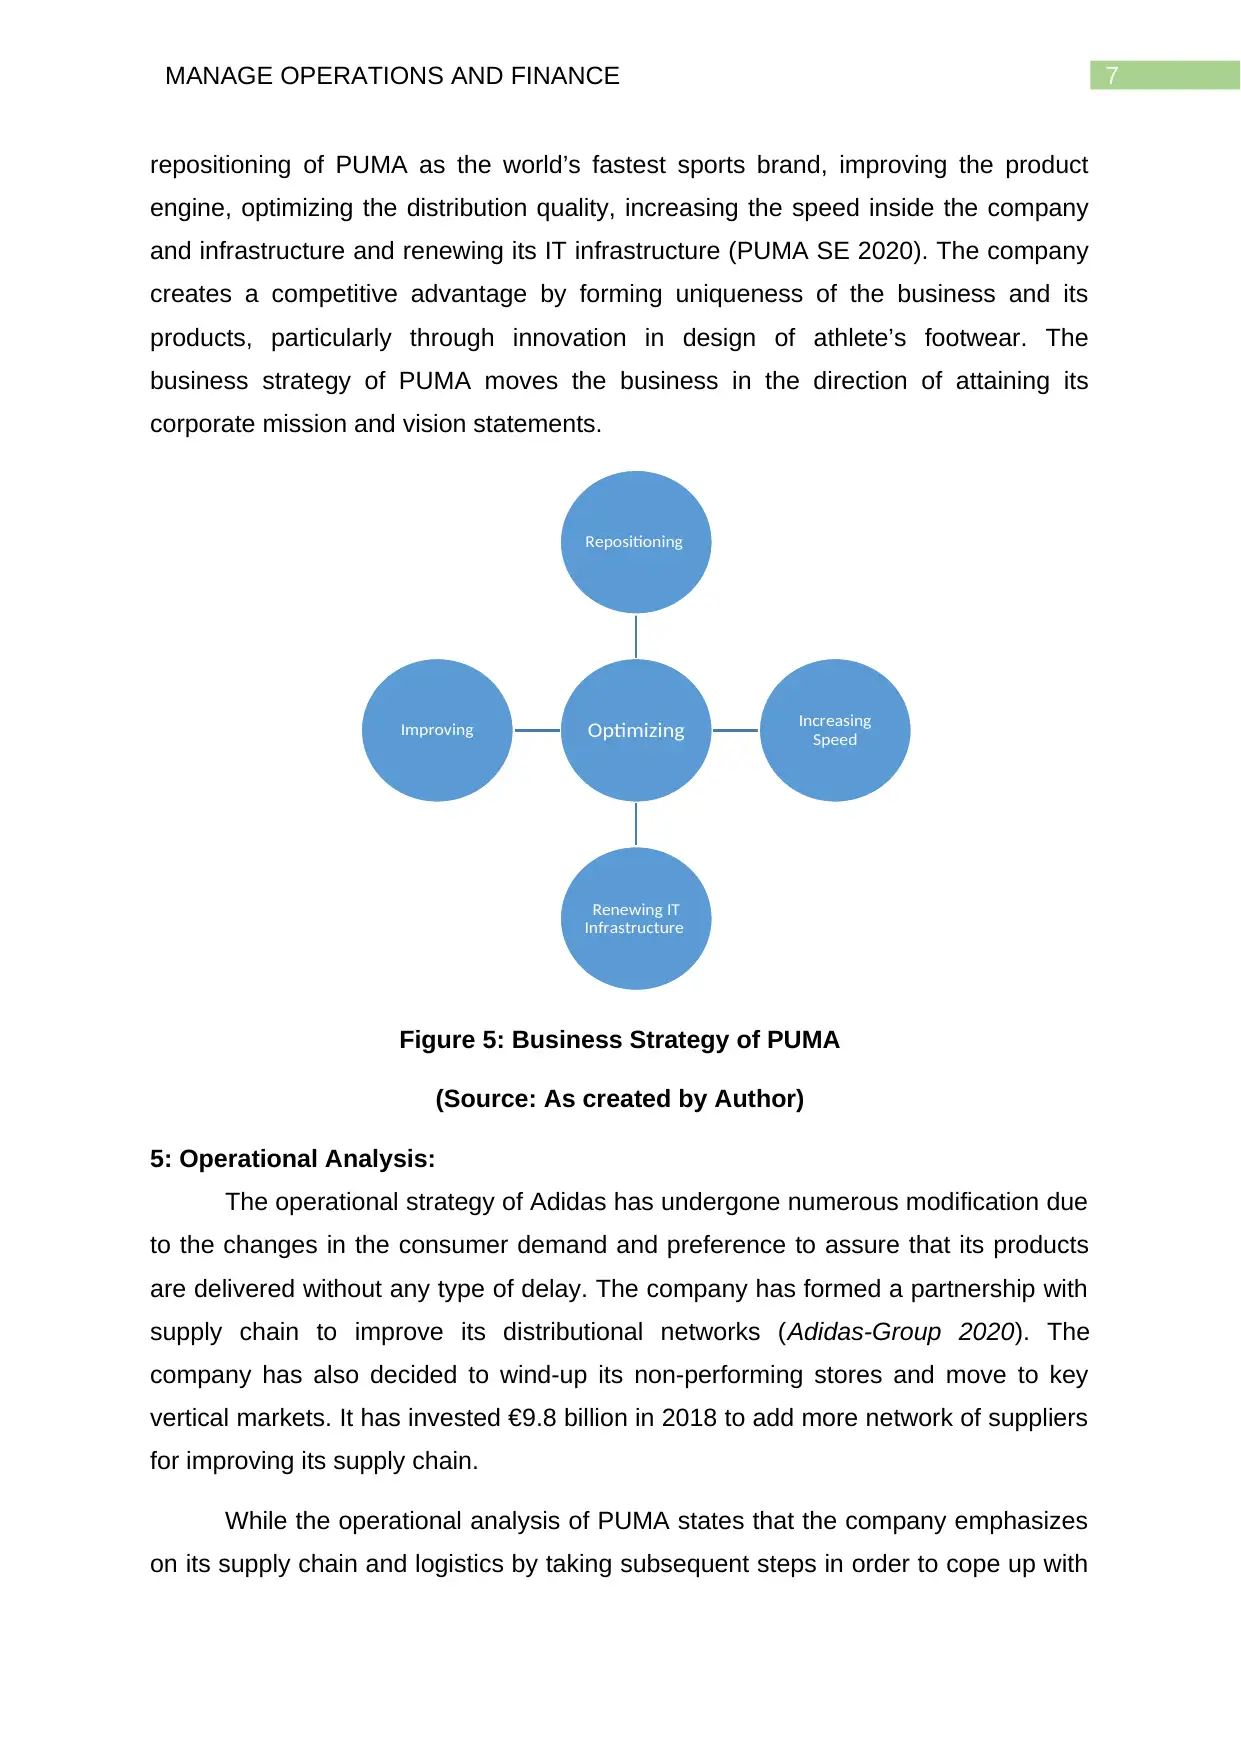
4: Business strategy:
Adidas emphasizes more on the wide range of differentiation strategy. The
business strategy of Adidas emphasizes on innovation, making an effort to generate
new products, service and procedure so that the company can cope up with the
competition (Adidas-Group 2020). The business plan of Adidas is created on three
strategic choices which allows the company to focus on consumers more. This
include
a. Speed: Considering the consumers as hearth of everything, Adidas serves
them in best possible manner to assure that the consumer finds a fresh and
desirable product whenever and wherever needed.
b. Delivering through cities: Urbanization is shaping consumer trends,
perception and purchasing behaviour. Adidas has identified six important
cities where it potentially wants to grow its market share. This include
shanghai, Los Angeles, New York, Paris, Shanghai, London and Tokyo.
c. Open source: This involves collaboration and innovation regarding learning
and sharing. Adidas invites, athletes, consumers and partners to form the
future of sport and sporting culture with the company.
Figure 4: Business Strategy of Adidas
Source: (Adidas-Group 2020)
Puma on the other hand, business strategy is based on differentiation. The
business strategy of PUMA includes five strategic priorities. This involves
Paraphrase This Document
Need a fresh take? Get an instant paraphrase of this document with our AI Paraphraser
7MANAGE OPERATIONS AND FINANCE
repositioning of PUMA as the world’s fastest sports brand, improving the product
engine, optimizing the distribution quality, increasing the speed inside the company
and infrastructure and renewing its IT infrastructure (PUMA SE 2020). The company
creates a competitive advantage by forming uniqueness of the business and its
products, particularly through innovation in design of athlete’s footwear. The
business strategy of PUMA moves the business in the direction of attaining its
corporate mission and vision statements.
Figure 5: Business Strategy of PUMA
(Source: As created by Author)
5: Operational Analysis:
The operational strategy of Adidas has undergone numerous modification due
to the changes in the consumer demand and preference to assure that its products
are delivered without any type of delay. The company has formed a partnership with
supply chain to improve its distributional networks (Adidas-Group 2020). The
company has also decided to wind-up its non-performing stores and move to key
vertical markets. It has invested €9.8 billion in 2018 to add more network of suppliers
for improving its supply chain.
While the operational analysis of PUMA states that the company emphasizes
on its supply chain and logistics by taking subsequent steps in order to cope up with
Optimizing
Repositioning
Increasing
Speed
Renewing IT
Infrastructure
Improving
8MANAGE OPERATIONS AND FINANCE
the risk and barriers that might arise because of the changes in consumer taste and
preference (PUMA SE 2020). To meet the demands of the urbanized customers, it is
implemented SCM concept which provides them about the ideas logistics and supply
chain on priority. PUMA has collaborated with the global logistics company so that it
can reach customers across several target markets.
Chapter 2 Evaluation of performance
1: Financial performance
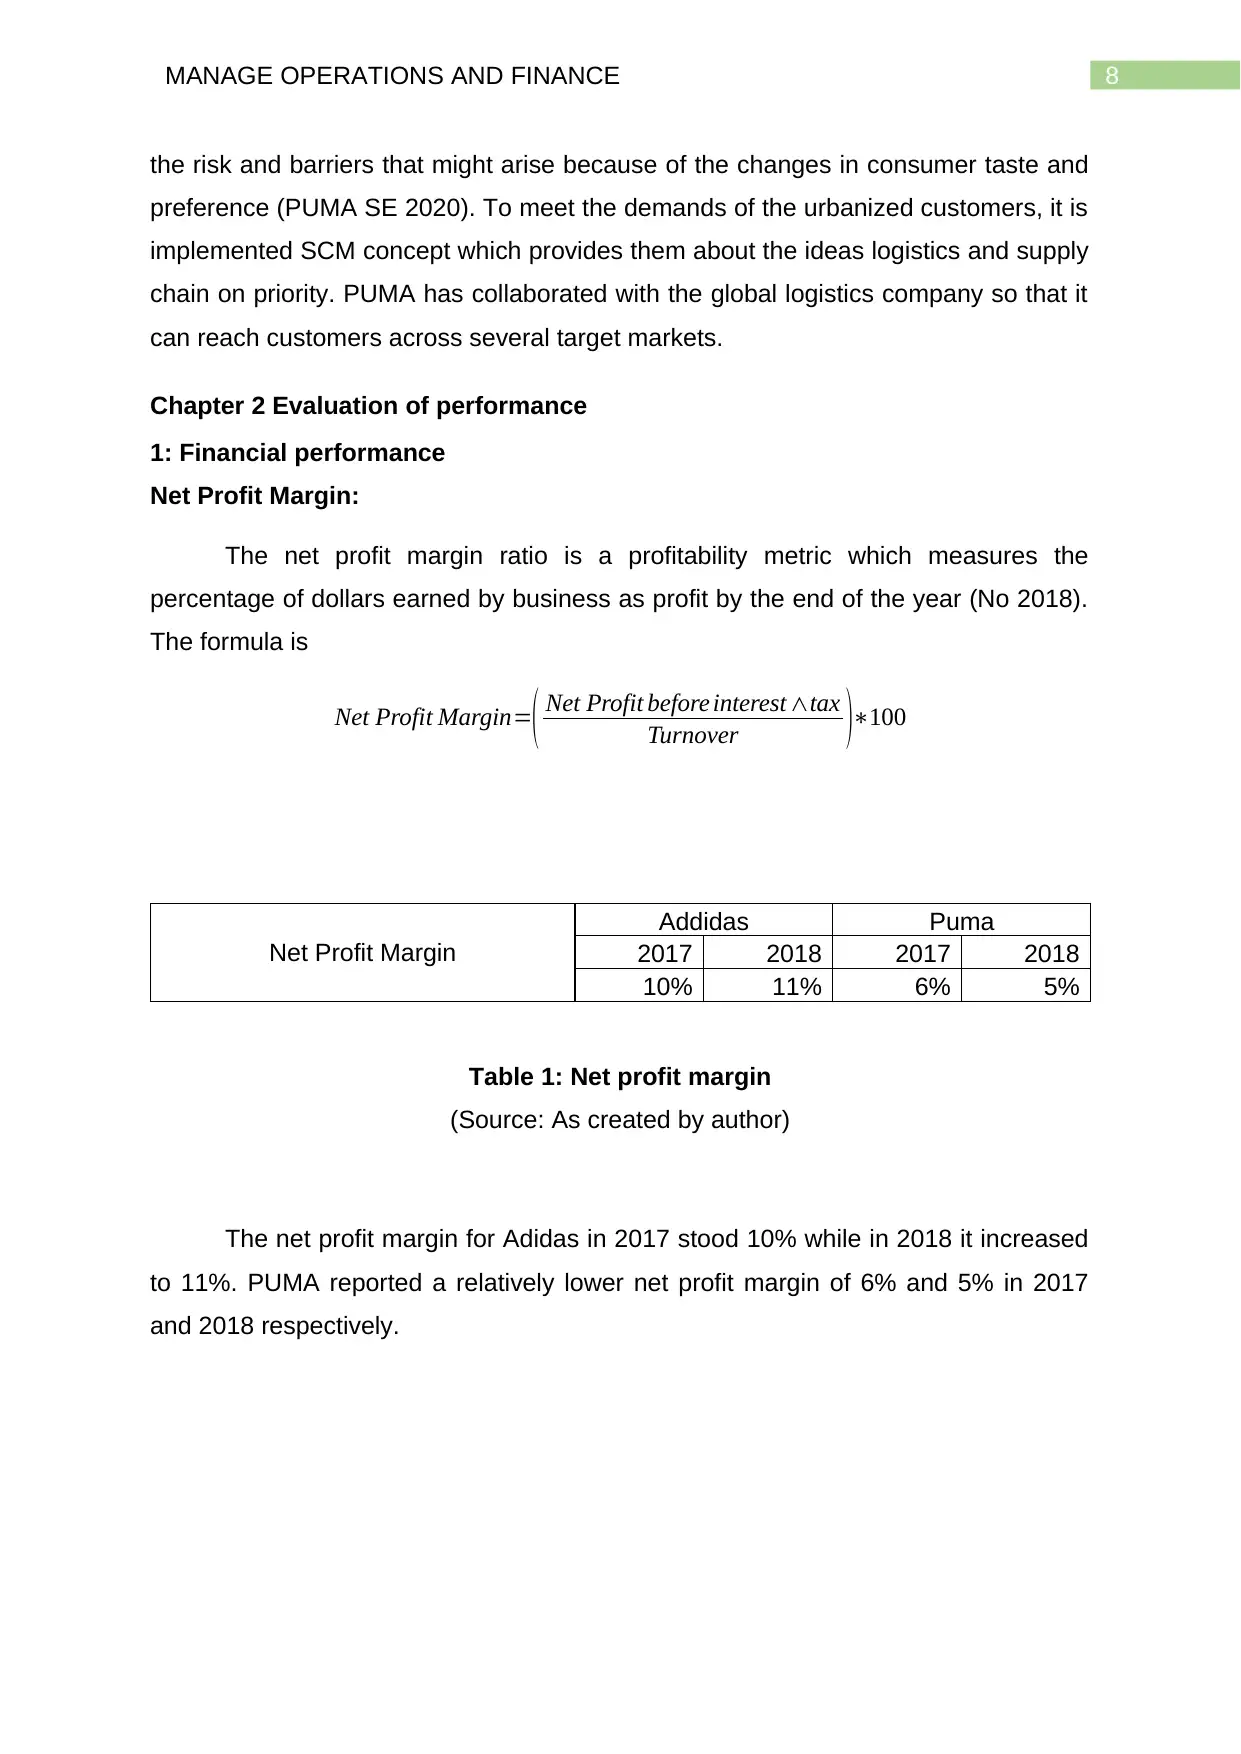
Net Profit Margin:
The net profit margin ratio is a profitability metric which measures the
percentage of dollars earned by business as profit by the end of the year (No 2018).
The formula is
Net Profit Margin=( Net Profit before interest ∧tax
Turnover )∗100
Net Profit Margin
Addidas Puma
2017 2018 2017 2018
10% 11% 6% 5%
Table 1: Net profit margin
(Source: As created by author)
The net profit margin for Adidas in 2017 stood 10% while in 2018 it increased
to 11%. PUMA reported a relatively lower net profit margin of 6% and 5% in 2017
and 2018 respectively.
the risk and barriers that might arise because of the changes in consumer taste and
preference (PUMA SE 2020). To meet the demands of the urbanized customers, it is
implemented SCM concept which provides them about the ideas logistics and supply
chain on priority. PUMA has collaborated with the global logistics company so that it
can reach customers across several target markets.
Chapter 2 Evaluation of performance
1: Financial performance
Net Profit Margin:
The net profit margin ratio is a profitability metric which measures the
percentage of dollars earned by business as profit by the end of the year (No 2018).
The formula is
Net Profit Margin=( Net Profit before interest ∧tax
Turnover )∗100
Net Profit Margin
Addidas Puma
2017 2018 2017 2018
10% 11% 6% 5%
Table 1: Net profit margin
(Source: As created by author)
The net profit margin for Adidas in 2017 stood 10% while in 2018 it increased
to 11%. PUMA reported a relatively lower net profit margin of 6% and 5% in 2017
and 2018 respectively.
⊘ This is a preview!⊘
Do you want full access?
Subscribe today to unlock all pages.
Trusted by 1+ million students worldwide
9MANAGE OPERATIONS AND FINANCE
2017 2018 2017 2018
Addidas Puma
10%
11%
6% 5%
Net Profit Margin
Figure 6: Net Profit Margin
(Source: As created by author)
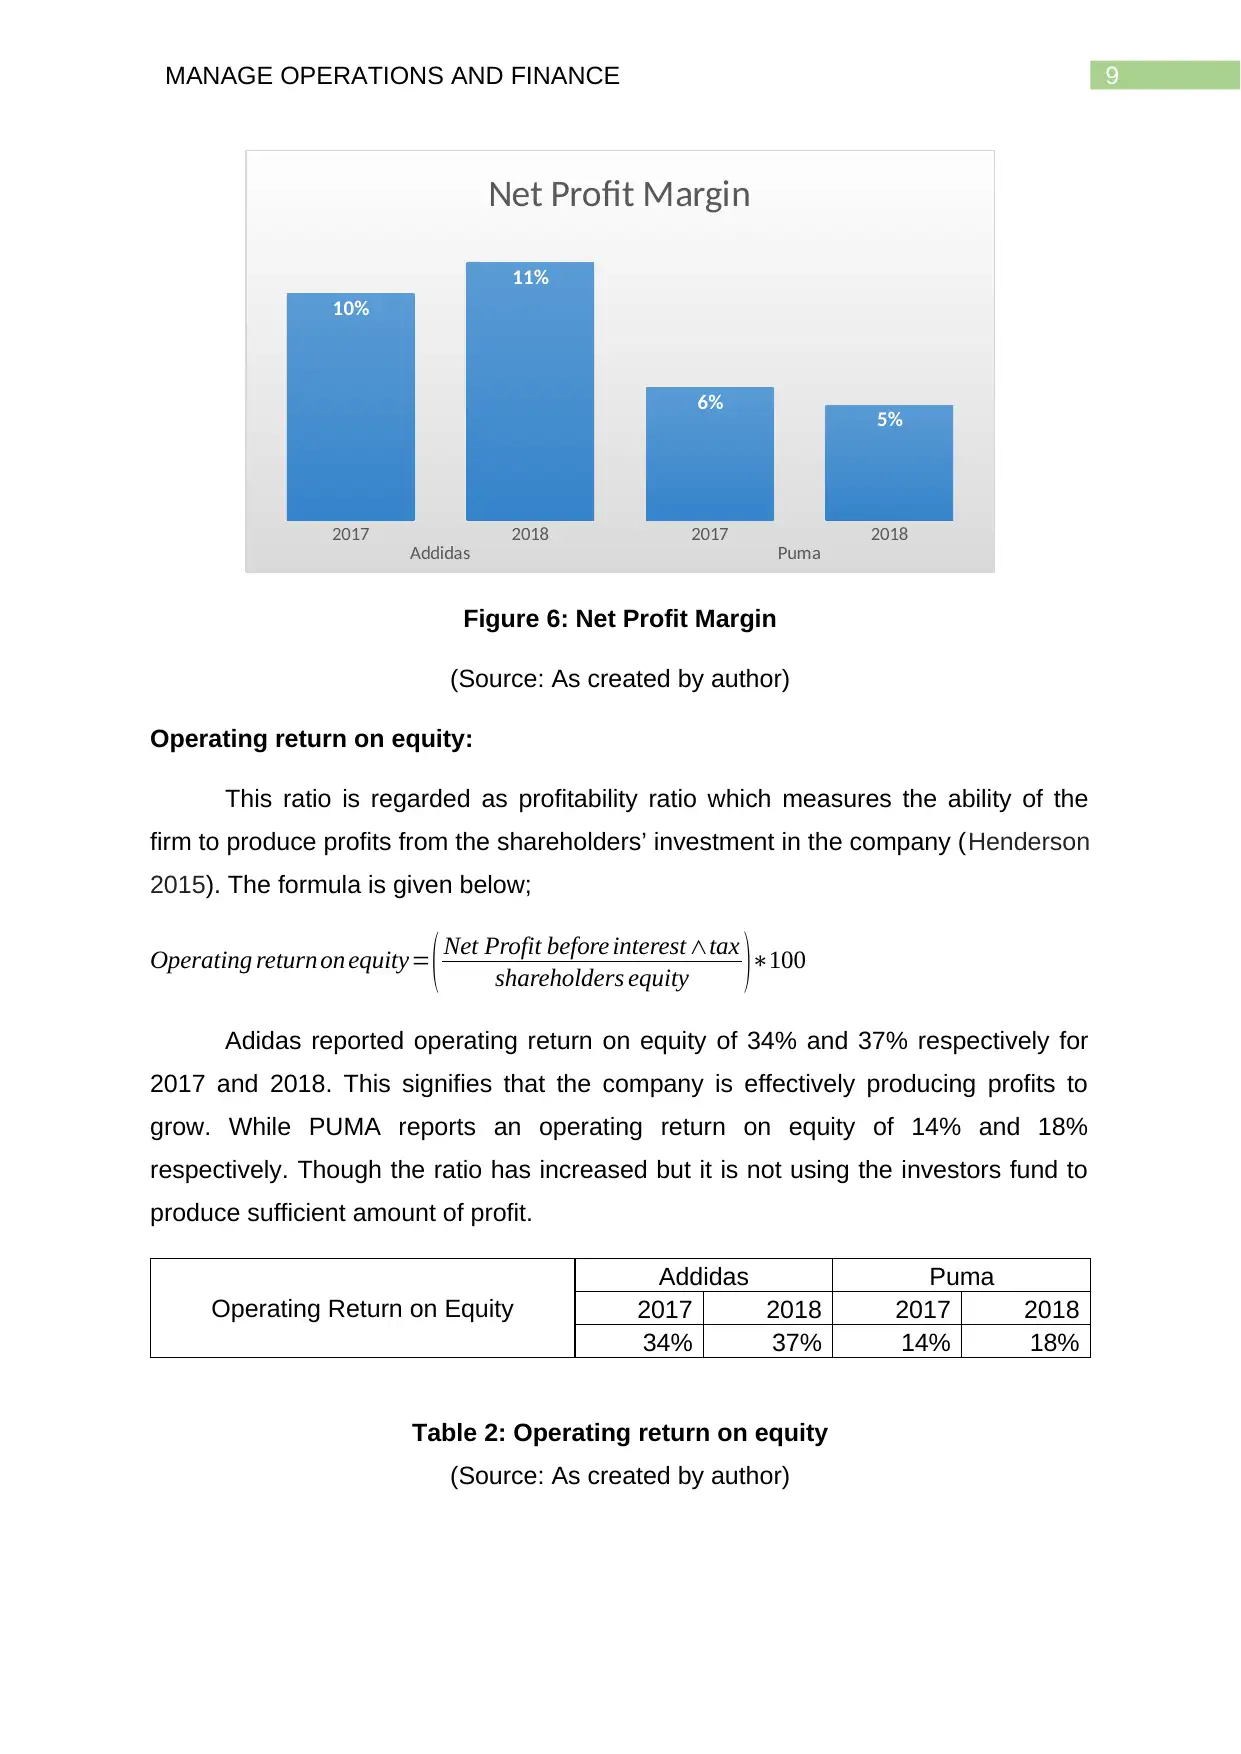
Operating return on equity:
This ratio is regarded as profitability ratio which measures the ability of the
firm to produce profits from the shareholders’ investment in the company (Henderson
2015). The formula is given below;
Operating return on equity= ( Net Profit before interest ∧tax
shareholders equity )∗100
Adidas reported operating return on equity of 34% and 37% respectively for
2017 and 2018. This signifies that the company is effectively producing profits to
grow. While PUMA reports an operating return on equity of 14% and 18%
respectively. Though the ratio has increased but it is not using the investors fund to
produce sufficient amount of profit.
Operating Return on Equity
Addidas Puma
2017 2018 2017 2018
34% 37% 14% 18%
Table 2: Operating return on equity
(Source: As created by author)
2017 2018 2017 2018
Addidas Puma
10%
11%
6% 5%
Net Profit Margin
Figure 6: Net Profit Margin
(Source: As created by author)
Operating return on equity:
This ratio is regarded as profitability ratio which measures the ability of the
firm to produce profits from the shareholders’ investment in the company (Henderson
2015). The formula is given below;
Operating return on equity= ( Net Profit before interest ∧tax
shareholders equity )∗100
Adidas reported operating return on equity of 34% and 37% respectively for
2017 and 2018. This signifies that the company is effectively producing profits to
grow. While PUMA reports an operating return on equity of 14% and 18%
respectively. Though the ratio has increased but it is not using the investors fund to
produce sufficient amount of profit.
Operating Return on Equity
Addidas Puma
2017 2018 2017 2018
34% 37% 14% 18%
Table 2: Operating return on equity
(Source: As created by author)
Paraphrase This Document
Need a fresh take? Get an instant paraphrase of this document with our AI Paraphraser
10MANAGE OPERATIONS AND FINANCE
2017 2018 2017 2018
Addidas Puma
0%
5%
10%
15%
20%
25%
30%
35%
40%
34%
37%
14%
18%
Operati ng Return on Equity
Figure 7: Operating return on equity
(Source: As created by author)
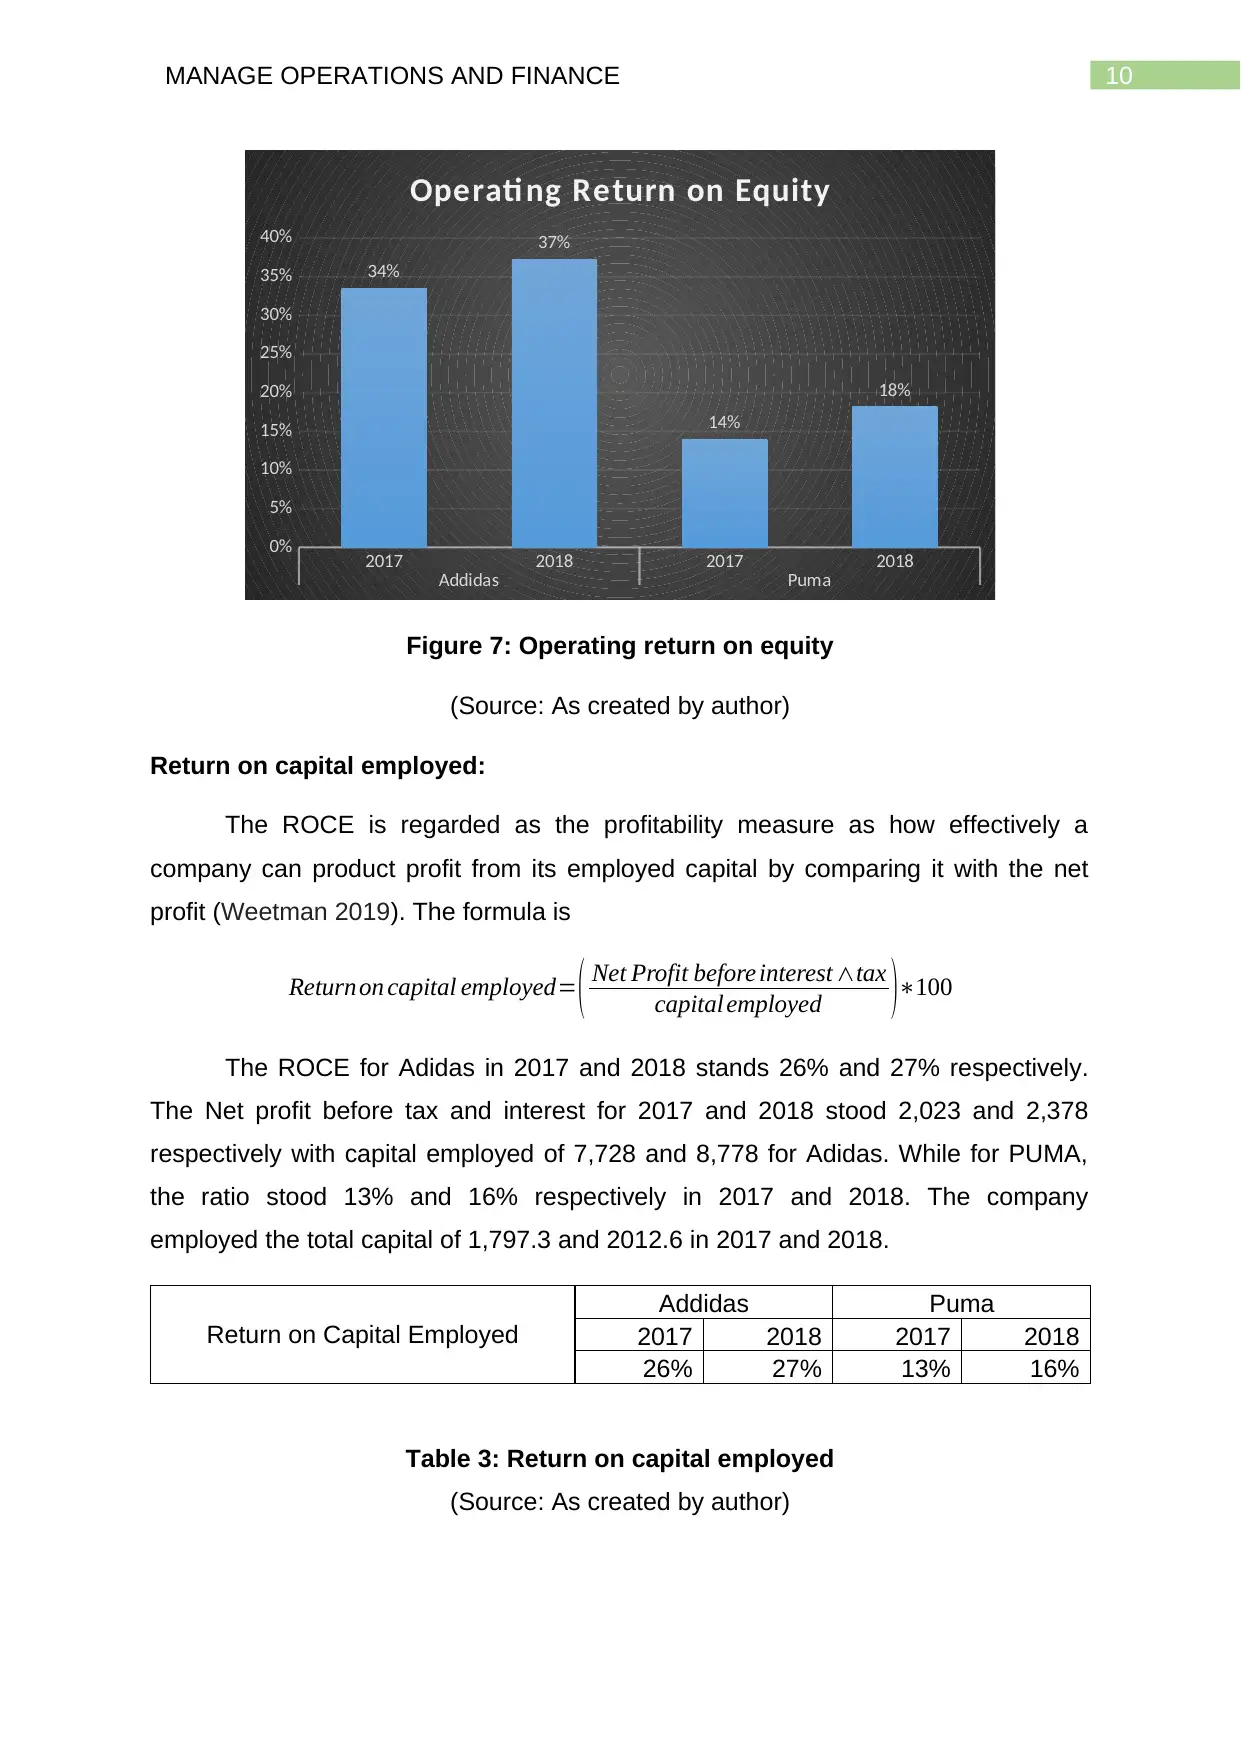
Return on capital employed:
The ROCE is regarded as the profitability measure as how effectively a
company can product profit from its employed capital by comparing it with the net
profit (Weetman 2019). The formula is
Returnon capital employed= ( Net Profit before interest ∧tax
capital employed )∗100
The ROCE for Adidas in 2017 and 2018 stands 26% and 27% respectively.
The Net profit before tax and interest for 2017 and 2018 stood 2,023 and 2,378
respectively with capital employed of 7,728 and 8,778 for Adidas. While for PUMA,
the ratio stood 13% and 16% respectively in 2017 and 2018. The company
employed the total capital of 1,797.3 and 2012.6 in 2017 and 2018.
Return on Capital Employed
Addidas Puma
2017 2018 2017 2018
26% 27% 13% 16%
Table 3: Return on capital employed
(Source: As created by author)
2017 2018 2017 2018
Addidas Puma
0%
5%
10%
15%
20%
25%
30%
35%
40%
34%
37%
14%
18%
Operati ng Return on Equity
Figure 7: Operating return on equity
(Source: As created by author)
Return on capital employed:
The ROCE is regarded as the profitability measure as how effectively a
company can product profit from its employed capital by comparing it with the net
profit (Weetman 2019). The formula is
Returnon capital employed= ( Net Profit before interest ∧tax
capital employed )∗100
The ROCE for Adidas in 2017 and 2018 stands 26% and 27% respectively.
The Net profit before tax and interest for 2017 and 2018 stood 2,023 and 2,378
respectively with capital employed of 7,728 and 8,778 for Adidas. While for PUMA,
the ratio stood 13% and 16% respectively in 2017 and 2018. The company
employed the total capital of 1,797.3 and 2012.6 in 2017 and 2018.
Return on Capital Employed
Addidas Puma
2017 2018 2017 2018
26% 27% 13% 16%
Table 3: Return on capital employed
(Source: As created by author)
11MANAGE OPERATIONS AND FINANCE
2017 2018 2017 2018
Addidas Puma
26% 27%
13%
16%
Return on Capital Employed
Figure 8: Return on capital employed
(Source: As created by author)
2: Risk analysis
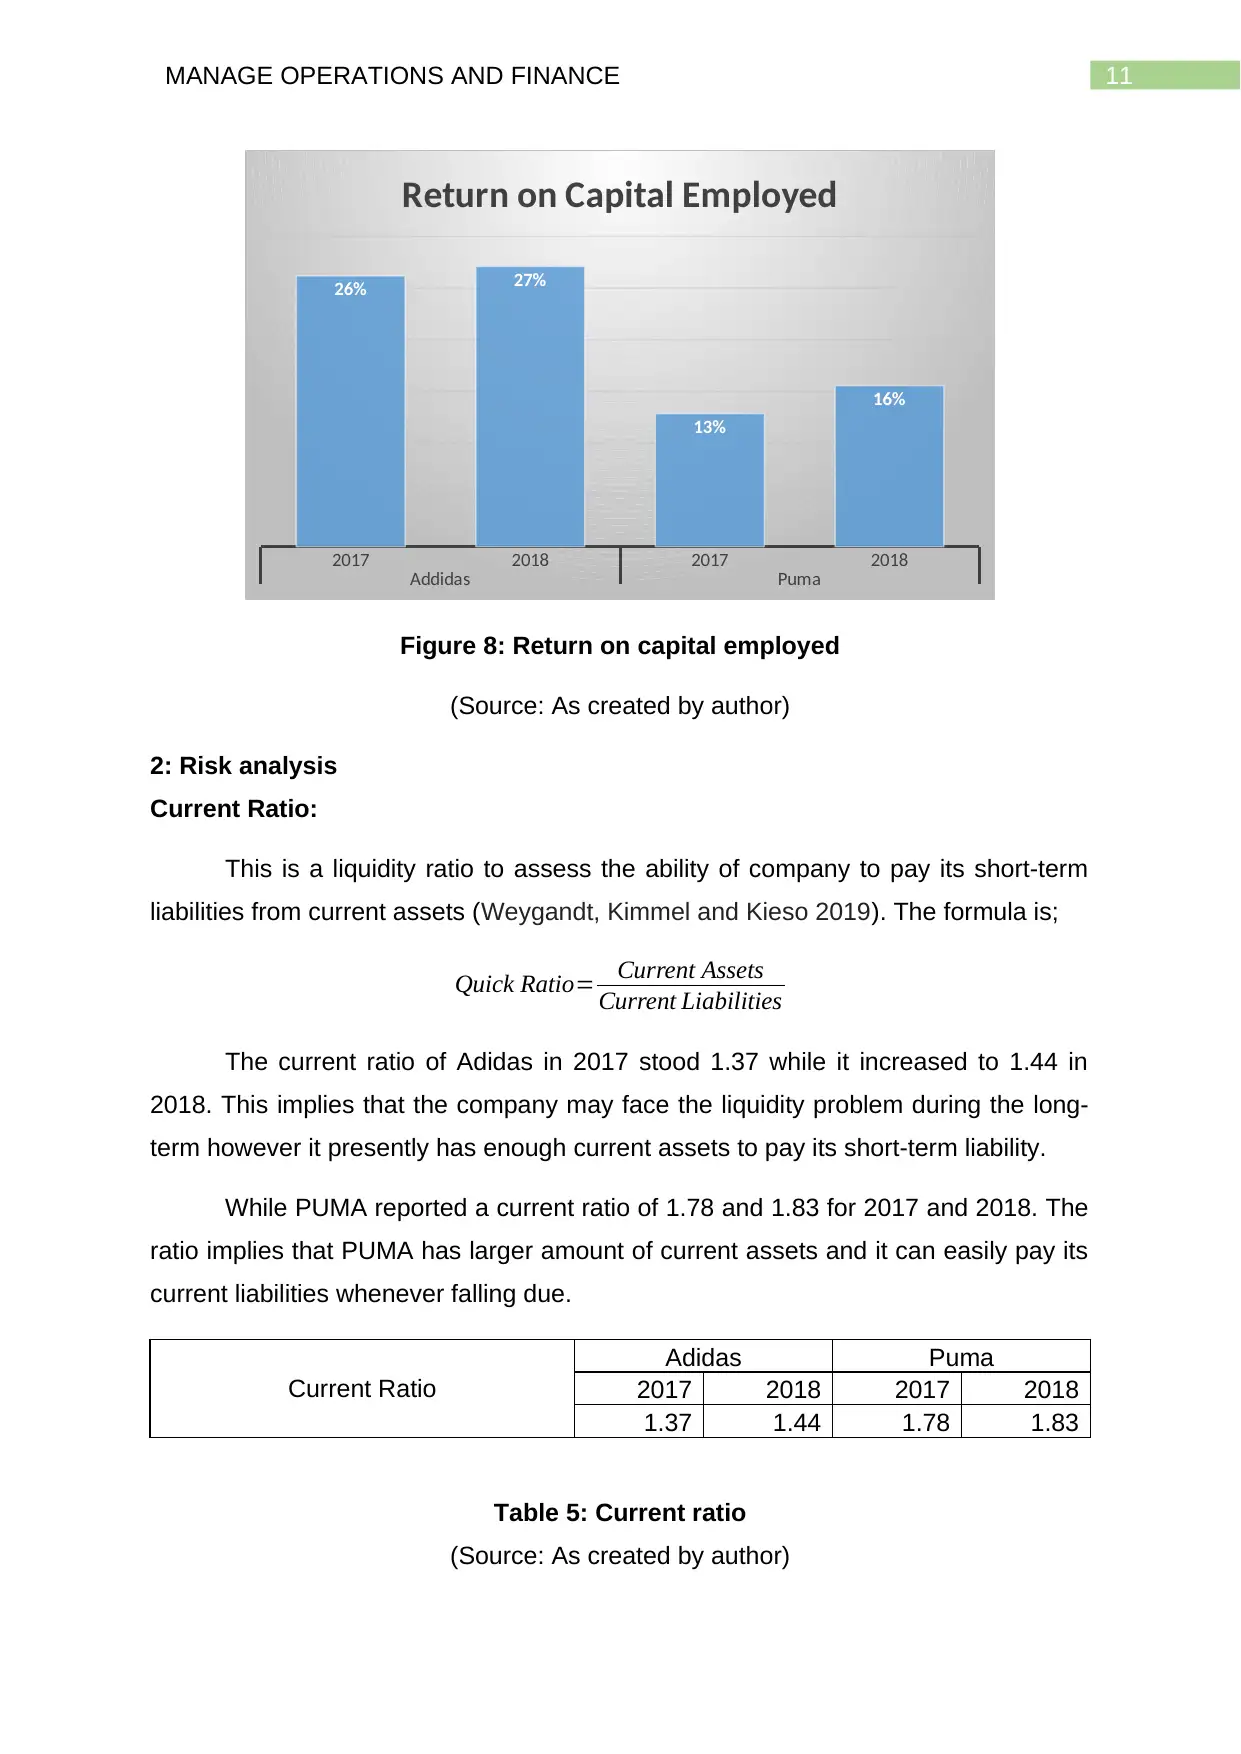
Current Ratio:
This is a liquidity ratio to assess the ability of company to pay its short-term
liabilities from current assets (Weygandt, Kimmel and Kieso 2019). The formula is;
Quick Ratio= Current Assets
Current Liabilities
The current ratio of Adidas in 2017 stood 1.37 while it increased to 1.44 in
2018. This implies that the company may face the liquidity problem during the long-
term however it presently has enough current assets to pay its short-term liability.
While PUMA reported a current ratio of 1.78 and 1.83 for 2017 and 2018. The
ratio implies that PUMA has larger amount of current assets and it can easily pay its
current liabilities whenever falling due.
Current Ratio
Adidas Puma
2017 2018 2017 2018
1.37 1.44 1.78 1.83
Table 5: Current ratio
(Source: As created by author)
2017 2018 2017 2018
Addidas Puma
26% 27%
13%
16%
Return on Capital Employed
Figure 8: Return on capital employed
(Source: As created by author)
2: Risk analysis
Current Ratio:
This is a liquidity ratio to assess the ability of company to pay its short-term
liabilities from current assets (Weygandt, Kimmel and Kieso 2019). The formula is;
Quick Ratio= Current Assets
Current Liabilities
The current ratio of Adidas in 2017 stood 1.37 while it increased to 1.44 in
2018. This implies that the company may face the liquidity problem during the long-
term however it presently has enough current assets to pay its short-term liability.
While PUMA reported a current ratio of 1.78 and 1.83 for 2017 and 2018. The
ratio implies that PUMA has larger amount of current assets and it can easily pay its
current liabilities whenever falling due.
Current Ratio
Adidas Puma
2017 2018 2017 2018
1.37 1.44 1.78 1.83
Table 5: Current ratio
(Source: As created by author)
⊘ This is a preview!⊘
Do you want full access?
Subscribe today to unlock all pages.
Trusted by 1+ million students worldwide
1 out of 29
Related Documents


Your All-in-One AI-Powered Toolkit for Academic Success.
+13062052269
info@desklib.com
Available 24*7 on WhatsApp / Email
![[object Object]](/_next/static/media/star-bottom.7253800d.svg)
Unlock your academic potential
Copyright © 2020–2026 A2Z Services. All Rights Reserved. Developed and managed by ZUCOL.