FAME: Financial Analysis of Turkish, Lufthansa, and Emirates Airlines
VerifiedAdded on 2020/11/12
|11
|3772
|484
Report
AI Summary
This report presents a financial analysis of three major airlines: Turkish Airlines, Lufthansa, and Emirates. The analysis includes a critical examination of their financial performance and financial positions, utilizing ratio analysis to evaluate profitability, liquidity, asset turnover, and financial leverage over a four-year period (2013-2016 for Turkish and Lufthansa). The report also provides a detailed analysis of Emirates' annual cash flow statements from 2012 to 2016. The study assesses the companies' financial health, identifies trends, and compares their performances, offering insights into their strengths and weaknesses based on their financial statements and key performance indicators. The report concludes with an equity research on findings and conclusions.

Financial Analysis
Management & Enterprise
– FAME
Management & Enterprise
– FAME
Paraphrase This Document
Need a fresh take? Get an instant paraphrase of this document with our AI Paraphraser
Table of Contents
INTRODUCTION...........................................................................................................................1
(a): Critical analysis of the financial performance and financial position of the companies.......1
Report of equity research on findings and conclusion.................................................................4
(b): Critically analyse the annual cash flow statements of Emirates, over the Five-year period,
2012 to 2016,...............................................................................................................................6
CONCLUSION................................................................................................................................8
REFERENCES................................................................................................................................9
INTRODUCTION
Finance is one of the crucial aspects for an organisation that can help in attaining overall
plans that are set in the near future time. It is an important part without which no any projects can
be accomplished. The basic aim of every manager to increase the profitability of the company
that would be achieve through proper utilisation of financial resources of an organisation.
Financial analysis is the essential process which would be used by the manager to evaluate
businesses and other budgets that are related with entities to determine their performance as well
as future sustainability of the company (Brigham and Houston, 2012). This project is based on
financial analysis of three airlines company such as “Turkish Airlines, Lufthansa and Emirates”.
This will have used to compare with the financial performance and financial position of the first
two companies of the last four years. Apart from this, critical analysis of the annual cash flow
statements of “Emirates” from the five-year time period.
(a): Critical analysis of the financial performance and financial position of the companies
Overview of the company
TURKISH AIRLINES was established in 1933 as a national flag carrier airline, since
then its operations are continuously growing and as of now it has 304 destinations in Europe,
Asia, Africa and the America which makes it largest carrier in the world. Turkish airline flies to
122 countries which provides them highest destination to serve and it serves to largest passenger
group. Since then it is continuously growing and in 1980s a technical centre was opened in
which both light and heavy flights was taken care to provide better service and to reduce air
accidents which creates a positive image and also better services attracts more consumers. This
continuous growth in covering more and more destination and availability of direct flights to
destination make Turkish airlines more popular (Baxter and et. al., 2013).
Turkish Airlines was chosen as "Europe's Best Airline" for the fifth and "Best Airline
in Southern Europe" for the seventh consecutive time in year 2015.
Financial performance of every organisation is always measured with its financial
statements such as its cash flow statement, profit and loss account, balance sheet.
RATIO ANALYSIS OF TURKISH AIRLINES IN LAST FOUR YEARS
(2013-2016)
Formula 2016 2015 2014 2013
1
⊘ This is a preview!⊘
Do you want full access?
Subscribe today to unlock all pages.
Trusted by 1+ million students worldwide
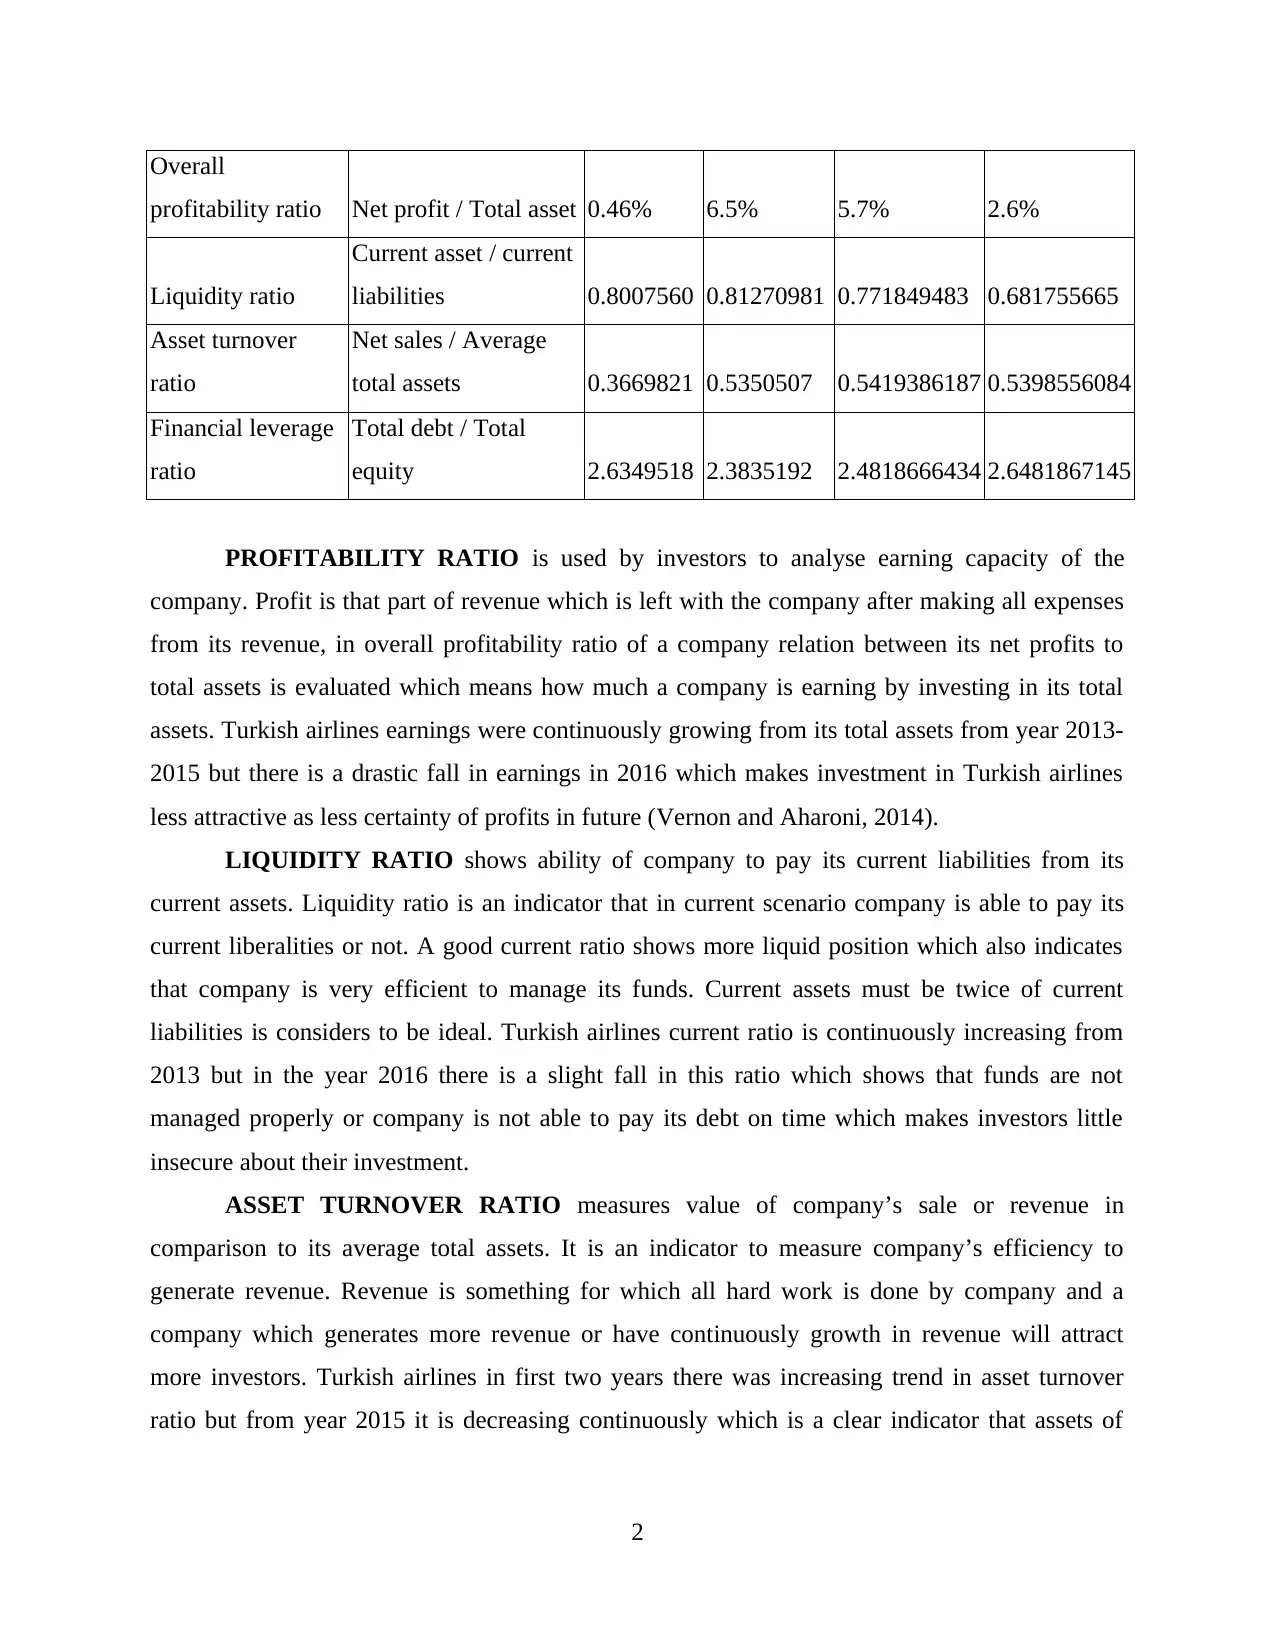
Overall
profitability ratio Net profit / Total asset 0.46% 6.5% 5.7% 2.6%
Liquidity ratio
Current asset / current
liabilities 0.8007560 0.81270981 0.771849483 0.681755665
Asset turnover
ratio
Net sales / Average
total assets 0.3669821 0.5350507 0.5419386187 0.5398556084
Financial leverage
ratio
Total debt / Total
equity 2.6349518 2.3835192 2.4818666434 2.6481867145
PROFITABILITY RATIO is used by investors to analyse earning capacity of the
company. Profit is that part of revenue which is left with the company after making all expenses
from its revenue, in overall profitability ratio of a company relation between its net profits to
total assets is evaluated which means how much a company is earning by investing in its total
assets. Turkish airlines earnings were continuously growing from its total assets from year 2013-
2015 but there is a drastic fall in earnings in 2016 which makes investment in Turkish airlines
less attractive as less certainty of profits in future (Vernon and Aharoni, 2014).
LIQUIDITY RATIO shows ability of company to pay its current liabilities from its
current assets. Liquidity ratio is an indicator that in current scenario company is able to pay its
current liberalities or not. A good current ratio shows more liquid position which also indicates
that company is very efficient to manage its funds. Current assets must be twice of current
liabilities is considers to be ideal. Turkish airlines current ratio is continuously increasing from
2013 but in the year 2016 there is a slight fall in this ratio which shows that funds are not
managed properly or company is not able to pay its debt on time which makes investors little
insecure about their investment.
ASSET TURNOVER RATIO measures value of company’s sale or revenue in
comparison to its average total assets. It is an indicator to measure company’s efficiency to
generate revenue. Revenue is something for which all hard work is done by company and a
company which generates more revenue or have continuously growth in revenue will attract
more investors. Turkish airlines in first two years there was increasing trend in asset turnover
ratio but from year 2015 it is decreasing continuously which is a clear indicator that assets of
2
Paraphrase This Document
Need a fresh take? Get an instant paraphrase of this document with our AI Paraphraser
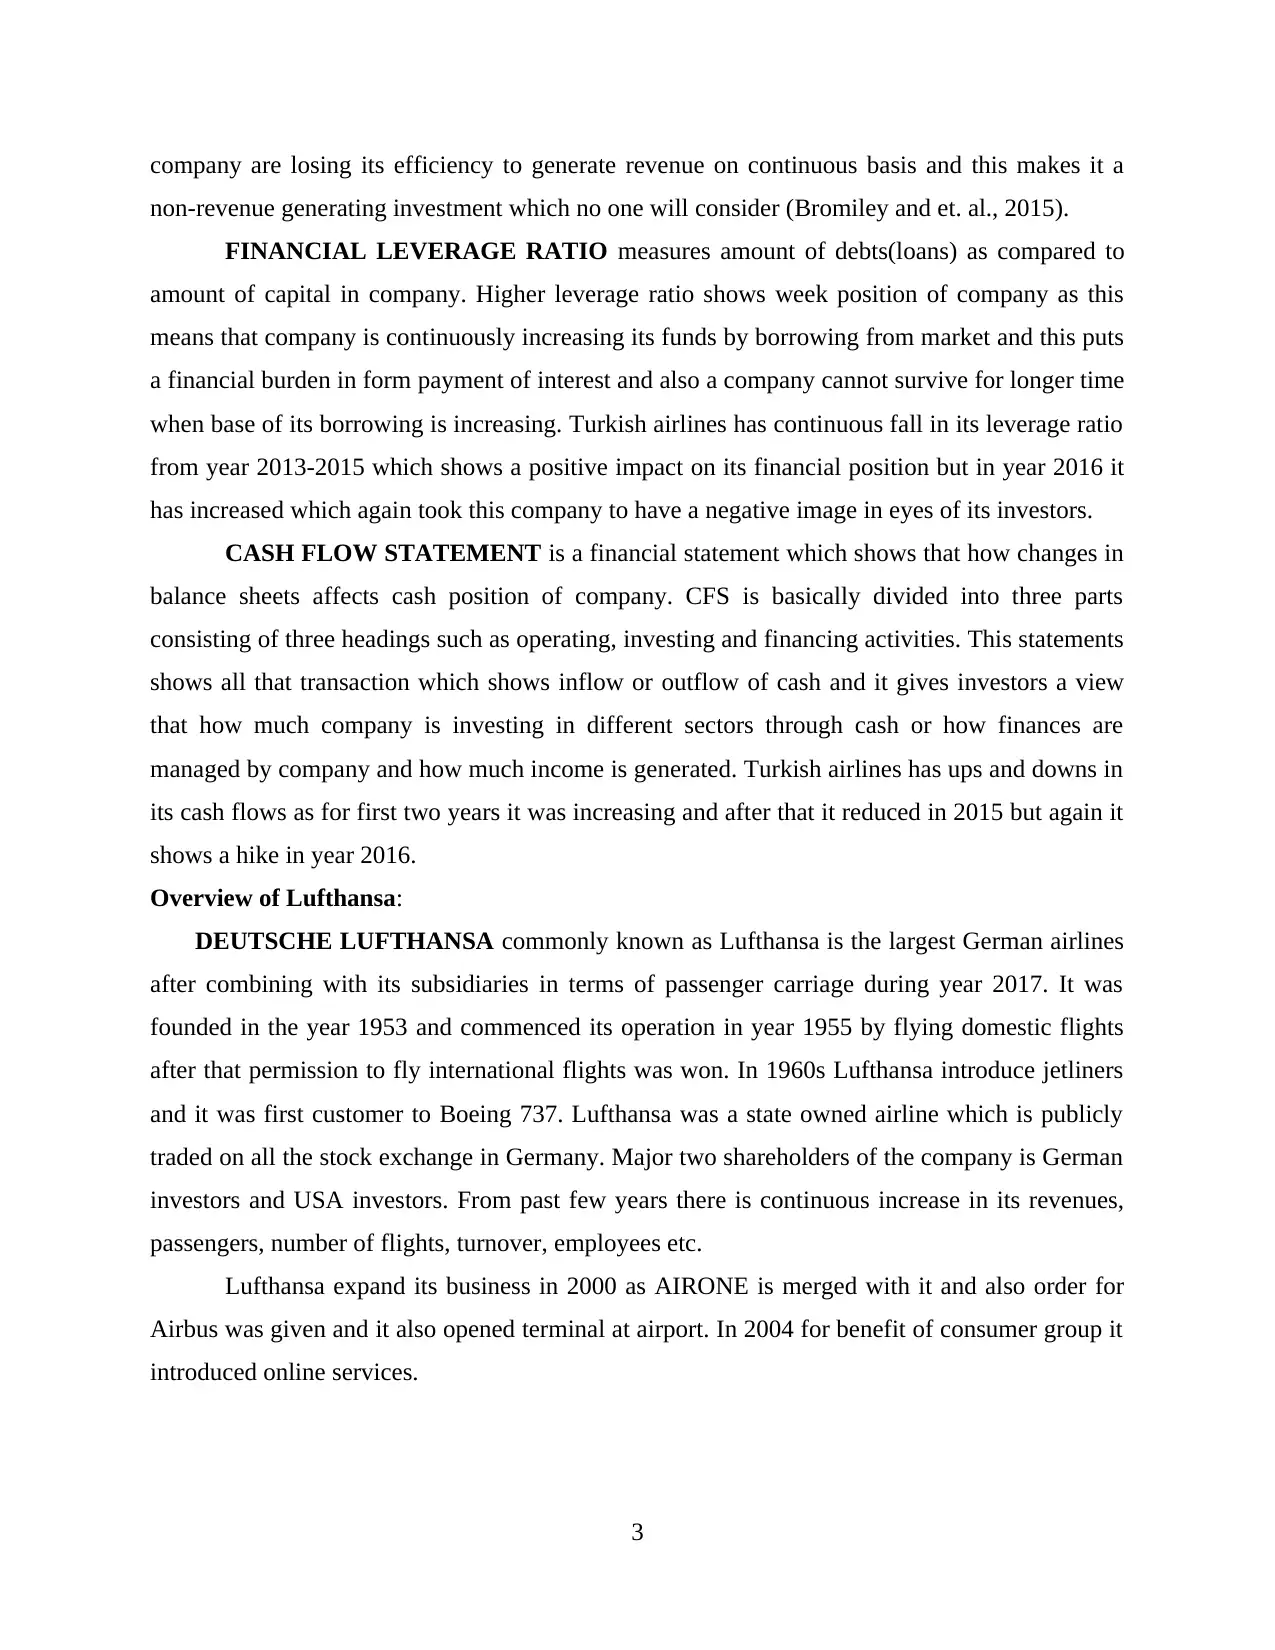
company are losing its efficiency to generate revenue on continuous basis and this makes it a
non-revenue generating investment which no one will consider (Bromiley and et. al., 2015).
FINANCIAL LEVERAGE RATIO measures amount of debts(loans) as compared to
amount of capital in company. Higher leverage ratio shows week position of company as this
means that company is continuously increasing its funds by borrowing from market and this puts
a financial burden in form payment of interest and also a company cannot survive for longer time
when base of its borrowing is increasing. Turkish airlines has continuous fall in its leverage ratio
from year 2013-2015 which shows a positive impact on its financial position but in year 2016 it
has increased which again took this company to have a negative image in eyes of its investors.
CASH FLOW STATEMENT is a financial statement which shows that how changes in
balance sheets affects cash position of company. CFS is basically divided into three parts
consisting of three headings such as operating, investing and financing activities. This statements
shows all that transaction which shows inflow or outflow of cash and it gives investors a view
that how much company is investing in different sectors through cash or how finances are
managed by company and how much income is generated. Turkish airlines has ups and downs in
its cash flows as for first two years it was increasing and after that it reduced in 2015 but again it
shows a hike in year 2016.
Overview of Lufthansa:
DEUTSCHE LUFTHANSA commonly known as Lufthansa is the largest German airlines
after combining with its subsidiaries in terms of passenger carriage during year 2017. It was
founded in the year 1953 and commenced its operation in year 1955 by flying domestic flights
after that permission to fly international flights was won. In 1960s Lufthansa introduce jetliners
and it was first customer to Boeing 737. Lufthansa was a state owned airline which is publicly
traded on all the stock exchange in Germany. Major two shareholders of the company is German
investors and USA investors. From past few years there is continuous increase in its revenues,
passengers, number of flights, turnover, employees etc.
Lufthansa expand its business in 2000 as AIRONE is merged with it and also order for
Airbus was given and it also opened terminal at airport. In 2004 for benefit of consumer group it
introduced online services.
3
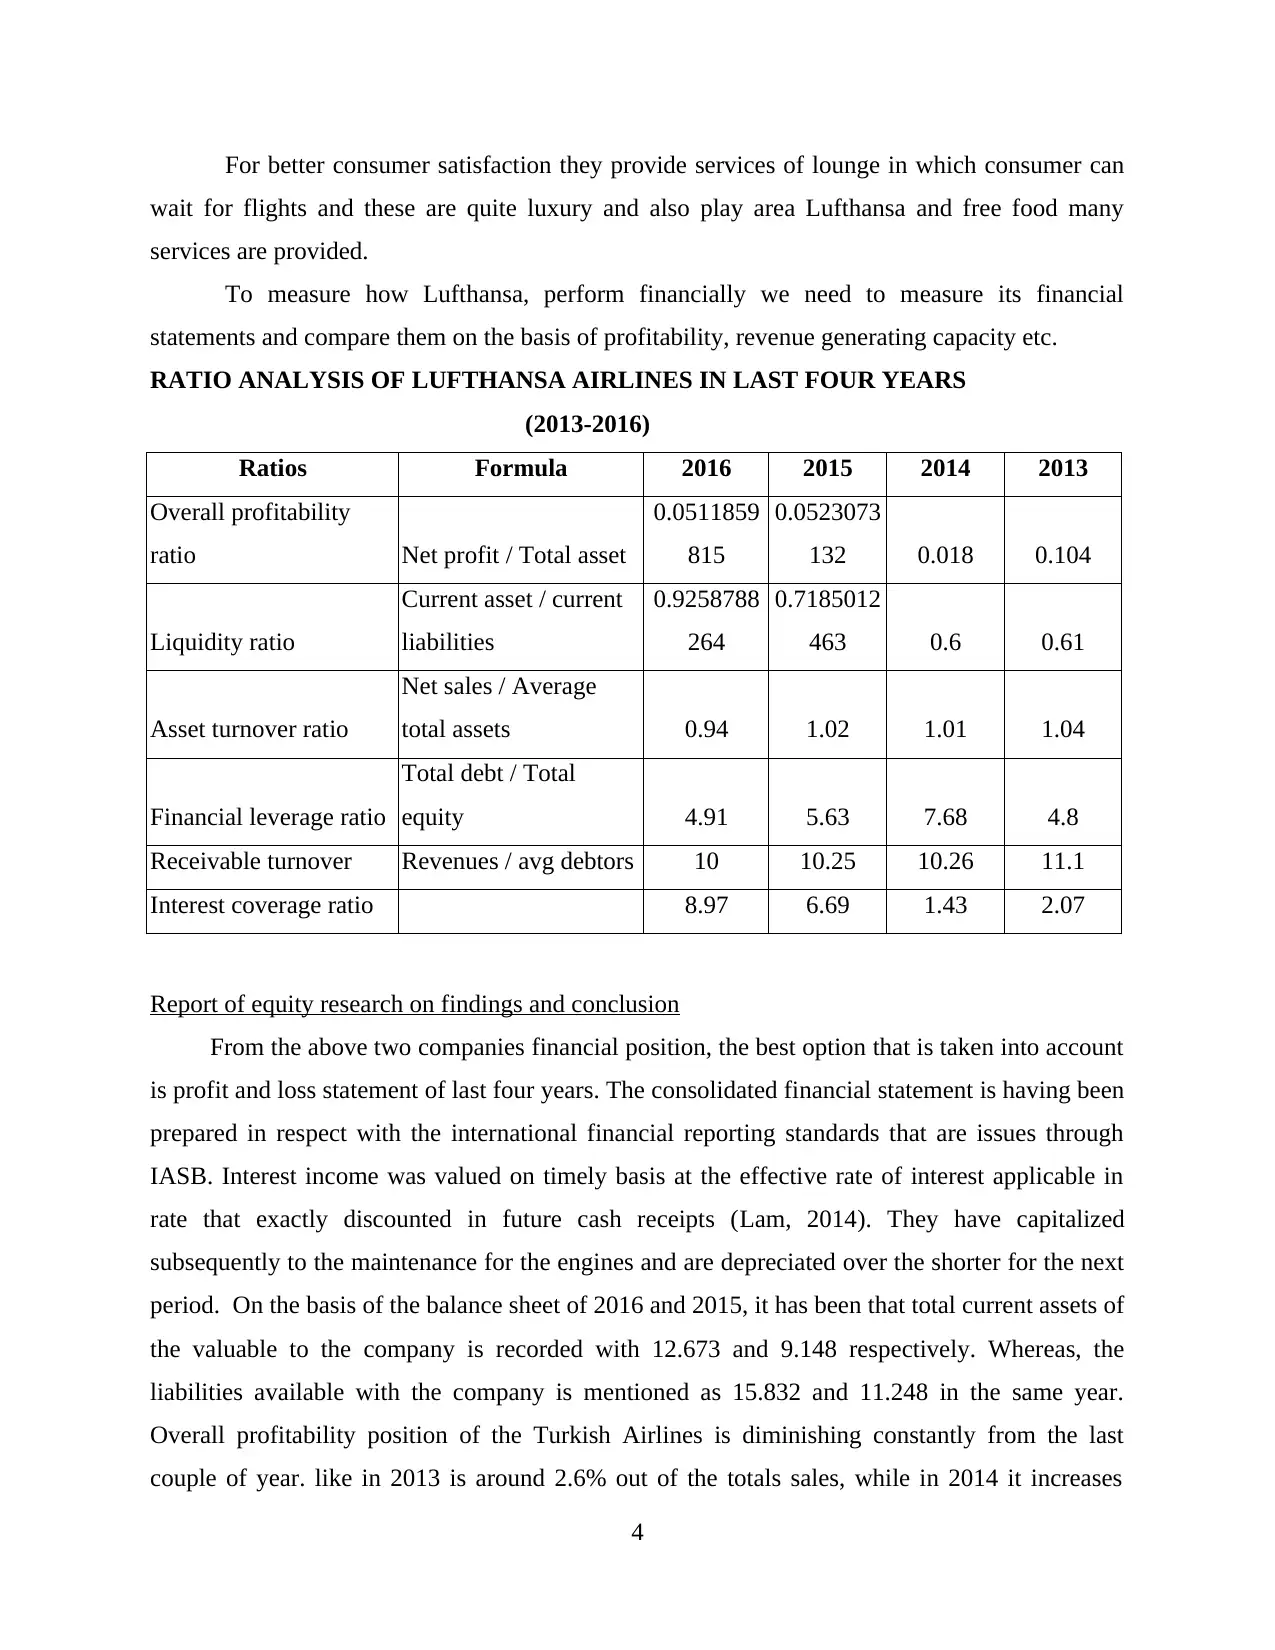
For better consumer satisfaction they provide services of lounge in which consumer can
wait for flights and these are quite luxury and also play area Lufthansa and free food many
services are provided.
To measure how Lufthansa, perform financially we need to measure its financial
statements and compare them on the basis of profitability, revenue generating capacity etc.
RATIO ANALYSIS OF LUFTHANSA AIRLINES IN LAST FOUR YEARS
(2013-2016)
Ratios Formula 2016 2015 2014 2013
Overall profitability
ratio Net profit / Total asset
0.0511859
815
0.0523073
132 0.018 0.104
Liquidity ratio
Current asset / current
liabilities
0.9258788
264
0.7185012
463 0.6 0.61
Asset turnover ratio
Net sales / Average
total assets 0.94 1.02 1.01 1.04
Financial leverage ratio
Total debt / Total
equity 4.91 5.63 7.68 4.8
Receivable turnover Revenues / avg debtors 10 10.25 10.26 11.1
Interest coverage ratio 8.97 6.69 1.43 2.07
Report of equity research on findings and conclusion
From the above two companies financial position, the best option that is taken into account
is profit and loss statement of last four years. The consolidated financial statement is having been
prepared in respect with the international financial reporting standards that are issues through
IASB. Interest income was valued on timely basis at the effective rate of interest applicable in
rate that exactly discounted in future cash receipts (Lam, 2014). They have capitalized
subsequently to the maintenance for the engines and are depreciated over the shorter for the next
period. On the basis of the balance sheet of 2016 and 2015, it has been that total current assets of
the valuable to the company is recorded with 12.673 and 9.148 respectively. Whereas, the
liabilities available with the company is mentioned as 15.832 and 11.248 in the same year.
Overall profitability position of the Turkish Airlines is diminishing constantly from the last
couple of year. like in 2013 is around 2.6% out of the totals sales, while in 2014 it increases
4
⊘ This is a preview!⊘
Do you want full access?
Subscribe today to unlock all pages.
Trusted by 1+ million students worldwide
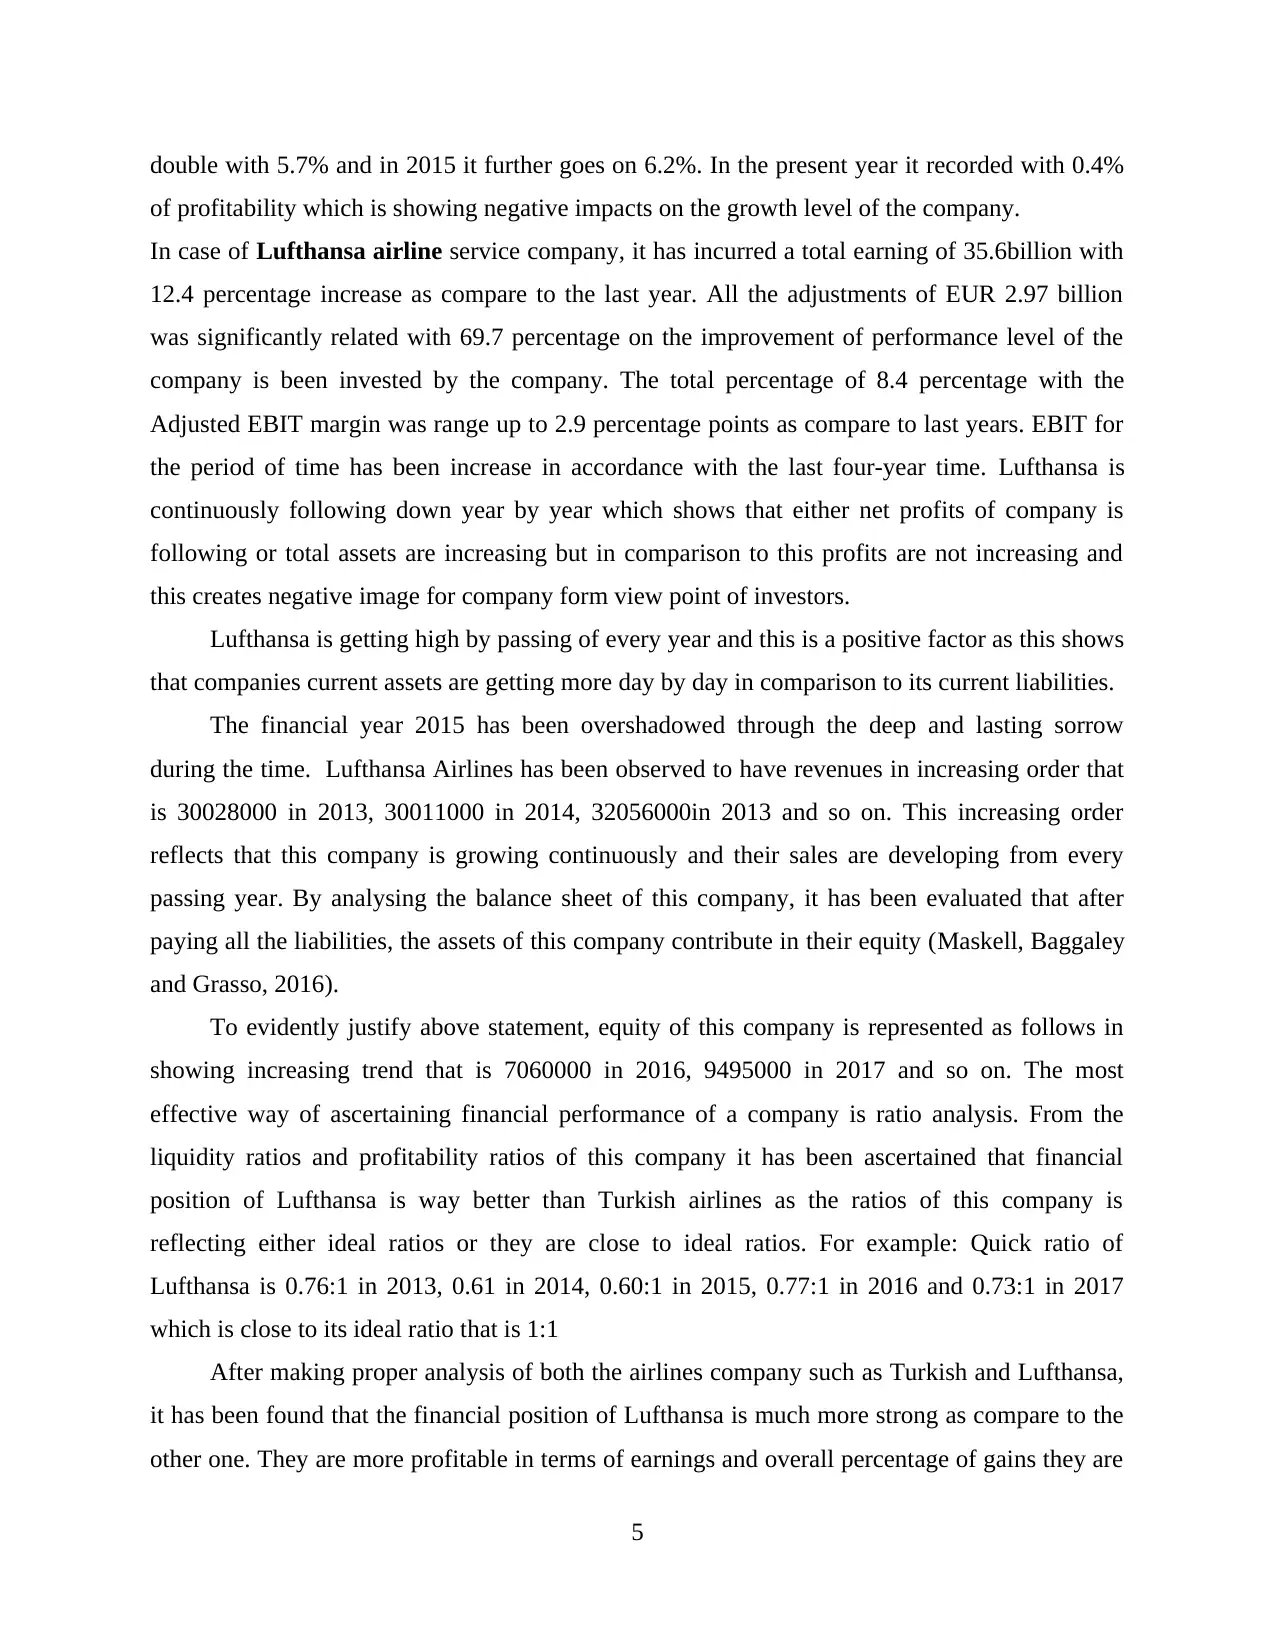
double with 5.7% and in 2015 it further goes on 6.2%. In the present year it recorded with 0.4%
of profitability which is showing negative impacts on the growth level of the company.
In case of Lufthansa airline service company, it has incurred a total earning of 35.6billion with
12.4 percentage increase as compare to the last year. All the adjustments of EUR 2.97 billion
was significantly related with 69.7 percentage on the improvement of performance level of the
company is been invested by the company. The total percentage of 8.4 percentage with the
Adjusted EBIT margin was range up to 2.9 percentage points as compare to last years. EBIT for
the period of time has been increase in accordance with the last four-year time. Lufthansa is
continuously following down year by year which shows that either net profits of company is
following or total assets are increasing but in comparison to this profits are not increasing and
this creates negative image for company form view point of investors.
Lufthansa is getting high by passing of every year and this is a positive factor as this shows
that companies current assets are getting more day by day in comparison to its current liabilities.
The financial year 2015 has been overshadowed through the deep and lasting sorrow
during the time. Lufthansa Airlines has been observed to have revenues in increasing order that
is 30028000 in 2013, 30011000 in 2014, 32056000in 2013 and so on. This increasing order
reflects that this company is growing continuously and their sales are developing from every
passing year. By analysing the balance sheet of this company, it has been evaluated that after
paying all the liabilities, the assets of this company contribute in their equity (Maskell, Baggaley
and Grasso, 2016).
To evidently justify above statement, equity of this company is represented as follows in
showing increasing trend that is 7060000 in 2016, 9495000 in 2017 and so on. The most
effective way of ascertaining financial performance of a company is ratio analysis. From the
liquidity ratios and profitability ratios of this company it has been ascertained that financial
position of Lufthansa is way better than Turkish airlines as the ratios of this company is
reflecting either ideal ratios or they are close to ideal ratios. For example: Quick ratio of
Lufthansa is 0.76:1 in 2013, 0.61 in 2014, 0.60:1 in 2015, 0.77:1 in 2016 and 0.73:1 in 2017
which is close to its ideal ratio that is 1:1
After making proper analysis of both the airlines company such as Turkish and Lufthansa,
it has been found that the financial position of Lufthansa is much more strong as compare to the
other one. They are more profitable in terms of earnings and overall percentage of gains they are
5
Paraphrase This Document
Need a fresh take? Get an instant paraphrase of this document with our AI Paraphraser
generating for the company. The used to serve lot better services in respect to Turkish airlines
which will be effectively helpful in coming to become more competitive company as compare to
other.
(b): Critically analyse the annual cash flow statements of Emirates, over the Five-year period,
2012 to 2016,
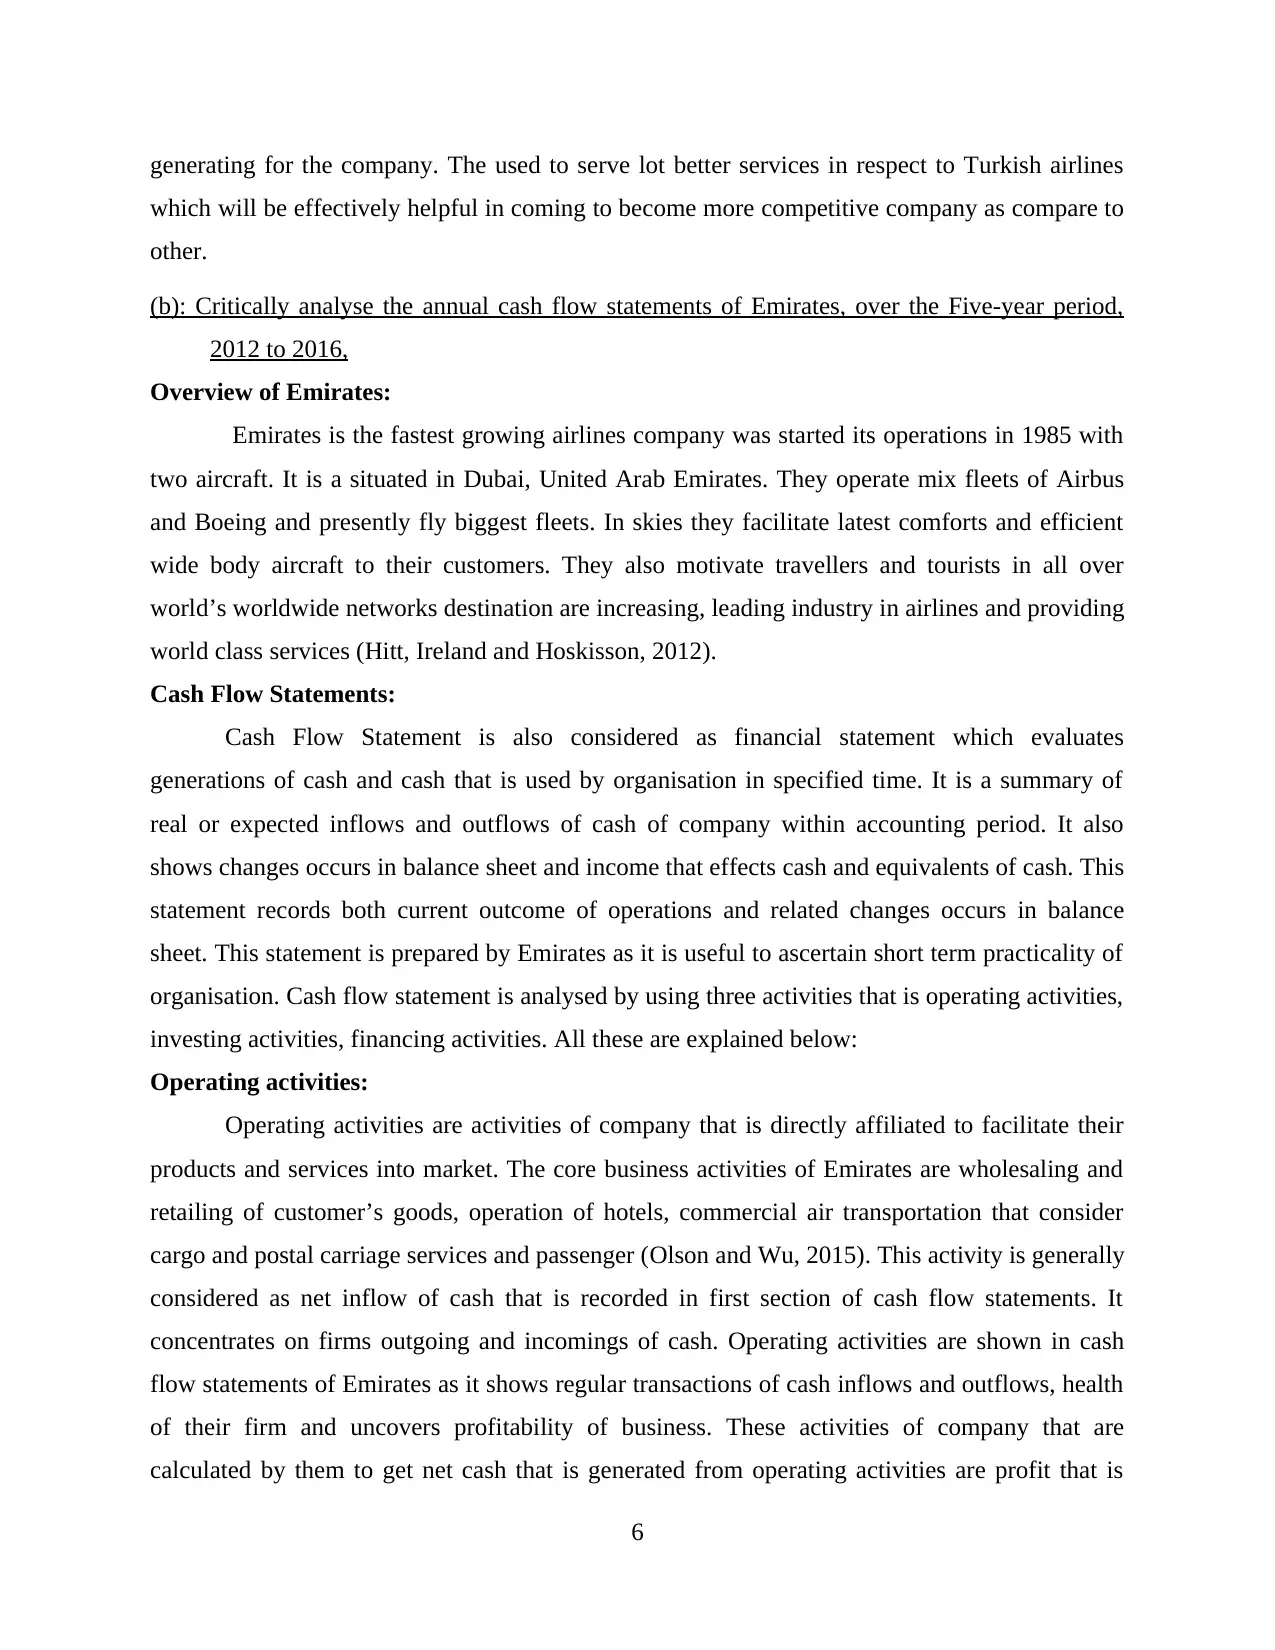
Overview of Emirates:
Emirates is the fastest growing airlines company was started its operations in 1985 with
two aircraft. It is a situated in Dubai, United Arab Emirates. They operate mix fleets of Airbus
and Boeing and presently fly biggest fleets. In skies they facilitate latest comforts and efficient
wide body aircraft to their customers. They also motivate travellers and tourists in all over
world’s worldwide networks destination are increasing, leading industry in airlines and providing
world class services (Hitt, Ireland and Hoskisson, 2012).
Cash Flow Statements:
Cash Flow Statement is also considered as financial statement which evaluates
generations of cash and cash that is used by organisation in specified time. It is a summary of
real or expected inflows and outflows of cash of company within accounting period. It also
shows changes occurs in balance sheet and income that effects cash and equivalents of cash. This
statement records both current outcome of operations and related changes occurs in balance
sheet. This statement is prepared by Emirates as it is useful to ascertain short term practicality of
organisation. Cash flow statement is analysed by using three activities that is operating activities,
investing activities, financing activities. All these are explained below:
Operating activities:
Operating activities are activities of company that is directly affiliated to facilitate their
products and services into market. The core business activities of Emirates are wholesaling and
retailing of customer’s goods, operation of hotels, commercial air transportation that consider
cargo and postal carriage services and passenger (Olson and Wu, 2015). This activity is generally
considered as net inflow of cash that is recorded in first section of cash flow statements. It
concentrates on firms outgoing and incomings of cash. Operating activities are shown in cash
flow statements of Emirates as it shows regular transactions of cash inflows and outflows, health
of their firm and uncovers profitability of business. These activities of company that are
calculated by them to get net cash that is generated from operating activities are profit that is
6
which will be effectively helpful in coming to become more competitive company as compare to
other.
(b): Critically analyse the annual cash flow statements of Emirates, over the Five-year period,
2012 to 2016,
Overview of Emirates:
Emirates is the fastest growing airlines company was started its operations in 1985 with
two aircraft. It is a situated in Dubai, United Arab Emirates. They operate mix fleets of Airbus
and Boeing and presently fly biggest fleets. In skies they facilitate latest comforts and efficient
wide body aircraft to their customers. They also motivate travellers and tourists in all over
world’s worldwide networks destination are increasing, leading industry in airlines and providing
world class services (Hitt, Ireland and Hoskisson, 2012).
Cash Flow Statements:
Cash Flow Statement is also considered as financial statement which evaluates
generations of cash and cash that is used by organisation in specified time. It is a summary of
real or expected inflows and outflows of cash of company within accounting period. It also
shows changes occurs in balance sheet and income that effects cash and equivalents of cash. This
statement records both current outcome of operations and related changes occurs in balance
sheet. This statement is prepared by Emirates as it is useful to ascertain short term practicality of
organisation. Cash flow statement is analysed by using three activities that is operating activities,
investing activities, financing activities. All these are explained below:
Operating activities:
Operating activities are activities of company that is directly affiliated to facilitate their
products and services into market. The core business activities of Emirates are wholesaling and
retailing of customer’s goods, operation of hotels, commercial air transportation that consider
cargo and postal carriage services and passenger (Olson and Wu, 2015). This activity is generally
considered as net inflow of cash that is recorded in first section of cash flow statements. It
concentrates on firms outgoing and incomings of cash. Operating activities are shown in cash
flow statements of Emirates as it shows regular transactions of cash inflows and outflows, health
of their firm and uncovers profitability of business. These activities of company that are
calculated by them to get net cash that is generated from operating activities are profit that is
6
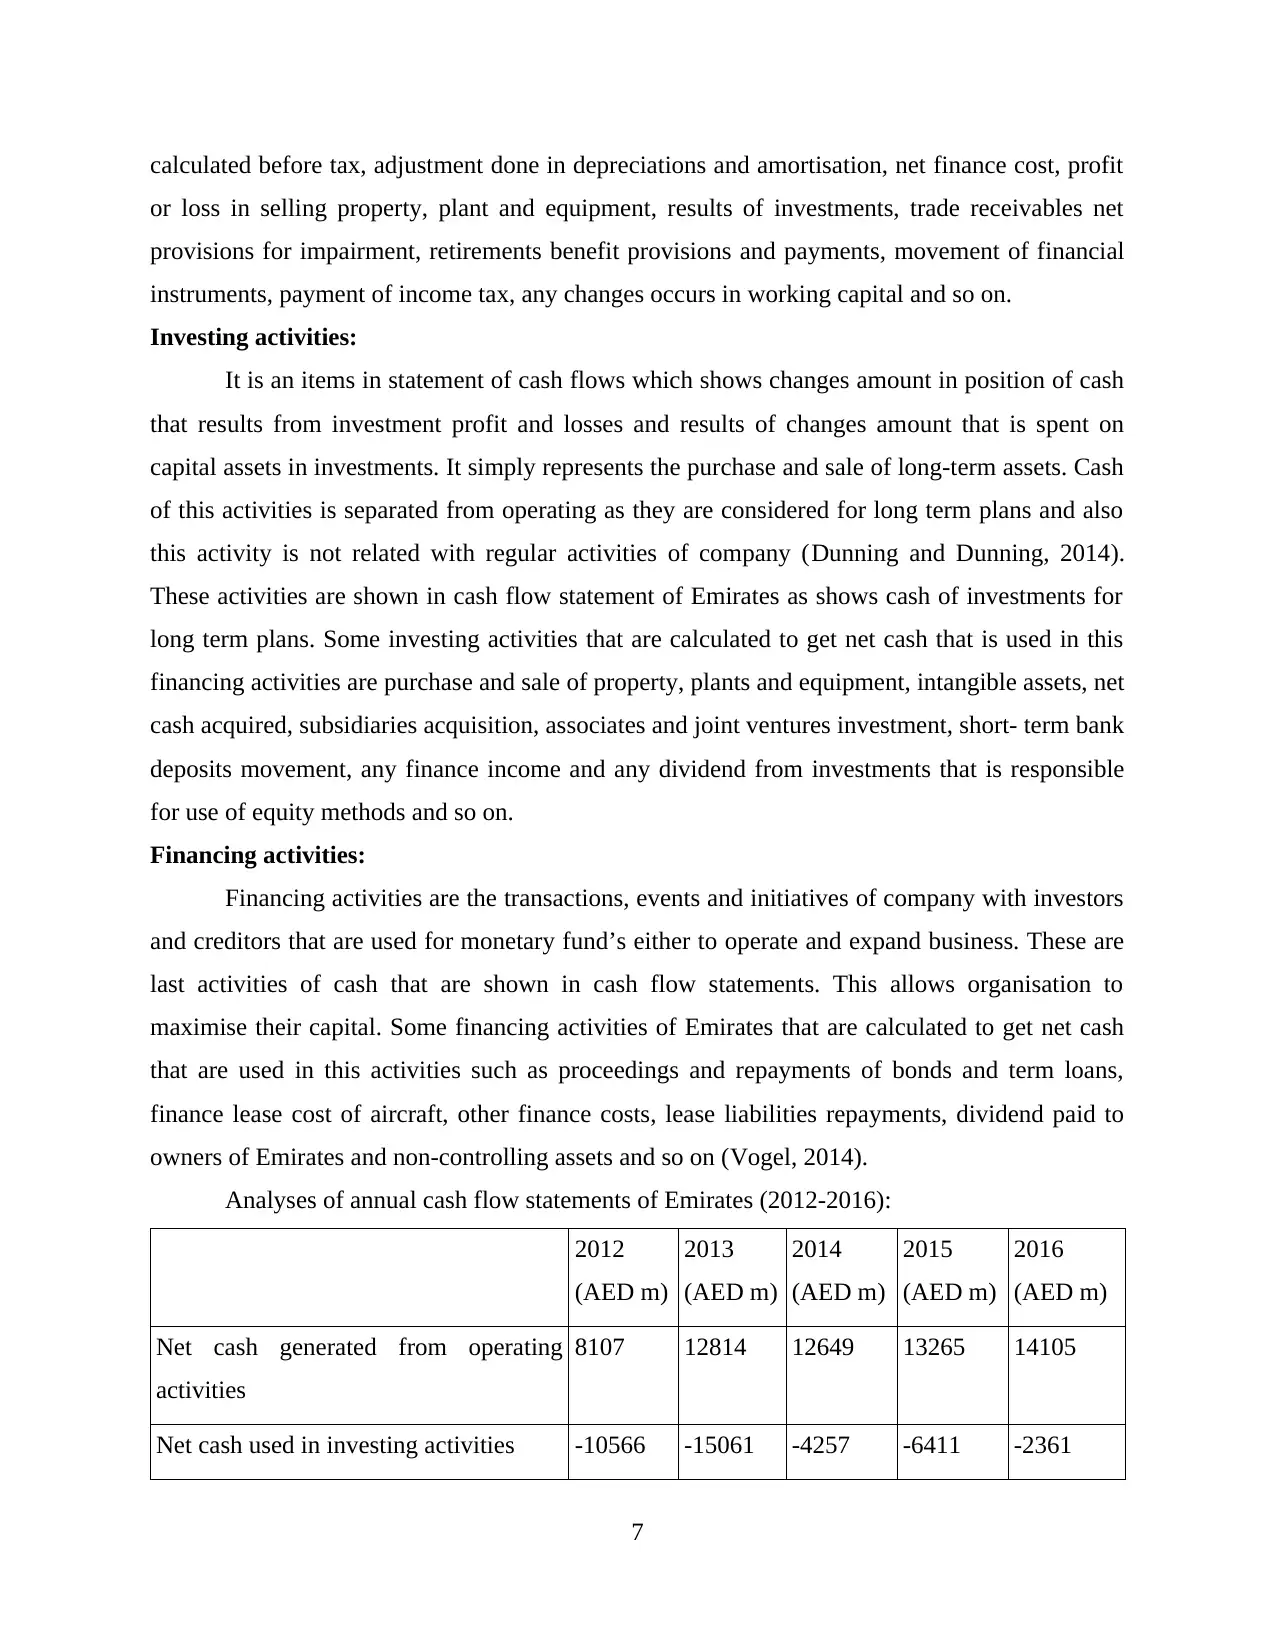
calculated before tax, adjustment done in depreciations and amortisation, net finance cost, profit
or loss in selling property, plant and equipment, results of investments, trade receivables net
provisions for impairment, retirements benefit provisions and payments, movement of financial
instruments, payment of income tax, any changes occurs in working capital and so on.
Investing activities:
It is an items in statement of cash flows which shows changes amount in position of cash
that results from investment profit and losses and results of changes amount that is spent on
capital assets in investments. It simply represents the purchase and sale of long-term assets. Cash
of this activities is separated from operating as they are considered for long term plans and also
this activity is not related with regular activities of company (Dunning and Dunning, 2014).
These activities are shown in cash flow statement of Emirates as shows cash of investments for
long term plans. Some investing activities that are calculated to get net cash that is used in this
financing activities are purchase and sale of property, plants and equipment, intangible assets, net
cash acquired, subsidiaries acquisition, associates and joint ventures investment, short- term bank
deposits movement, any finance income and any dividend from investments that is responsible
for use of equity methods and so on.
Financing activities:
Financing activities are the transactions, events and initiatives of company with investors
and creditors that are used for monetary fund’s either to operate and expand business. These are
last activities of cash that are shown in cash flow statements. This allows organisation to
maximise their capital. Some financing activities of Emirates that are calculated to get net cash
that are used in this activities such as proceedings and repayments of bonds and term loans,
finance lease cost of aircraft, other finance costs, lease liabilities repayments, dividend paid to
owners of Emirates and non-controlling assets and so on (Vogel, 2014).
Analyses of annual cash flow statements of Emirates (2012-2016):
2012
(AED m)
2013
(AED m)
2014
(AED m)
2015
(AED m)
2016
(AED m)
Net cash generated from operating
activities
8107 12814 12649 13265 14105
Net cash used in investing activities -10566 -15061 -4257 -6411 -2361
7
⊘ This is a preview!⊘
Do you want full access?
Subscribe today to unlock all pages.
Trusted by 1+ million students worldwide
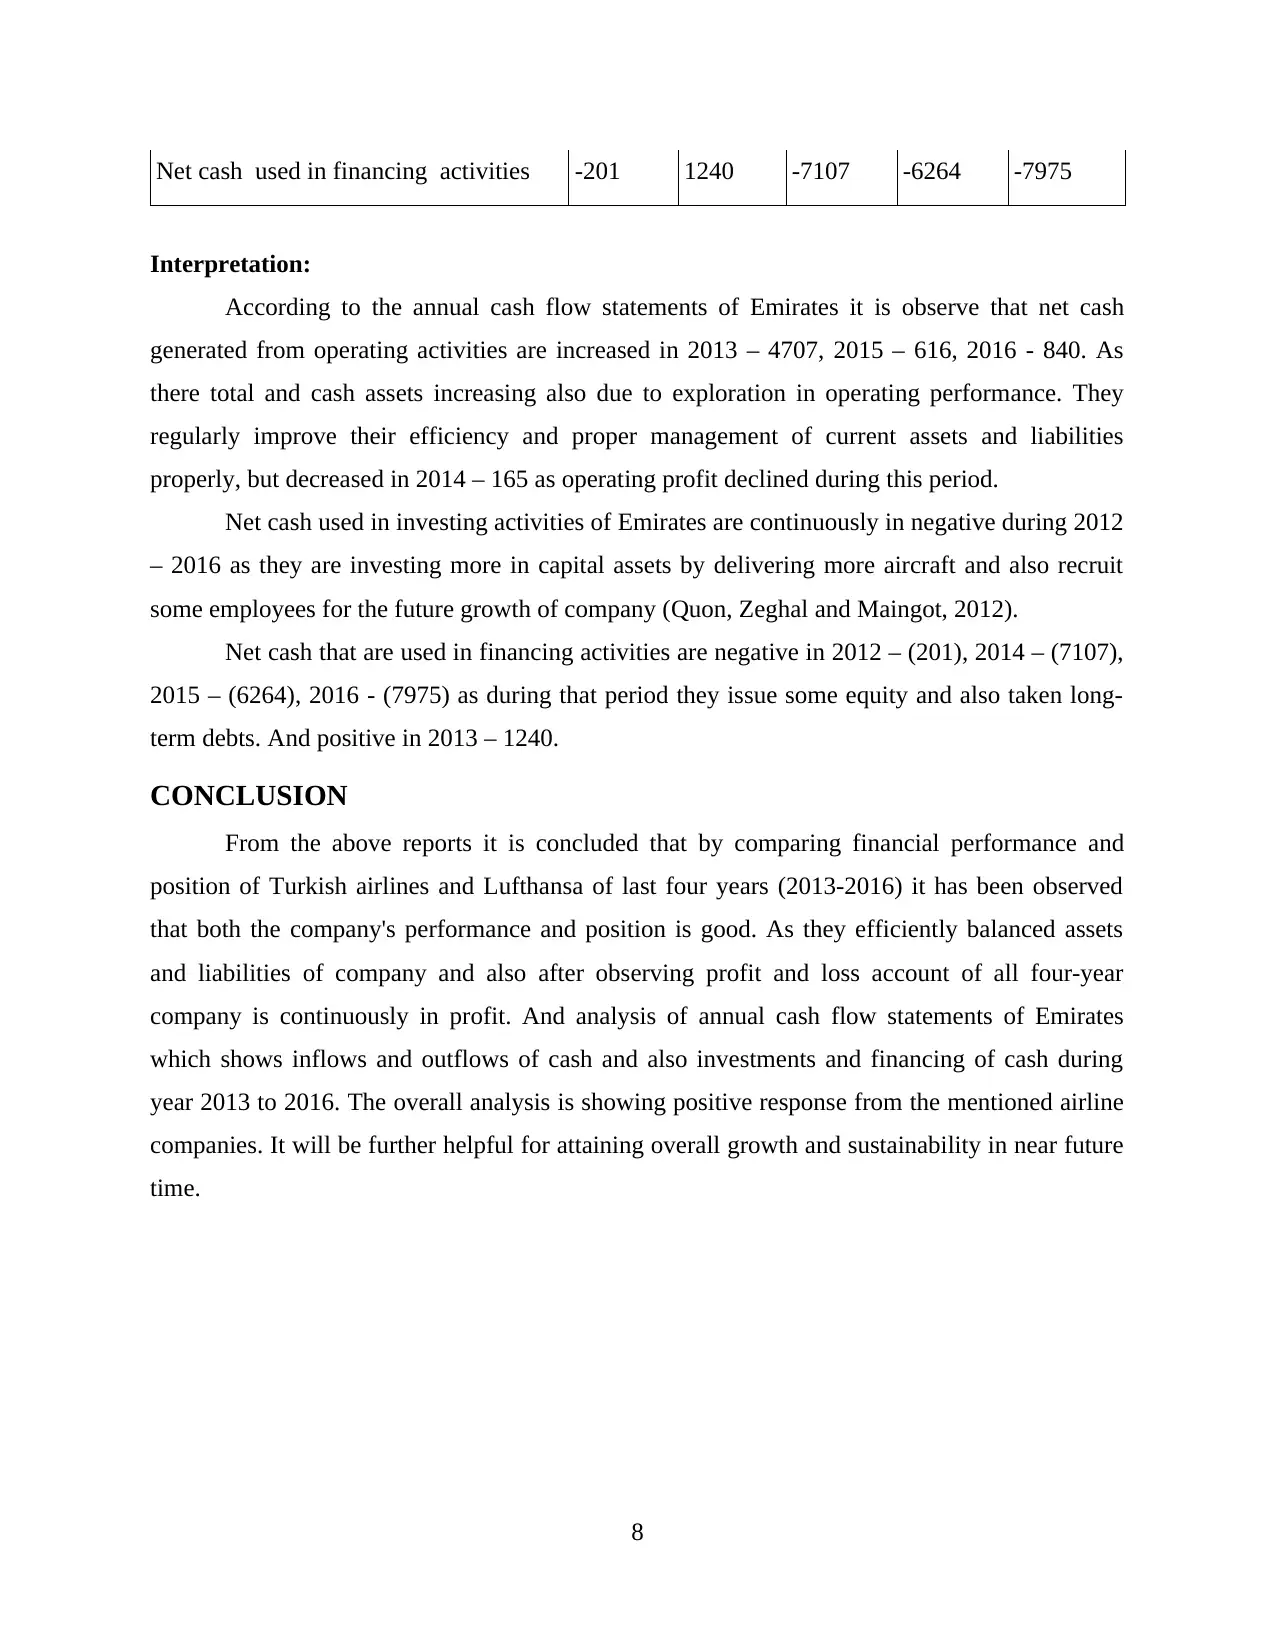
Net cash used in financing activities -201 1240 -7107 -6264 -7975
Interpretation:
According to the annual cash flow statements of Emirates it is observe that net cash
generated from operating activities are increased in 2013 – 4707, 2015 – 616, 2016 - 840. As
there total and cash assets increasing also due to exploration in operating performance. They
regularly improve their efficiency and proper management of current assets and liabilities
properly, but decreased in 2014 – 165 as operating profit declined during this period.
Net cash used in investing activities of Emirates are continuously in negative during 2012
– 2016 as they are investing more in capital assets by delivering more aircraft and also recruit
some employees for the future growth of company (Quon, Zeghal and Maingot, 2012).
Net cash that are used in financing activities are negative in 2012 – (201), 2014 – (7107),
2015 – (6264), 2016 - (7975) as during that period they issue some equity and also taken long-
term debts. And positive in 2013 – 1240.
CONCLUSION
From the above reports it is concluded that by comparing financial performance and
position of Turkish airlines and Lufthansa of last four years (2013-2016) it has been observed
that both the company's performance and position is good. As they efficiently balanced assets
and liabilities of company and also after observing profit and loss account of all four-year
company is continuously in profit. And analysis of annual cash flow statements of Emirates
which shows inflows and outflows of cash and also investments and financing of cash during
year 2013 to 2016. The overall analysis is showing positive response from the mentioned airline
companies. It will be further helpful for attaining overall growth and sustainability in near future
time.
8
Paraphrase This Document
Need a fresh take? Get an instant paraphrase of this document with our AI Paraphraser
REFERENCES
Books and Journals:
Baxter, R. and et. al., 2013. Enterprise risk management program quality: Determinants, value
relevance, and the financial crisis. Contemporary Accounting Research. 30(4). pp.1264-
1295.
Brigham, E. F. and Houston, J. F., 2012. Fundamentals of financial management. Cengage
Learning.
Bromiley, P. and et. al., 2015. Enterprise risk management: Review, critique, and research
directions. Long range planning. 48(4). pp.265-276.
Dunning, J. H. and Dunning, J. H., 2014. Economic analysis and multinational enterprise.
Routledge.
Hitt, M. A., Ireland, R. D. and Hoskisson, R. E., 2012. Strategic management cases:
competitiveness and globalization. Cengage Learning.
Lam, J., 2014. Enterprise risk management: from incentives to controls. John Wiley & Sons.
Maskell, B. H., Baggaley, B. and Grasso, L., 2016. Practical lean accounting: a proven system
for measuring and managing the lean enterprise. Productivity Press.
Olson, D. L. and Wu, D. D., 2015. Enterprise risk management (Vol. 3). World Scientific
Publishing Company.
Quon, T. K., Zeghal, D. and Maingot, M., 2012. Enterprise risk management and firm
performance. Procedia-Social and Behavioral Sciences. 62. pp.263-267.
Vernon, R. and Aharoni, Y., 2014. State-Owned Enterprise in the Western Economies
(Routledge Revivals). Routledge.
Vogel, H. L., 2014. Entertainment industry economics: A guide for financial analysis.
Cambridge University Press.
Online
Emirates annual report. 2016.[Online]. Available through:<
https://www.emirates.com/english/about/annual-reports.aspx>.
Lufthansa annual report. 2016. [Online]. Available through: < https://investor-
relations.lufthansagroup.com/en/finanzberichte/annual-report/2016.html>.
Turkish Airlines annual report. 2016. [Online]. Available through: <
http://investor.turkishairlines.com/en/financial-operational/annual-reports/1/Next
%20Page>.
9
1 out of 11
Related Documents


Your All-in-One AI-Powered Toolkit for Academic Success.
+13062052269
info@desklib.com
Available 24*7 on WhatsApp / Email
![[object Object]](/_next/static/media/star-bottom.7253800d.svg)
Unlock your academic potential
Copyright © 2020–2026 A2Z Services. All Rights Reserved. Developed and managed by ZUCOL.