Comprehensive Financial Performance Analysis: Alumex PLC MBA Report
VerifiedAdded on 2022/01/21
|30
|6618
|191
Report
AI Summary
This report offers a comprehensive analysis of the financial performance of Alumex PLC, a prominent aluminum product manufacturer in Sri Lanka, utilizing its annual reports. The analysis begins with an introduction to the company, emphasizing the importance of annual reports for stakeholders, particularly investors and employees. It then differentiates between financial statements of limited companies and other legal entities, comparing features of financial statements of limited companies with sole proprietorships and partnerships. The report delves into working capital and the working capital cycle to identify and suggest solutions for working capital issues. Furthermore, it examines Alumex PLC's sources of finance over the past three years, including their advantages and disadvantages. Finally, the report includes a capital budgeting analysis, presenting a forecasted cash flow statement and calculating key metrics such as Accounting Rate of Return, Payback Period, Net Present Value, and Internal Rate of Return to assess the viability of a planned project.
Analysis of Financial Performance of
Alumex PLC
MASTER OF BUSINESS ADMINISTRATION
Alumex PLC
MASTER OF BUSINESS ADMINISTRATION
Paraphrase This Document
Need a fresh take? Get an instant paraphrase of this document with our AI Paraphraser

PAGE 9
Executive summary
This comprehensive report has mainly conducted along with the analysis done utilizing the
annual reports of Alumex PLC, which is a leading aluminum product manufacture in Sri
Lanka. Commencing from an introduction given to the recognized organization, then the
importance of using annual reports is discussed in investors’ and employees’ perspectives.
From that analysis it is evident that the company is favorable to invest. Third chapter briefs
the differences between the financial statements of limited companies and other legal entities.
Comparison done in this section comparing the features of financial statements of limited
companies with sole proprietorships and partnerships. The report flows towards most
significant analysis done in the fourth chapter by analyzing the working capital and the
working capital cycle in order to identify the working capital issues faces by the organization.
Suggestions are given in overcoming such issues by handling relevant components. Fifth
chapter is all about sources of finances which have been used by Alumex PLC in the last
three years and further to that advantages and disadvantages of those sources have been
discussed. Before concluding the report, it contains details regarding capital budgeting.
Forecasted cash flow statement has been prepared and along with the amounts forecasted
Accounting rate of return, Payback period, and Net present Value and Internal rate of return
has calculated to analyze the proceedings of the project that had planned.
PAGE 9
⊘ This is a preview!⊘
Do you want full access?
Subscribe today to unlock all pages.
Trusted by 1+ million students worldwide
Table of Content
Acknowledgement......................................................................................................................i
Executive summary....................................................................................................................ii
Table of Content.......................................................................................................................iii
List of figures.............................................................................................................................v
List of Tables............................................................................................................................vi
1. Introduction........................................................................................................................1
2. Importance of annual reports to the stakeholders..............................................................2
2.1 Investors’ Perspective..................................................................................................2
2.1.1 Profitability..........................................................................................................2
2.1.2 Company history..................................................................................................2
2.1.3 Type of the company............................................................................................3
2.1.4 Liquidity...............................................................................................................3
2.2 Employees’ perspective...............................................................................................4
2.2.1 Reputation............................................................................................................4
2.2.2 Career growth.......................................................................................................4
2.2.3 Salaries and other benefits...................................................................................4
2.2.4 Training and development...................................................................................4
3. Differences between financial statements of organizations...............................................5
3.1 Limited liability company Vs Sole proprietorship......................................................5
3.2 Limited liability company Vs Partnership...................................................................6
4. Analysis of working capital and working capital cycle.....................................................8
4.1 Working capital (WC) analysis...................................................................................8
4.2 Working capital cycle (WCC) analysis.......................................................................9
4.3 How Alumex PLC can effectively manage the working capital cycle......................11
5. Analysis of sources of finance.........................................................................................13
5.1 Equity........................................................................................................................13
5.2 Liabilities...................................................................................................................13
5.3 Assets.........................................................................................................................15
6. Investment Appraisal.......................................................................................................16
6.1 Projected Cash Flow Statement.................................................................................16
6.1.2 Accounting Rate of Return........................................................................................17
6.1.3 Payback Period..........................................................................................................18
6.1.4 Net Present Value......................................................................................................18
PAGE 9
Paraphrase This Document
Need a fresh take? Get an instant paraphrase of this document with our AI Paraphraser
6.1.3 internal Rate of Return..............................................................................................19
7. Conclusion.......................................................................................................................20
References................................................................................................................................21
Appendix..................................................................................................................................22
List of Tables
Table 1: Profitability ratio analysis of Alumex PLC.................................................................2
Table 2: Financial ratio analysis of Alumex PLC......................................................................3
Table 4: Income statement differences - PLC vs Sole proprietorship.......................................5
Table 5: Differences of statement of financial position - PLC vs Sole proprietorship..............6
Table 6: Differences of income statement - PLC vs Partnership...............................................7
Table 7: Differences of statement of financial position - PLC vs Partnership..........................7
Table 8: Working capital movement of Alumex PLC.............................................................11
Table 9: WCC Analysis of Alumex PLC.................................................................................11
Table 10: Equity of Alumex PLC as source of finance...........................................................13
Table 11: Advantages and disadvantagess of equity...............................................................13
Table 12: Liabilities as sources of finance...............................................................................14
Table 13: Values of Accounting Rate of Return, Payback Period, Net Present Value, Internal Rate of
Return
..................................................................................................................................................14
PAGE 9
1. Introduction
Alumex PLC can be recognized as a leading aluminum products manufacturer in Sri Lanka
which was establishment in 1986 as a South Korean-Sri Lankan joint venture. Currently the
company is owned by the Hayleys group and the market has expanded into the international
markets including Europe, USA, Asia and Africa. The company undertakes a comprehensive
offering of architectural, residential and industrial products made available through the
national and retail distribution system, while ensuring the international standards of their
products (Alumex Group.com, 2021). As leading specialists in the manufacture of a
comprehensive range of highly specialized aluminum extrusions, products, and services. To
date it employs approximately 953 employees in all of its operations. Alumex PLC is a
limited Liability company, incorporated in Sri Lanka in 2007.
Alumex is currently conducting their operations based in Sri Lanka, but aggressively market
their product across the globe. They highlight their innovation capacities and product
variations as their key strengths which have led them to acquire a competitive market share.
The company currently holds a market capitalization of LKR 5.69 Bn with 299.30 Mn shares
outstanding (Financial Times, 2020).
The fundamental analysis has been done to compare and contrast the financial performance
of Alumex PLC over the course of last three years. Various theories and formulas used to
analyze the data such as financial ratios, working capital and capital budgeting to get the
desired outcome.
2. Usefulness of Annual report to the stakeholder
“A stakeholder is a party that has an interest in a company and can either affect or be
affected by the business. The primary stakeholders in a typical corporation are its investors,
employees, customers, and suppliers” (Fernando, 2021). With the increasing attention
on corporate social responsibility, the concept has been extended to include communities,
governments, and trade associations as well. An entity's stakeholders can be both internal and
external to the organization.
PAGE 9
⊘ This is a preview!⊘
Do you want full access?
Subscribe today to unlock all pages.
Trusted by 1+ million students worldwide
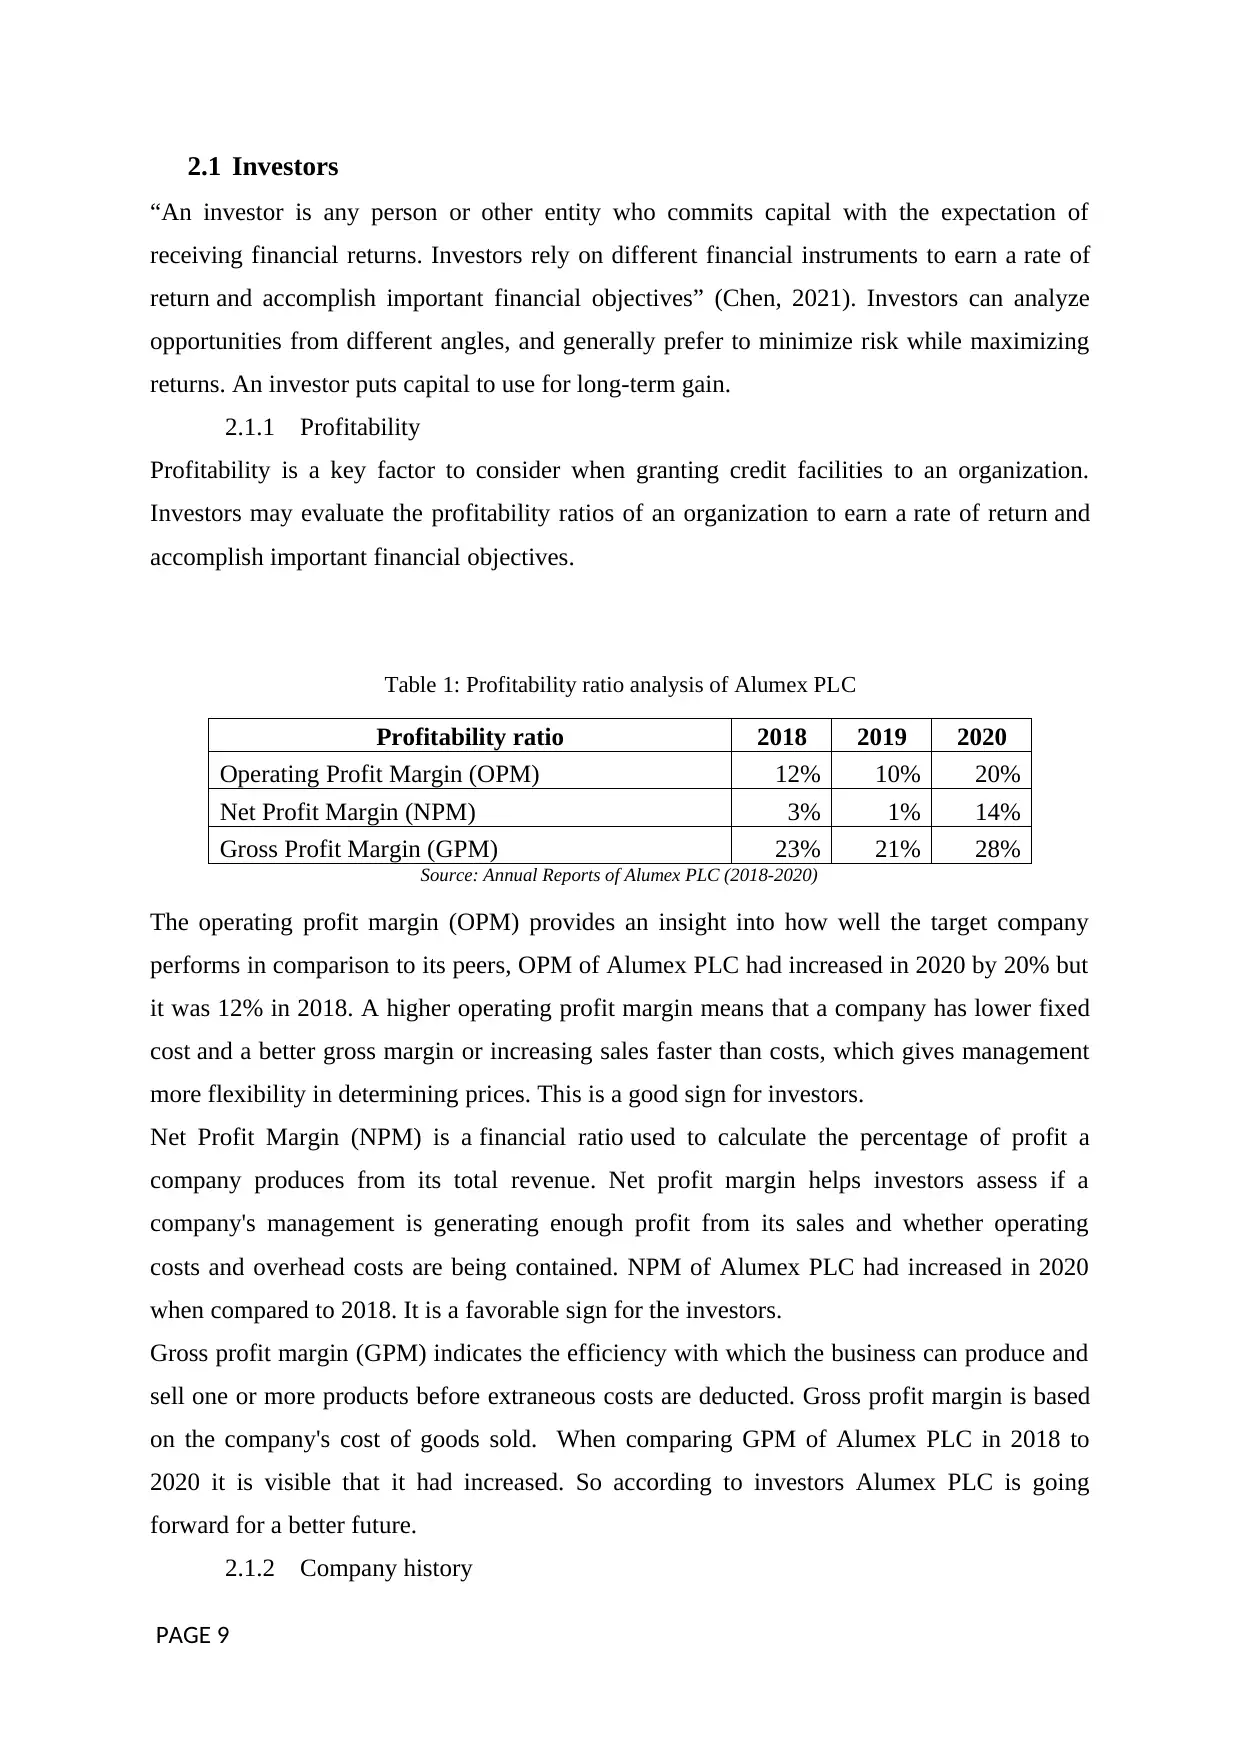
2.1 Investors
“An investor is any person or other entity who commits capital with the expectation of
receiving financial returns. Investors rely on different financial instruments to earn a rate of
return and accomplish important financial objectives” (Chen, 2021). Investors can analyze
opportunities from different angles, and generally prefer to minimize risk while maximizing
returns. An investor puts capital to use for long-term gain.
2.1.1 Profitability
Profitability is a key factor to consider when granting credit facilities to an organization.
Investors may evaluate the profitability ratios of an organization to earn a rate of return and
accomplish important financial objectives.
Table 1: Profitability ratio analysis of Alumex PLC
Profitability ratio 2018 2019 2020
Operating Profit Margin (OPM) 12% 10% 20%
Net Profit Margin (NPM) 3% 1% 14%
Gross Profit Margin (GPM) 23% 21% 28%
Source: Annual Reports of Alumex PLC (2018-2020)
The operating profit margin (OPM) provides an insight into how well the target company
performs in comparison to its peers, OPM of Alumex PLC had increased in 2020 by 20% but
it was 12% in 2018. A higher operating profit margin means that a company has lower fixed
cost and a better gross margin or increasing sales faster than costs, which gives management
more flexibility in determining prices. This is a good sign for investors.
Net Profit Margin (NPM) is a financial ratio used to calculate the percentage of profit a
company produces from its total revenue. Net profit margin helps investors assess if a
company's management is generating enough profit from its sales and whether operating
costs and overhead costs are being contained. NPM of Alumex PLC had increased in 2020
when compared to 2018. It is a favorable sign for the investors.
Gross profit margin (GPM) indicates the efficiency with which the business can produce and
sell one or more products before extraneous costs are deducted. Gross profit margin is based
on the company's cost of goods sold. When comparing GPM of Alumex PLC in 2018 to
2020 it is visible that it had increased. So according to investors Alumex PLC is going
forward for a better future.
2.1.2 Company history
PAGE 9
Paraphrase This Document
Need a fresh take? Get an instant paraphrase of this document with our AI Paraphraser
Considering a company’s history, assists the investors to get an assurance regarding its
establishment and reputation when making decisions in financing the firm. Being a firm in
the industry for over 30 years,
2.1.3 Type of the company
Being the local market leader of aluminum products manufacturing, company has a huge
reputation in both domestic and global markets. Since Alumex’s export market expanded to
most of the European and Asian countries, investors may assume that the demand for the
products is well established.
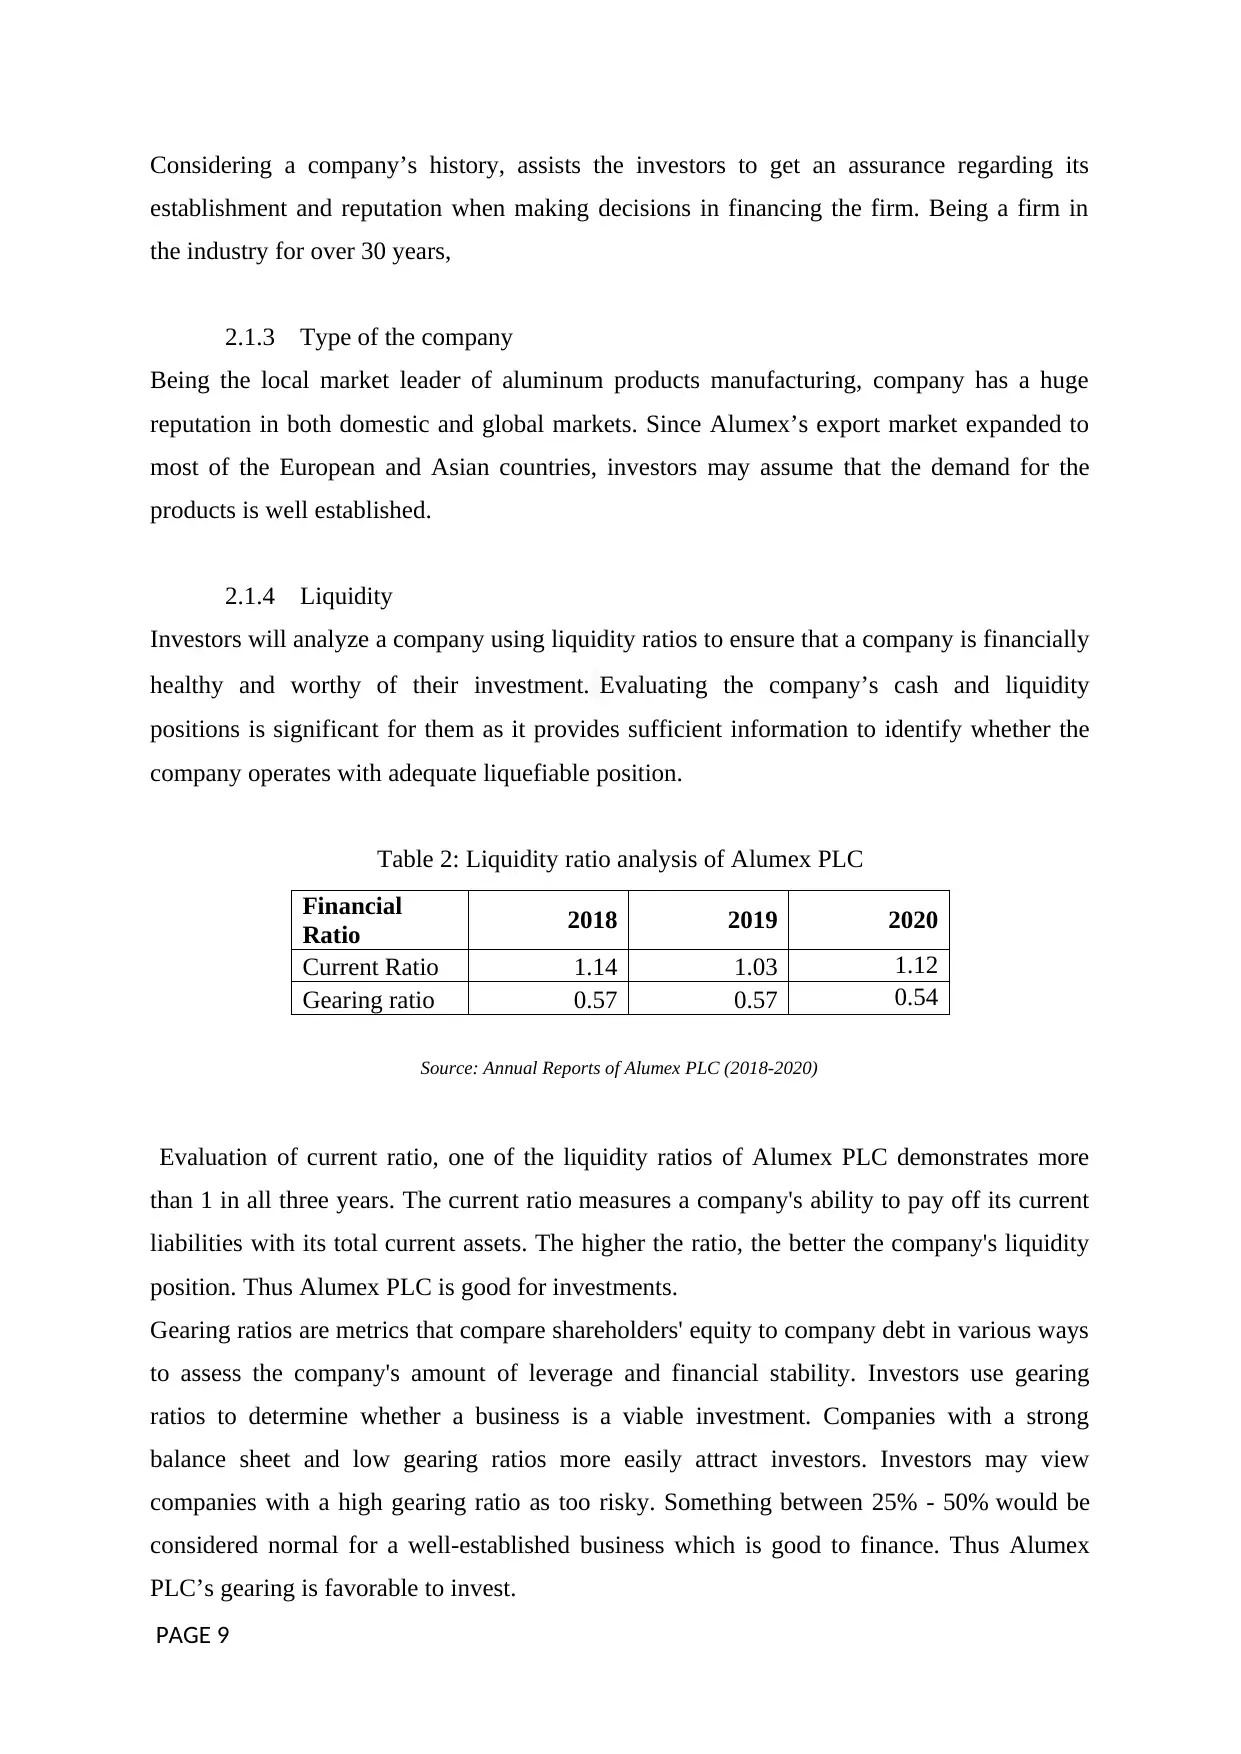
2.1.4 Liquidity
Investors will analyze a company using liquidity ratios to ensure that a company is financially
healthy and worthy of their investment. Evaluating the company’s cash and liquidity
positions is significant for them as it provides sufficient information to identify whether the
company operates with adequate liquefiable position.
Table 2: Liquidity ratio analysis of Alumex PLC
Source: Annual Reports of Alumex PLC (2018-2020)
Evaluation of current ratio, one of the liquidity ratios of Alumex PLC demonstrates more
than 1 in all three years. The current ratio measures a company's ability to pay off its current
liabilities with its total current assets. The higher the ratio, the better the company's liquidity
position. Thus Alumex PLC is good for investments.
Gearing ratios are metrics that compare shareholders' equity to company debt in various ways
to assess the company's amount of leverage and financial stability. Investors use gearing
ratios to determine whether a business is a viable investment. Companies with a strong
balance sheet and low gearing ratios more easily attract investors. Investors may view
companies with a high gearing ratio as too risky. Something between 25% - 50% would be
considered normal for a well-established business which is good to finance. Thus Alumex
PLC’s gearing is favorable to invest.
PAGE 9
Financial
Ratio 2018 2019 2020
Current Ratio 1.14 1.03 1.12
Gearing ratio 0.57 0.57 0.54
establishment and reputation when making decisions in financing the firm. Being a firm in
the industry for over 30 years,
2.1.3 Type of the company
Being the local market leader of aluminum products manufacturing, company has a huge
reputation in both domestic and global markets. Since Alumex’s export market expanded to
most of the European and Asian countries, investors may assume that the demand for the
products is well established.
2.1.4 Liquidity
Investors will analyze a company using liquidity ratios to ensure that a company is financially
healthy and worthy of their investment. Evaluating the company’s cash and liquidity
positions is significant for them as it provides sufficient information to identify whether the
company operates with adequate liquefiable position.
Table 2: Liquidity ratio analysis of Alumex PLC
Source: Annual Reports of Alumex PLC (2018-2020)
Evaluation of current ratio, one of the liquidity ratios of Alumex PLC demonstrates more
than 1 in all three years. The current ratio measures a company's ability to pay off its current
liabilities with its total current assets. The higher the ratio, the better the company's liquidity
position. Thus Alumex PLC is good for investments.
Gearing ratios are metrics that compare shareholders' equity to company debt in various ways
to assess the company's amount of leverage and financial stability. Investors use gearing
ratios to determine whether a business is a viable investment. Companies with a strong
balance sheet and low gearing ratios more easily attract investors. Investors may view
companies with a high gearing ratio as too risky. Something between 25% - 50% would be
considered normal for a well-established business which is good to finance. Thus Alumex
PLC’s gearing is favorable to invest.
PAGE 9
Financial
Ratio 2018 2019 2020
Current Ratio 1.14 1.03 1.12
Gearing ratio 0.57 0.57 0.54
2.2 Employees
According to the oxford dictionary (2021), employee is a person employed for wages or
salary, especially at non-executive level. Every employee is expecting a secured employment
where they can get groomed, motivated and developed in their career. Employees also are
often shareholders. So, like other shareholders, these employees can use the annual report to
help gauge their investment in the company. Accordingly, they’ll consider some factors when
choosing their employer.
2.2.1 Reputation
Being the market leader, a well-built reputation is available for Alumex with a considerable
market share over 50%. It is a fully-integrated aluminum extrusions manufacturer since the
1986. Further, Alumex is the first Company in the Sri Lankan and the South Asian region to
be accredited with both these international certifications. Company is leading specialists in
the manufacture of a comprehensive range of highly specialized aluminum extrusions,
products, and services.
2.2.2 Career growth
According to the annual reports, “HR policies and strategies including recruitment, wages/
salaries, benefits, promotions and increments are solely based on merit.” Alumex follows the
performance evaluation process when considering promotion opportunities. Since, the firm
involve in manufacturing products which has more industrial value, attention is given to
acquire more skilled employees and paths are created to get their skills further developed
inside the organization by attending to relevant training programs. ‘Balance score card
method’ is used to evaluate the performance of executive and clerical supervisory grade
employees.
2.2.3 Salaries and other benefits
As stated in the 2020-2021 annual report, company extend comprehensive financial and non-
financial welfare benefits to all permanent employees. In monetized terms, we spent
Rs. 841 million to provide these benefits along with Rs. 525 million as salaries and
wages. A cost of living allowance, production incentive allowance, attendance allowances,
shift allowance, shift productivity bonuses, etc included for nonexecutive employees and the
company has recently introduced a production incentive mechanism as well.
PAGE 9
⊘ This is a preview!⊘
Do you want full access?
Subscribe today to unlock all pages.
Trusted by 1+ million students worldwide
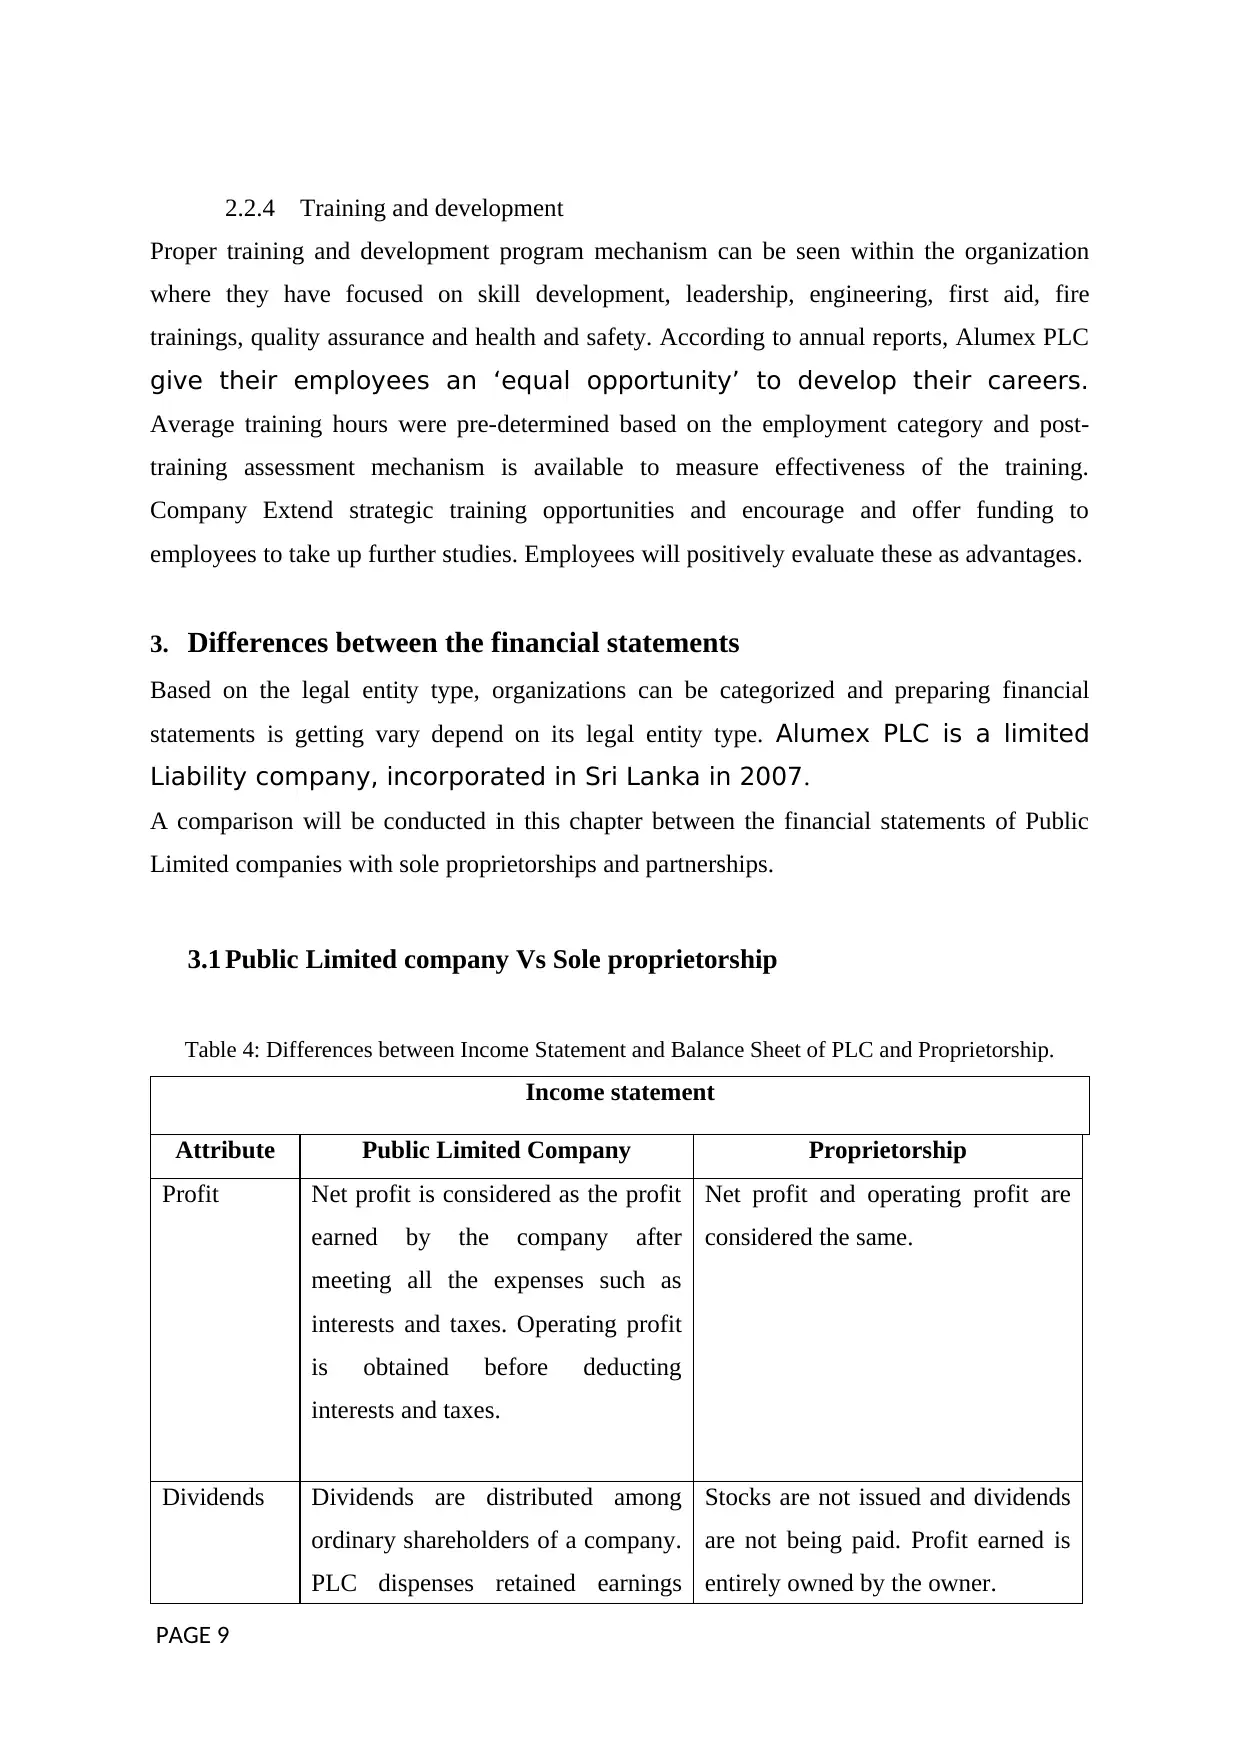
2.2.4 Training and development
Proper training and development program mechanism can be seen within the organization
where they have focused on skill development, leadership, engineering, first aid, fire
trainings, quality assurance and health and safety. According to annual reports, Alumex PLC
give their employees an ‘equal opportunity’ to develop their careers.
Average training hours were pre-determined based on the employment category and post-
training assessment mechanism is available to measure effectiveness of the training.
Company Extend strategic training opportunities and encourage and offer funding to
employees to take up further studies. Employees will positively evaluate these as advantages.
3. Differences between the financial statements
Based on the legal entity type, organizations can be categorized and preparing financial
statements is getting vary depend on its legal entity type. Alumex PLC is a limited
Liability company, incorporated in Sri Lanka in 2007.
A comparison will be conducted in this chapter between the financial statements of Public
Limited companies with sole proprietorships and partnerships.
3.1 Public Limited company Vs Sole proprietorship
Table 4: Differences between Income Statement and Balance Sheet of PLC and Proprietorship.
Income statement
Attribute Public Limited Company Proprietorship
Profit Net profit is considered as the profit
earned by the company after
meeting all the expenses such as
interests and taxes. Operating profit
is obtained before deducting
interests and taxes.
Net profit and operating profit are
considered the same.
Dividends Dividends are distributed among
ordinary shareholders of a company.
PLC dispenses retained earnings
Stocks are not issued and dividends
are not being paid. Profit earned is
entirely owned by the owner.
PAGE 9
Paraphrase This Document
Need a fresh take? Get an instant paraphrase of this document with our AI Paraphraser
through an announcement of a per-
share payout after the company has
paid income taxes.
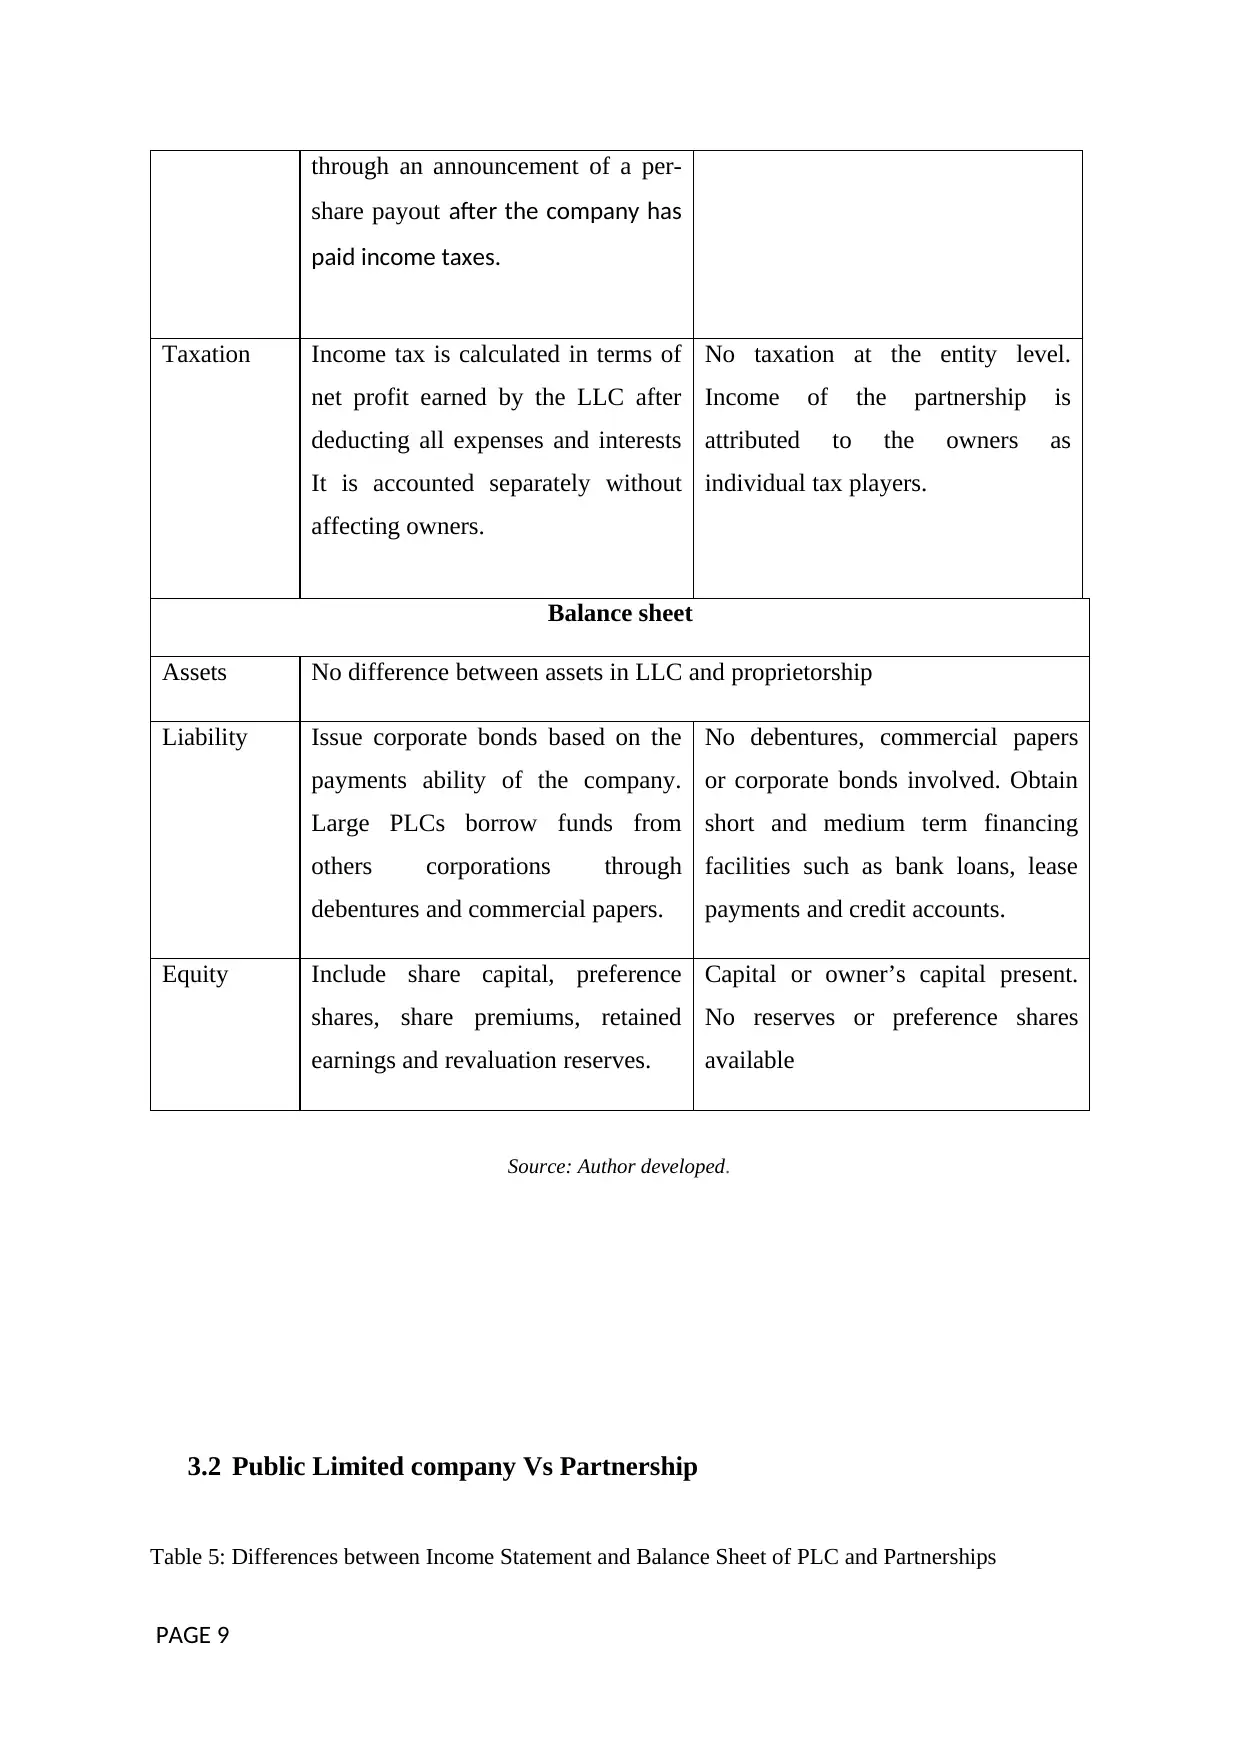
Taxation Income tax is calculated in terms of
net profit earned by the LLC after
deducting all expenses and interests
It is accounted separately without
affecting owners.
No taxation at the entity level.
Income of the partnership is
attributed to the owners as
individual tax players.
Balance sheet
Assets No difference between assets in LLC and proprietorship
Liability Issue corporate bonds based on the
payments ability of the company.
Large PLCs borrow funds from
others corporations through
debentures and commercial papers.
No debentures, commercial papers
or corporate bonds involved. Obtain
short and medium term financing
facilities such as bank loans, lease
payments and credit accounts.
Equity Include share capital, preference
shares, share premiums, retained
earnings and revaluation reserves.
Capital or owner’s capital present.
No reserves or preference shares
available
Source: Author developed.
3.2 Public Limited company Vs Partnership
Table 5: Differences between Income Statement and Balance Sheet of PLC and Partnerships
PAGE 9
share payout after the company has
paid income taxes.
Taxation Income tax is calculated in terms of
net profit earned by the LLC after
deducting all expenses and interests
It is accounted separately without
affecting owners.
No taxation at the entity level.
Income of the partnership is
attributed to the owners as
individual tax players.
Balance sheet
Assets No difference between assets in LLC and proprietorship
Liability Issue corporate bonds based on the
payments ability of the company.
Large PLCs borrow funds from
others corporations through
debentures and commercial papers.
No debentures, commercial papers
or corporate bonds involved. Obtain
short and medium term financing
facilities such as bank loans, lease
payments and credit accounts.
Equity Include share capital, preference
shares, share premiums, retained
earnings and revaluation reserves.
Capital or owner’s capital present.
No reserves or preference shares
available
Source: Author developed.
3.2 Public Limited company Vs Partnership
Table 5: Differences between Income Statement and Balance Sheet of PLC and Partnerships
PAGE 9
Income statement
Attribute Public Limited Company (PLC) Partnership
Profit
Distribution
Board of Directors (BOD) are
employees and hold salaried
positions. Profits are distributed to
shareholders as dividends on a
pre-agreed basis by the BOD.
Profits/losses are distributed among
the partners according to the
provisions of the partnership deed.
This is based on apportionment
concept.
Retained
Earnings
Retained earnings available for
future use
No retained earnings as all profits are
shared among partners
Taxation Pays its own entity level taxes on
net income. Profit is obtained only
after deducting taxes. Therefore
taxation does not affect owners.
Individual partners pay tax based on
their share of ownership in the
partnership. Therefore taxation
directly affects partners
Dividends Ordinary shareholders receive
dividends based on a pre-agreed
base decided by the BOD
No dividends involved.
Balance sheet
Assets No difference between assets in PLC and partnership
Liability Issue corporate bonds based on
the payments ability of the
company. Large PLCs borrow
funds from others corporations
through debentures and
commercial papers
No debentures, commercial papers or
corporate bonds involved. Obtain
short and medium term financing
facilities such as bank loans, lease
payments and credit accounts.
Equity Include share capital, preference
shares, share premiums, retained
earnings and revaluation reserves.
Include partner’s accumulated share
of the profit. No reserves or
preference shares available
PAGE 9
⊘ This is a preview!⊘
Do you want full access?
Subscribe today to unlock all pages.
Trusted by 1+ million students worldwide
1 out of 30
Related Documents


Your All-in-One AI-Powered Toolkit for Academic Success.
+13062052269
info@desklib.com
Available 24*7 on WhatsApp / Email
![[object Object]](/_next/static/media/star-bottom.7253800d.svg)
Unlock your academic potential
Copyright © 2020–2026 A2Z Services. All Rights Reserved. Developed and managed by ZUCOL.