Financial Performance Analysis: Variance Analysis and Budgeting
VerifiedAdded on 2022/12/28
|13
|2787
|36
Homework Assignment
AI Summary
This assignment analyzes financial performance, covering various aspects of costing, variance analysis, and budgeting. The first question delves into activity-based costing (ABC) versus absorption costing, including calculations of overhead allocation and profit analysis for different products (lipstick, lip balm, and lip gloss). It also discusses the role of sensitivity analysis in managing uncertainties. The second question focuses on variance analysis, calculating material usage, mix, and yield variances. It also critiques the current system of calculating and reporting variances for assessing production manager performance. The final question explores zero-based budgeting (ZBB) and its role in planning and coordination, contrasting it with incremental budgeting.

Financial performance (online exam)
Paraphrase This Document
Need a fresh take? Get an instant paraphrase of this document with our AI Paraphraser

Contents
Question 1........................................................................................................................................3
Question 2........................................................................................................................................6
Question 3........................................................................................................................................8
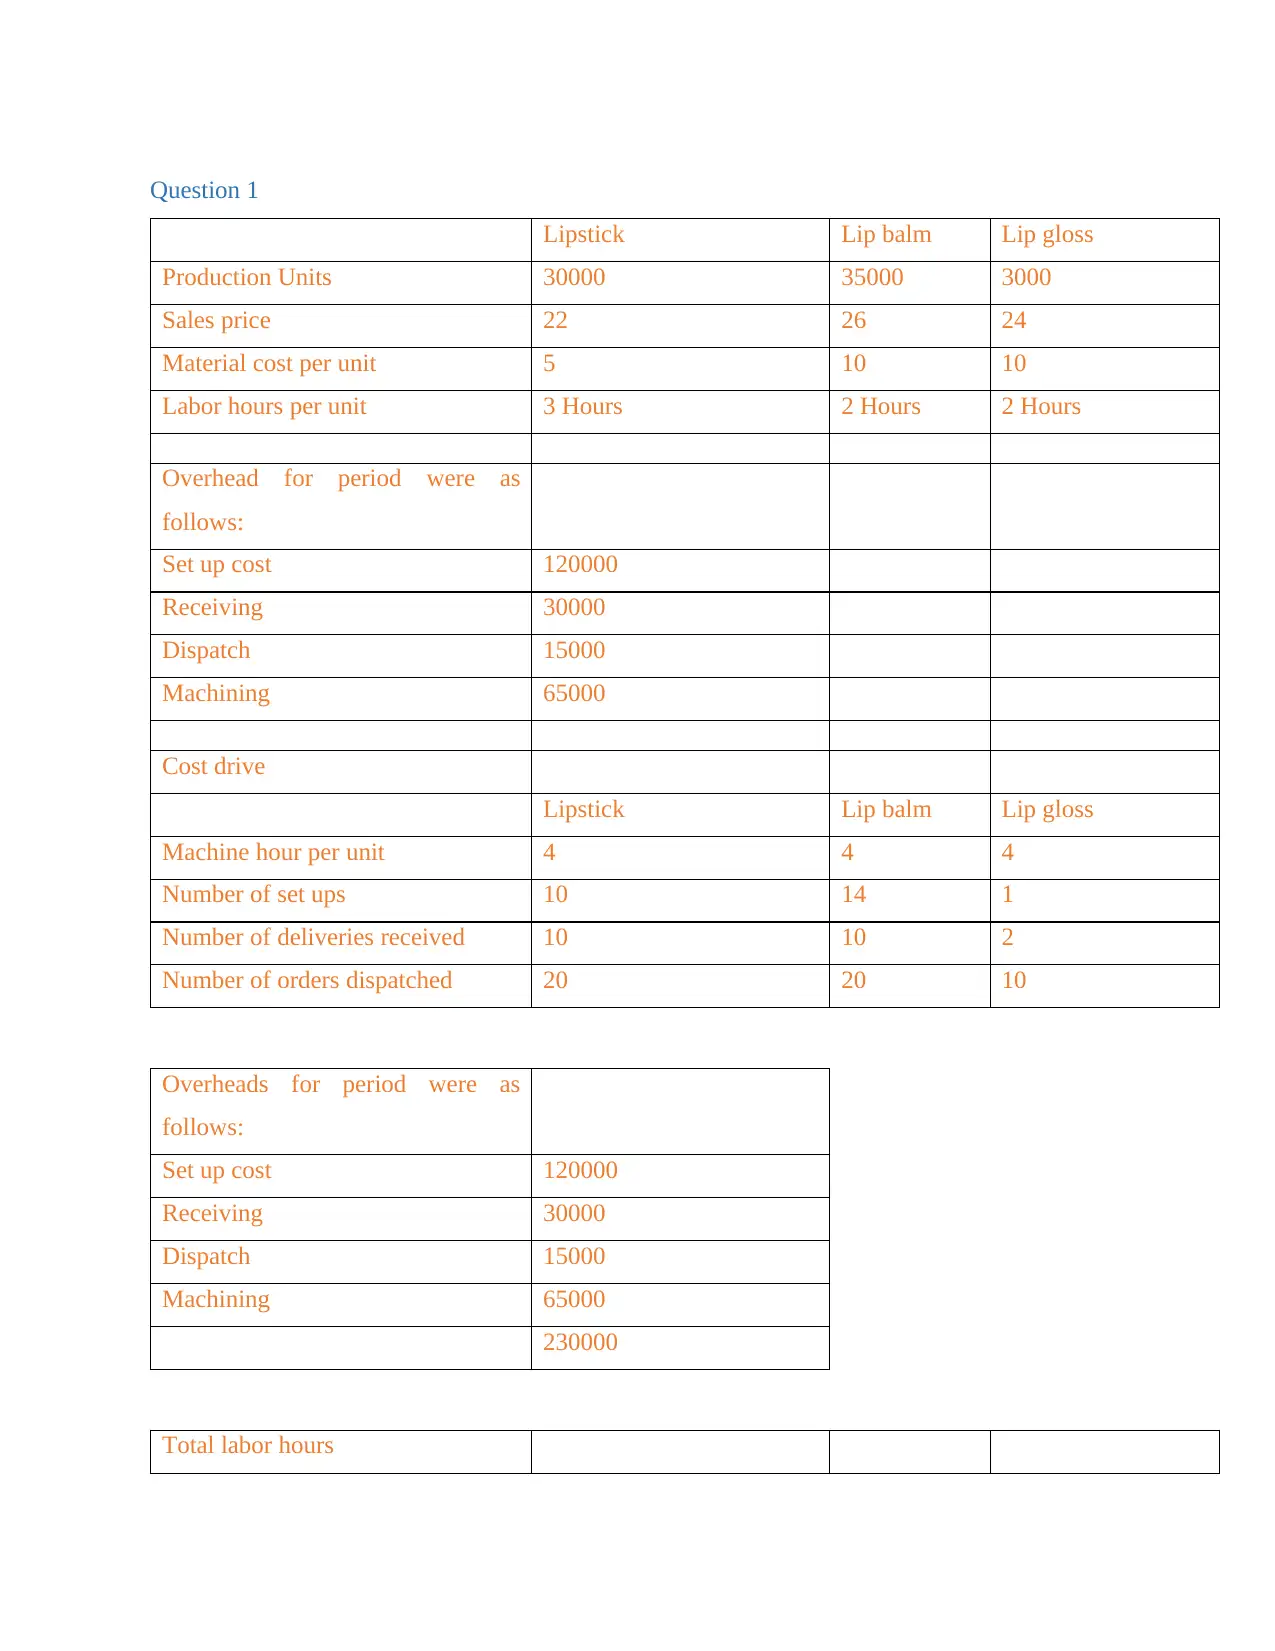
Question 1
Lipstick Lip balm Lip gloss
Production Units 30000 35000 3000
Sales price 22 26 24
Material cost per unit 5 10 10
Labor hours per unit 3 Hours 2 Hours 2 Hours
Overhead for period were as
follows:
Set up cost 120000
Receiving 30000
Dispatch 15000
Machining 65000
Cost drive
Lipstick Lip balm Lip gloss
Machine hour per unit 4 4 4
Number of set ups 10 14 1
Number of deliveries received 10 10 2
Number of orders dispatched 20 20 10
Overheads for period were as
follows:
Set up cost 120000
Receiving 30000
Dispatch 15000
Machining 65000
230000
Total labor hours
Lipstick Lip balm Lip gloss
Production Units 30000 35000 3000
Sales price 22 26 24
Material cost per unit 5 10 10
Labor hours per unit 3 Hours 2 Hours 2 Hours
Overhead for period were as
follows:
Set up cost 120000
Receiving 30000
Dispatch 15000
Machining 65000
Cost drive
Lipstick Lip balm Lip gloss
Machine hour per unit 4 4 4
Number of set ups 10 14 1
Number of deliveries received 10 10 2
Number of orders dispatched 20 20 10
Overheads for period were as
follows:
Set up cost 120000
Receiving 30000
Dispatch 15000
Machining 65000
230000
Total labor hours
⊘ This is a preview!⊘
Do you want full access?
Subscribe today to unlock all pages.
Trusted by 1+ million students worldwide
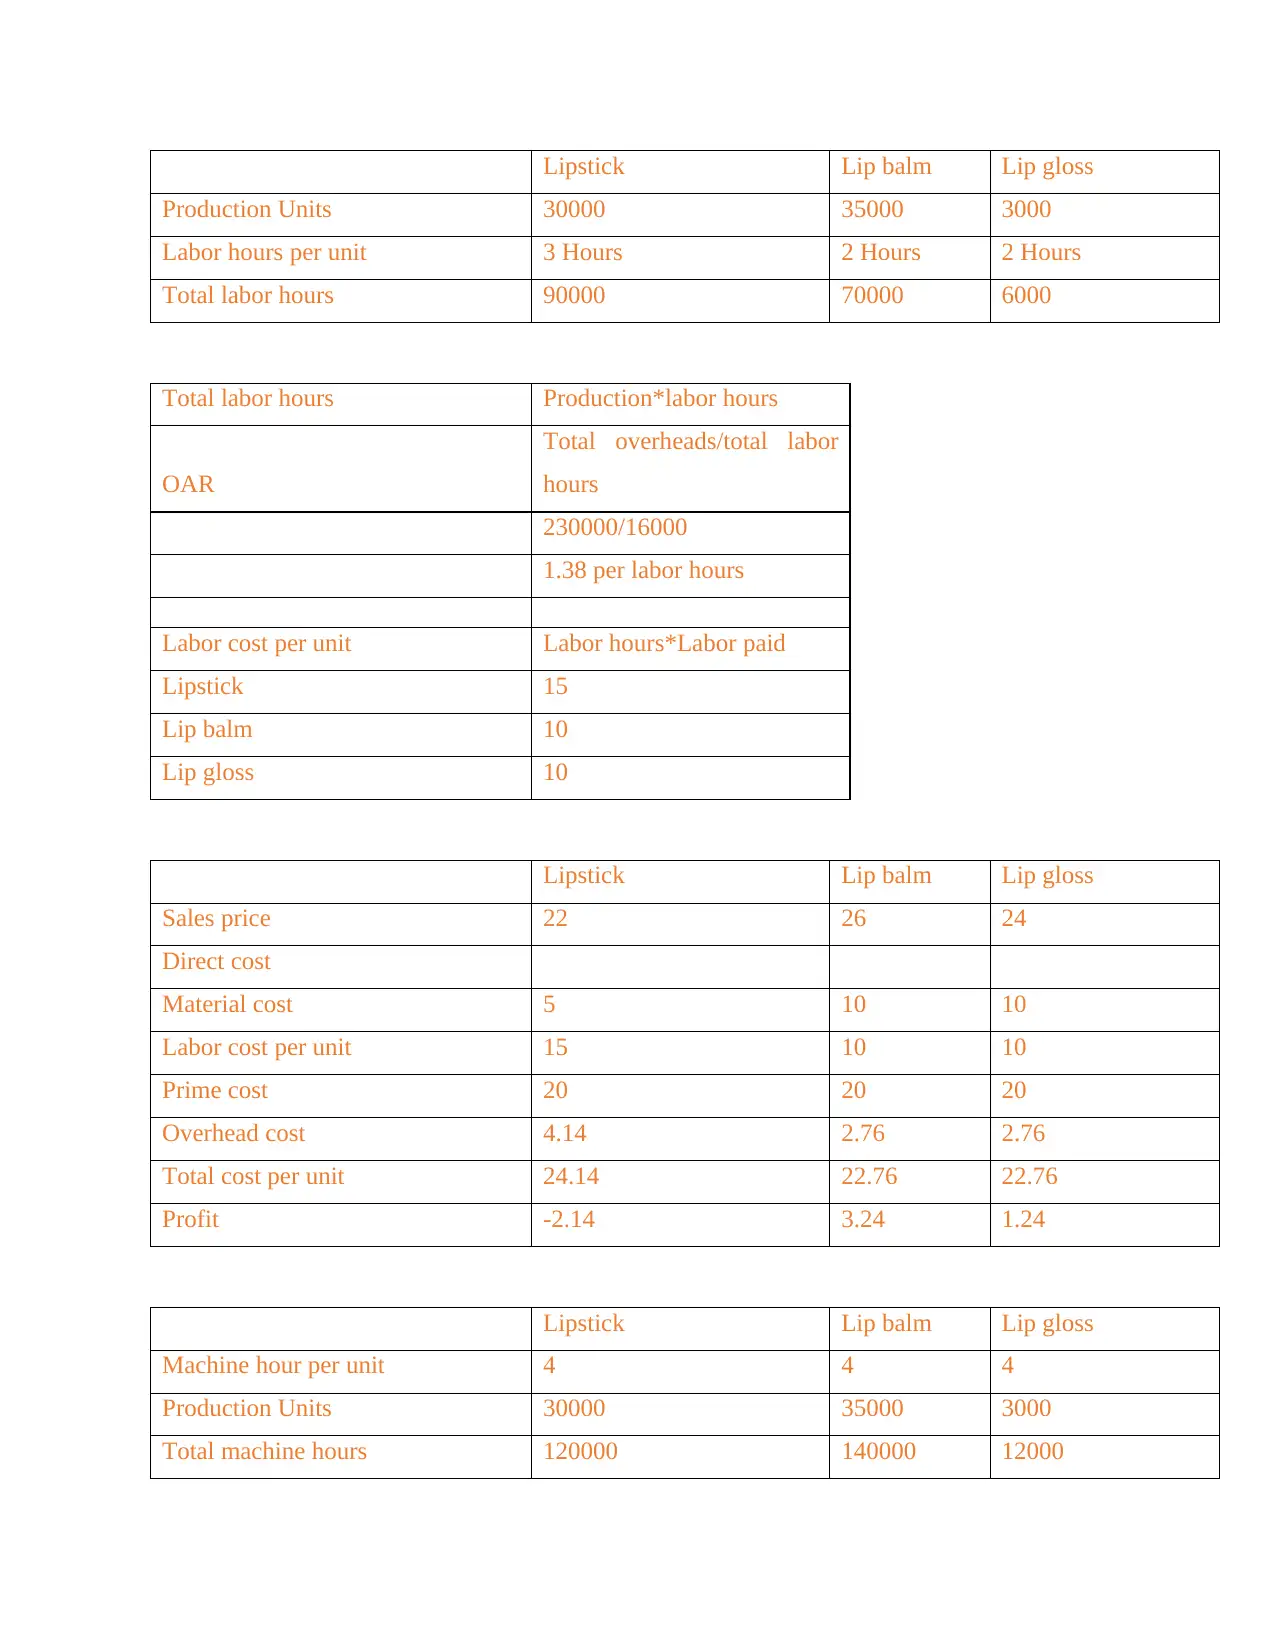
Lipstick Lip balm Lip gloss
Production Units 30000 35000 3000
Labor hours per unit 3 Hours 2 Hours 2 Hours
Total labor hours 90000 70000 6000
Total labor hours Production*labor hours
OAR
Total overheads/total labor
hours
230000/16000
1.38 per labor hours
Labor cost per unit Labor hours*Labor paid
Lipstick 15
Lip balm 10
Lip gloss 10
Lipstick Lip balm Lip gloss
Sales price 22 26 24
Direct cost
Material cost 5 10 10
Labor cost per unit 15 10 10
Prime cost 20 20 20
Overhead cost 4.14 2.76 2.76
Total cost per unit 24.14 22.76 22.76
Profit -2.14 3.24 1.24
Lipstick Lip balm Lip gloss
Machine hour per unit 4 4 4
Production Units 30000 35000 3000
Total machine hours 120000 140000 12000
Production Units 30000 35000 3000
Labor hours per unit 3 Hours 2 Hours 2 Hours
Total labor hours 90000 70000 6000
Total labor hours Production*labor hours
OAR
Total overheads/total labor
hours
230000/16000
1.38 per labor hours
Labor cost per unit Labor hours*Labor paid
Lipstick 15
Lip balm 10
Lip gloss 10
Lipstick Lip balm Lip gloss
Sales price 22 26 24
Direct cost
Material cost 5 10 10
Labor cost per unit 15 10 10
Prime cost 20 20 20
Overhead cost 4.14 2.76 2.76
Total cost per unit 24.14 22.76 22.76
Profit -2.14 3.24 1.24
Lipstick Lip balm Lip gloss
Machine hour per unit 4 4 4
Production Units 30000 35000 3000
Total machine hours 120000 140000 12000
Paraphrase This Document
Need a fresh take? Get an instant paraphrase of this document with our AI Paraphraser
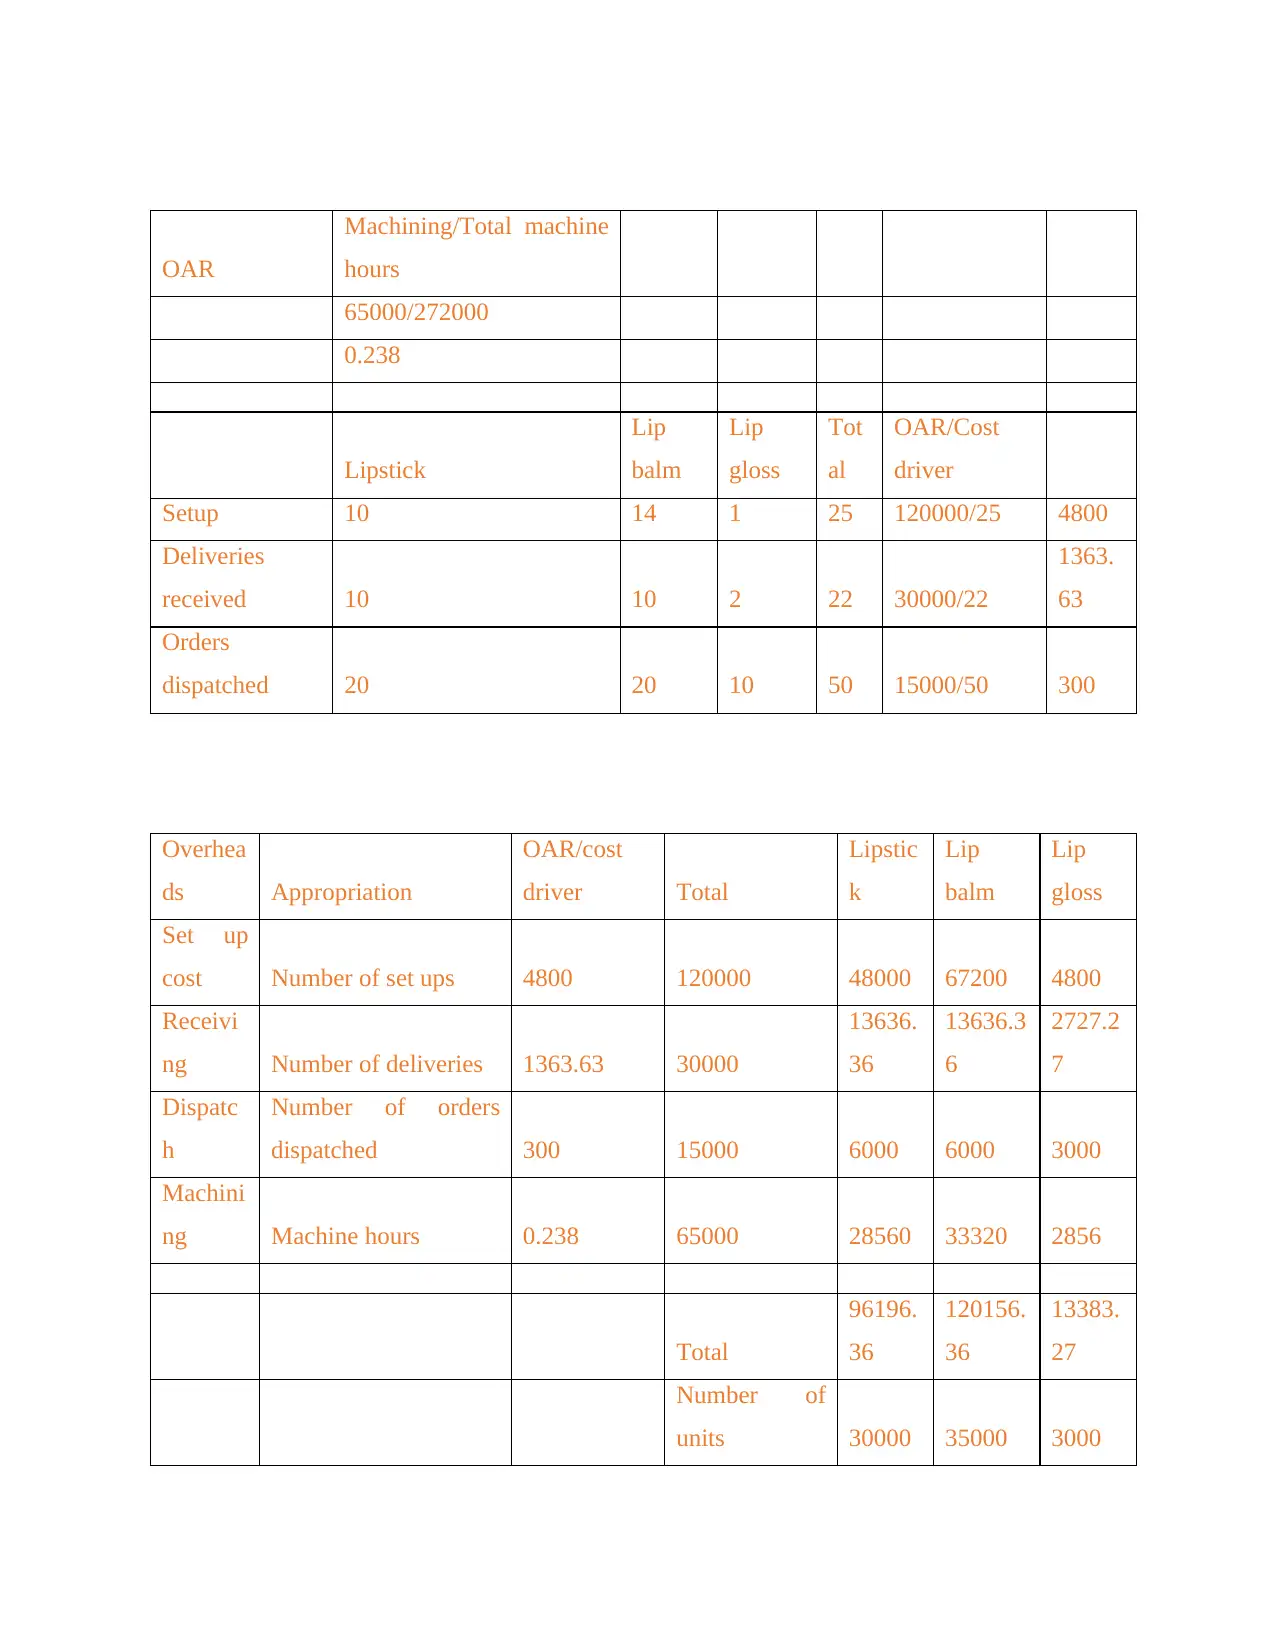
OAR
Machining/Total machine
hours
65000/272000
0.238
Lipstick
Lip
balm
Lip
gloss
Tot
al
OAR/Cost
driver
Setup 10 14 1 25 120000/25 4800
Deliveries
received 10 10 2 22 30000/22
1363.
63
Orders
dispatched 20 20 10 50 15000/50 300
Overhea
ds Appropriation
OAR/cost
driver Total
Lipstic
k
Lip
balm
Lip
gloss
Set up
cost Number of set ups 4800 120000 48000 67200 4800
Receivi
ng Number of deliveries 1363.63 30000
13636.
36
13636.3
6
2727.2
7
Dispatc
h
Number of orders
dispatched 300 15000 6000 6000 3000
Machini
ng Machine hours 0.238 65000 28560 33320 2856
Total
96196.
36
120156.
36
13383.
27
Number of
units 30000 35000 3000
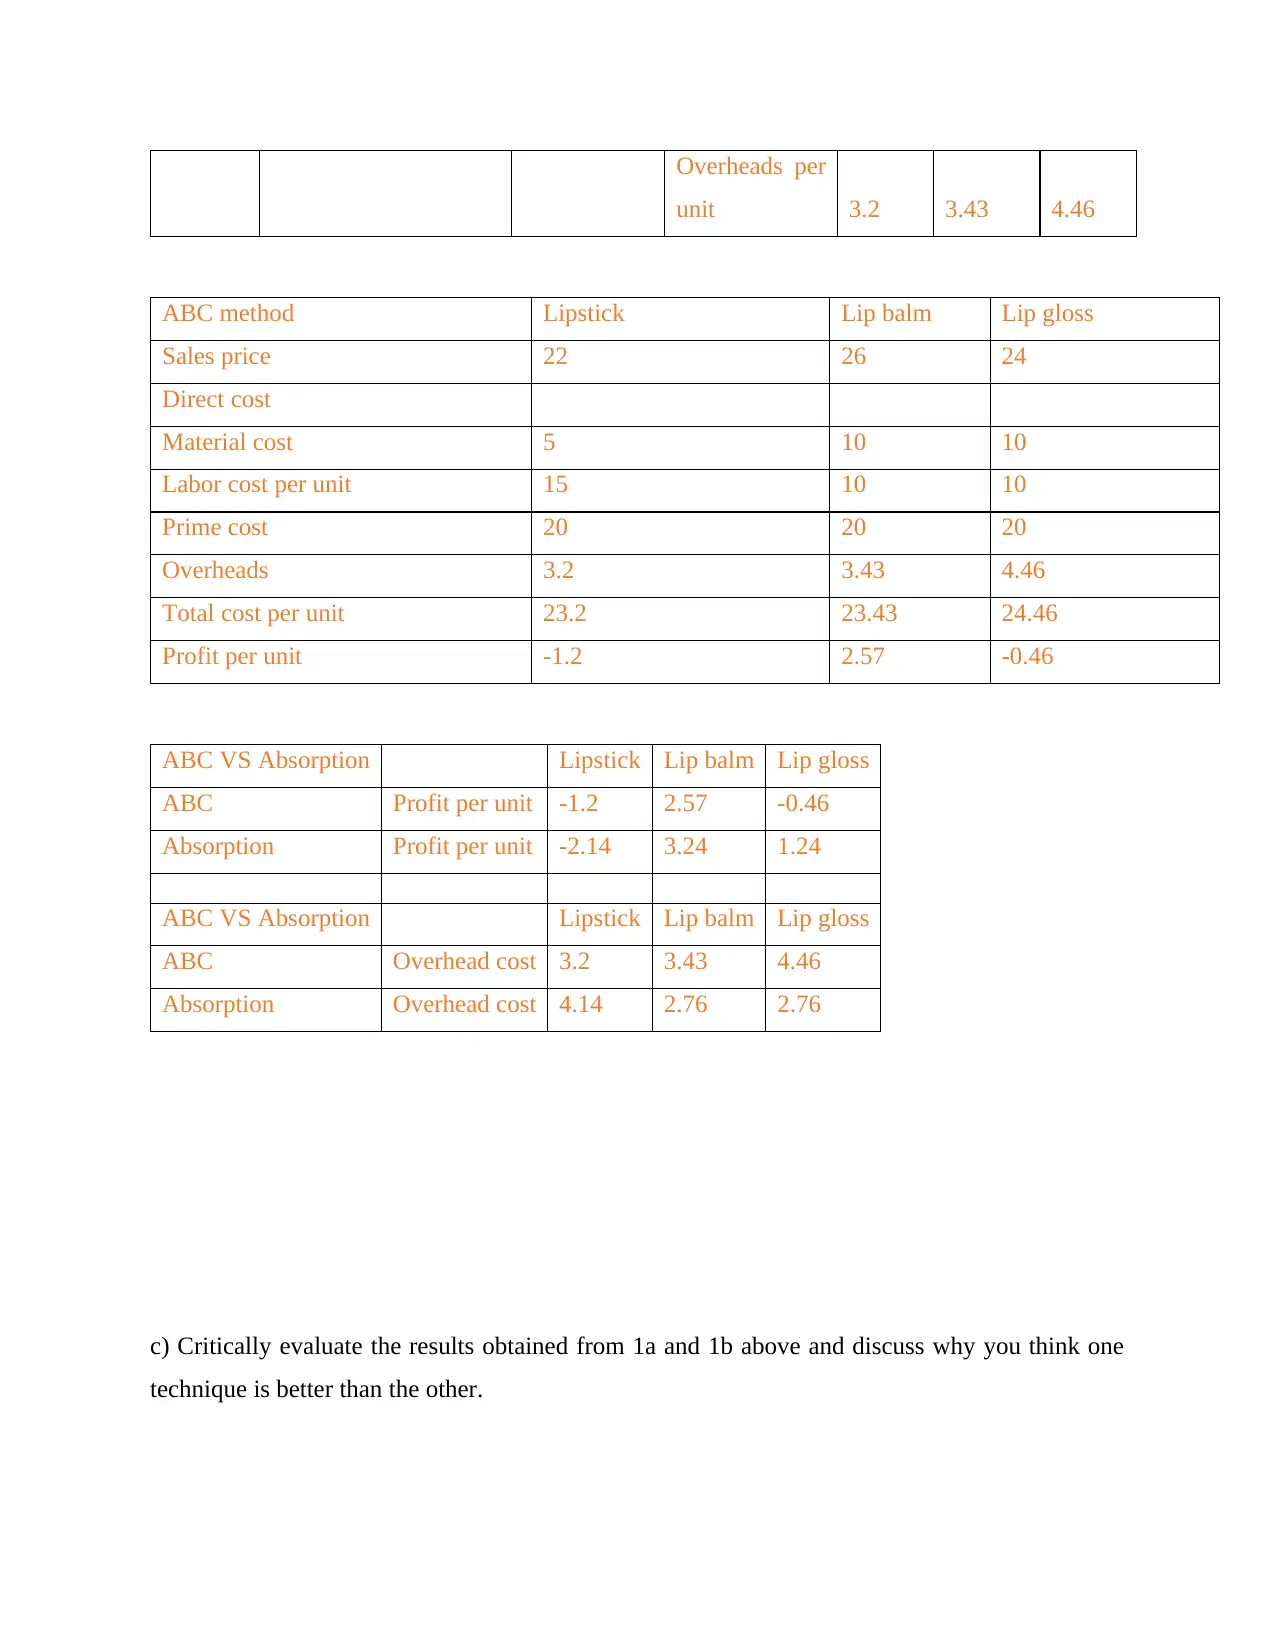
Overheads per
unit 3.2 3.43 4.46
ABC method Lipstick Lip balm Lip gloss
Sales price 22 26 24
Direct cost
Material cost 5 10 10
Labor cost per unit 15 10 10
Prime cost 20 20 20
Overheads 3.2 3.43 4.46
Total cost per unit 23.2 23.43 24.46
Profit per unit -1.2 2.57 -0.46
ABC VS Absorption Lipstick Lip balm Lip gloss
ABC Profit per unit -1.2 2.57 -0.46
Absorption Profit per unit -2.14 3.24 1.24
ABC VS Absorption Lipstick Lip balm Lip gloss
ABC Overhead cost 3.2 3.43 4.46
Absorption Overhead cost 4.14 2.76 2.76
c) Critically evaluate the results obtained from 1a and 1b above and discuss why you think one
technique is better than the other.
⊘ This is a preview!⊘
Do you want full access?
Subscribe today to unlock all pages.
Trusted by 1+ million students worldwide
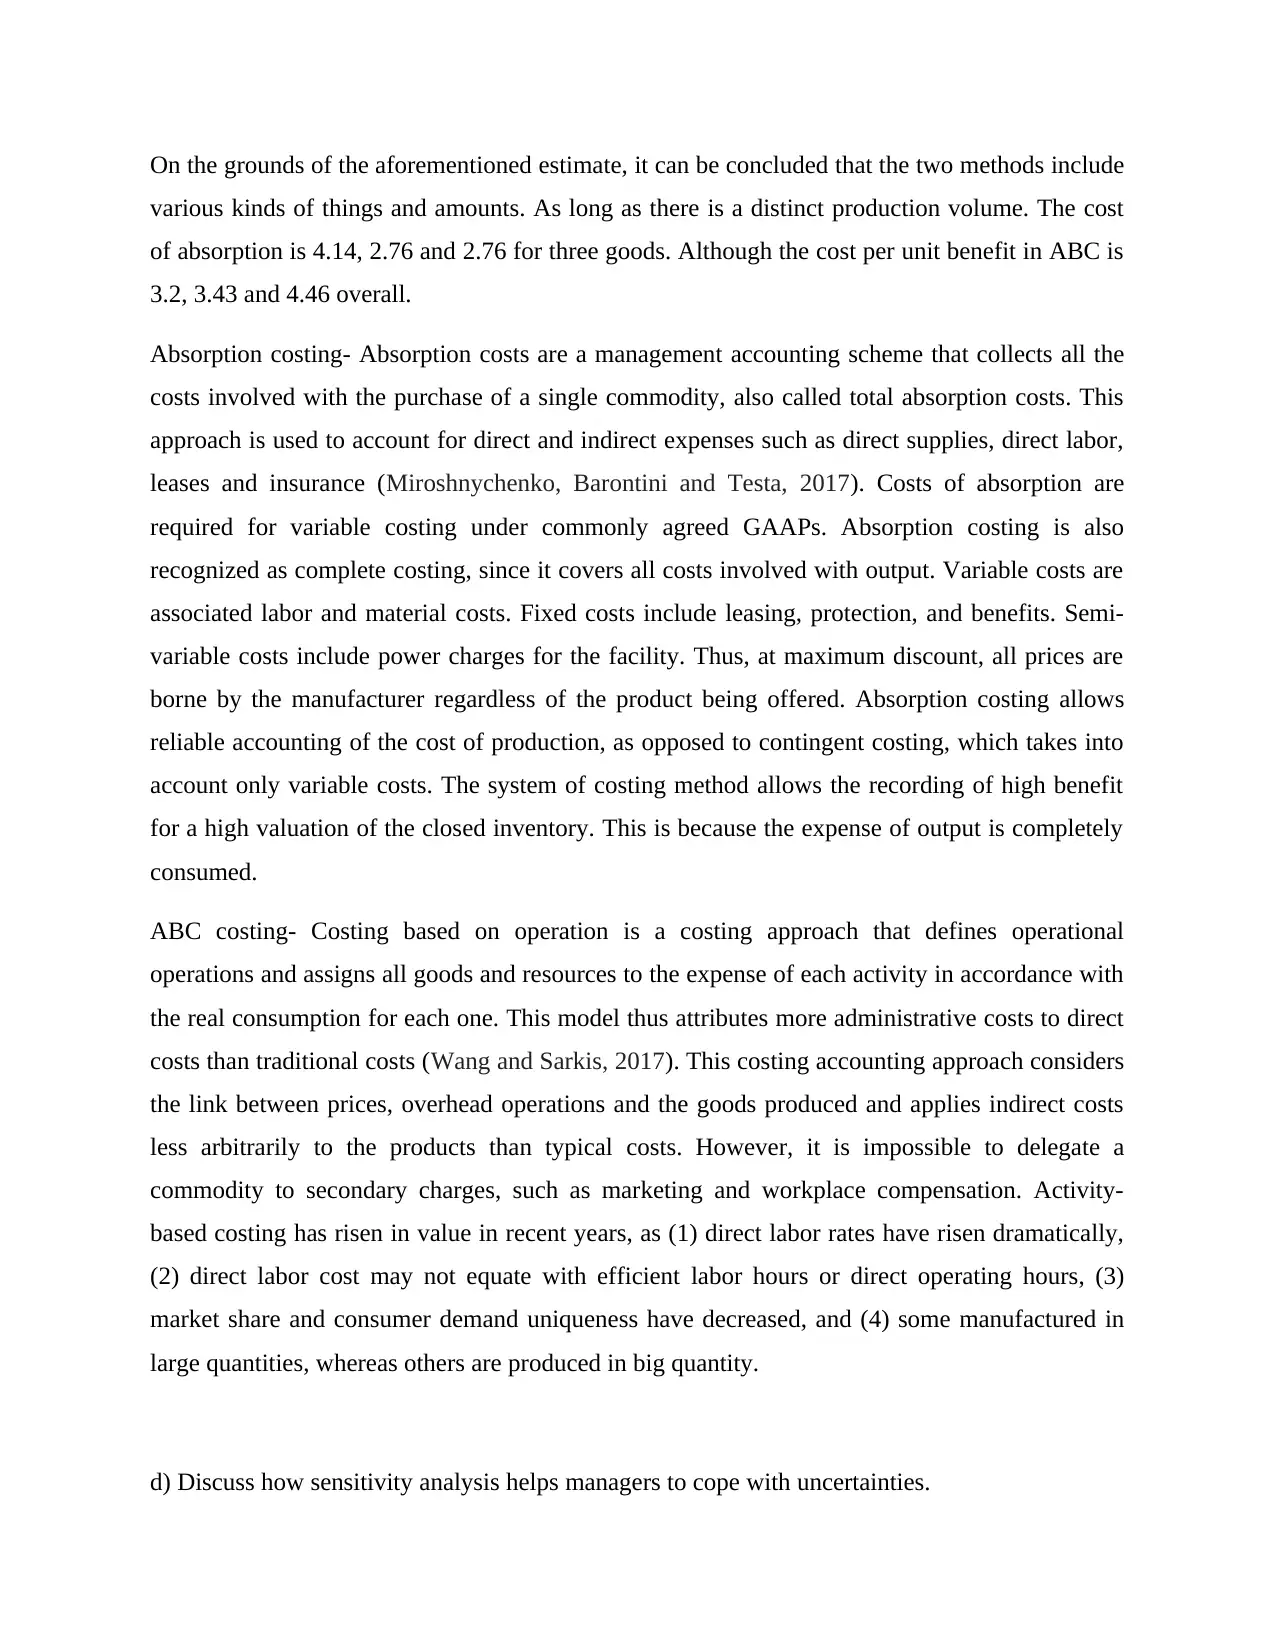
On the grounds of the aforementioned estimate, it can be concluded that the two methods include
various kinds of things and amounts. As long as there is a distinct production volume. The cost
of absorption is 4.14, 2.76 and 2.76 for three goods. Although the cost per unit benefit in ABC is
3.2, 3.43 and 4.46 overall.
Absorption costing- Absorption costs are a management accounting scheme that collects all the
costs involved with the purchase of a single commodity, also called total absorption costs. This
approach is used to account for direct and indirect expenses such as direct supplies, direct labor,
leases and insurance (Miroshnychenko, Barontini and Testa, 2017). Costs of absorption are
required for variable costing under commonly agreed GAAPs. Absorption costing is also
recognized as complete costing, since it covers all costs involved with output. Variable costs are
associated labor and material costs. Fixed costs include leasing, protection, and benefits. Semi-
variable costs include power charges for the facility. Thus, at maximum discount, all prices are
borne by the manufacturer regardless of the product being offered. Absorption costing allows
reliable accounting of the cost of production, as opposed to contingent costing, which takes into
account only variable costs. The system of costing method allows the recording of high benefit
for a high valuation of the closed inventory. This is because the expense of output is completely
consumed.
ABC costing- Costing based on operation is a costing approach that defines operational
operations and assigns all goods and resources to the expense of each activity in accordance with
the real consumption for each one. This model thus attributes more administrative costs to direct
costs than traditional costs (Wang and Sarkis, 2017). This costing accounting approach considers
the link between prices, overhead operations and the goods produced and applies indirect costs
less arbitrarily to the products than typical costs. However, it is impossible to delegate a
commodity to secondary charges, such as marketing and workplace compensation. Activity-
based costing has risen in value in recent years, as (1) direct labor rates have risen dramatically,
(2) direct labor cost may not equate with efficient labor hours or direct operating hours, (3)
market share and consumer demand uniqueness have decreased, and (4) some manufactured in
large quantities, whereas others are produced in big quantity.
d) Discuss how sensitivity analysis helps managers to cope with uncertainties.
Paraphrase This Document
Need a fresh take? Get an instant paraphrase of this document with our AI Paraphraser
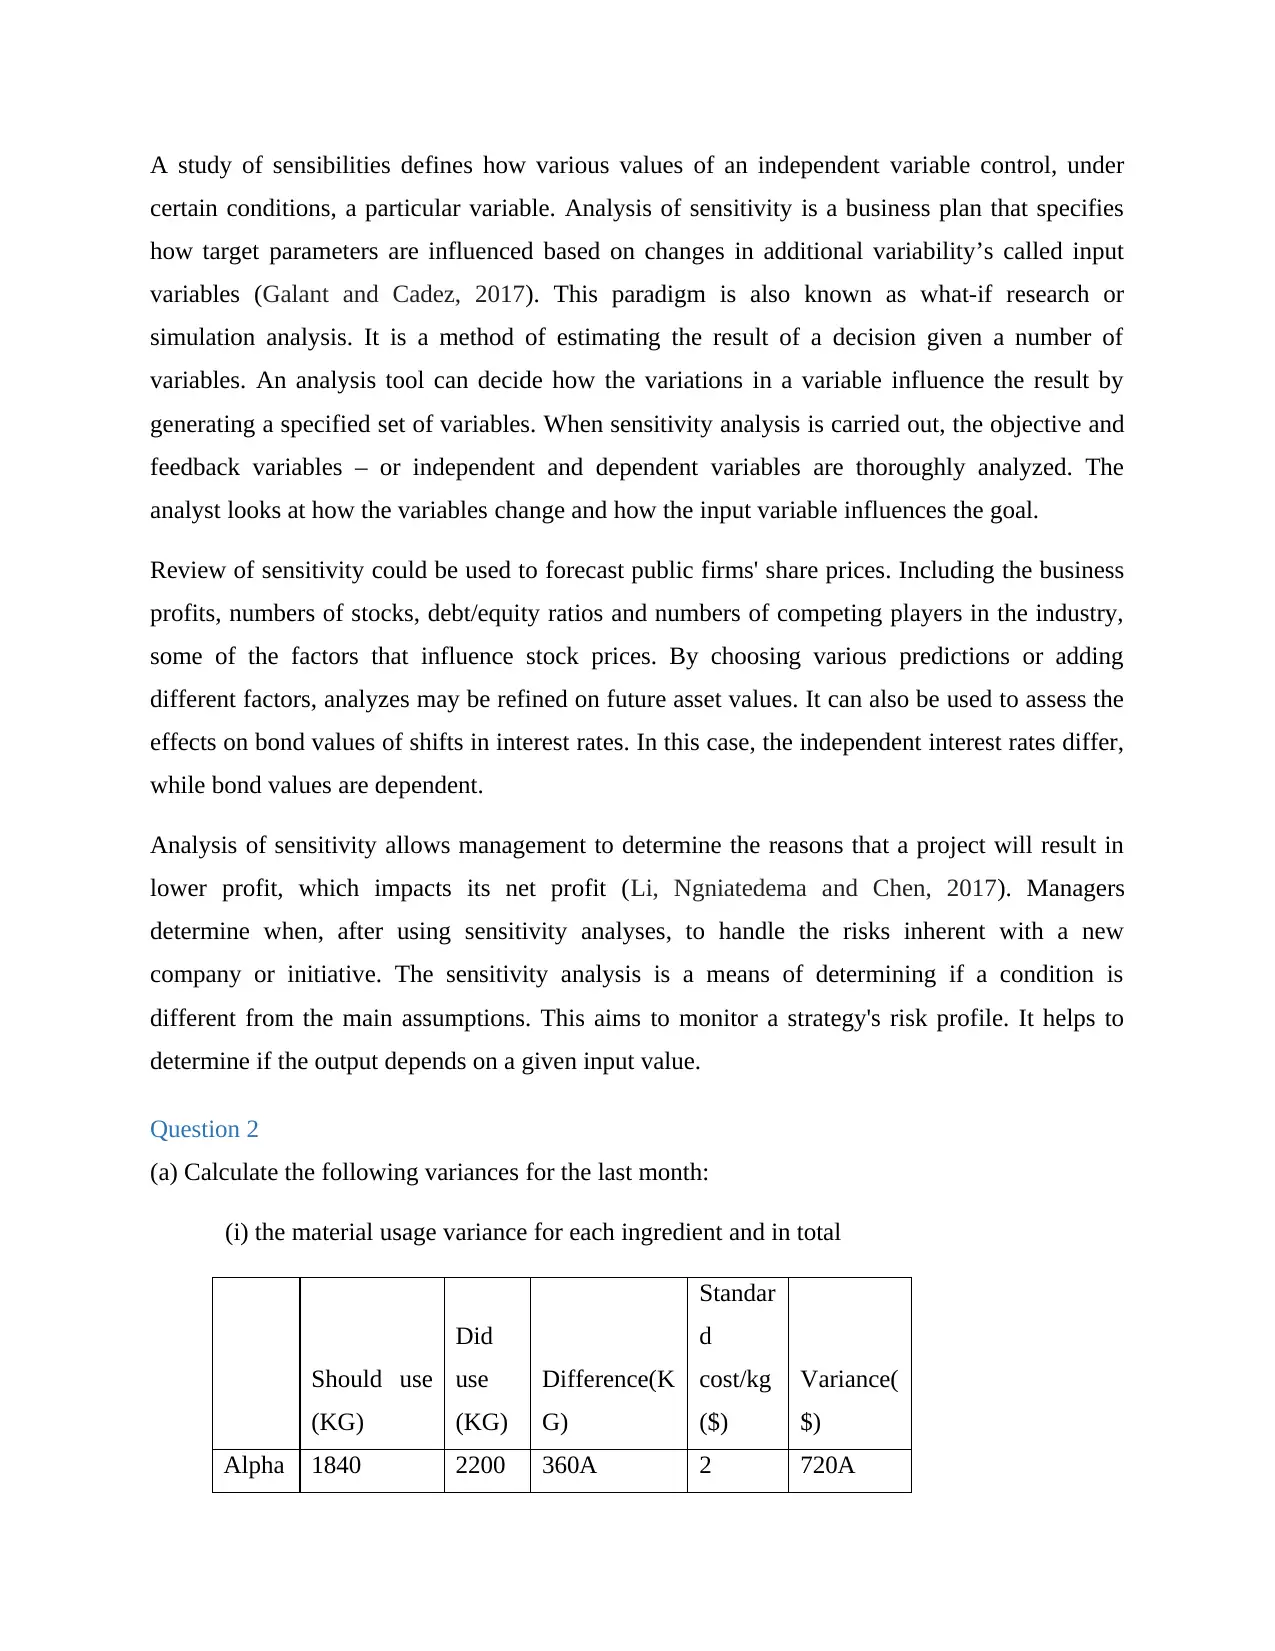
A study of sensibilities defines how various values of an independent variable control, under
certain conditions, a particular variable. Analysis of sensitivity is a business plan that specifies
how target parameters are influenced based on changes in additional variability’s called input
variables (Galant and Cadez, 2017). This paradigm is also known as what-if research or
simulation analysis. It is a method of estimating the result of a decision given a number of
variables. An analysis tool can decide how the variations in a variable influence the result by
generating a specified set of variables. When sensitivity analysis is carried out, the objective and
feedback variables – or independent and dependent variables are thoroughly analyzed. The
analyst looks at how the variables change and how the input variable influences the goal.
Review of sensitivity could be used to forecast public firms' share prices. Including the business
profits, numbers of stocks, debt/equity ratios and numbers of competing players in the industry,
some of the factors that influence stock prices. By choosing various predictions or adding
different factors, analyzes may be refined on future asset values. It can also be used to assess the
effects on bond values of shifts in interest rates. In this case, the independent interest rates differ,
while bond values are dependent.
Analysis of sensitivity allows management to determine the reasons that a project will result in
lower profit, which impacts its net profit (Li, Ngniatedema and Chen, 2017). Managers
determine when, after using sensitivity analyses, to handle the risks inherent with a new
company or initiative. The sensitivity analysis is a means of determining if a condition is
different from the main assumptions. This aims to monitor a strategy's risk profile. It helps to
determine if the output depends on a given input value.
Question 2
(a) Calculate the following variances for the last month:
(i) the material usage variance for each ingredient and in total
Should use
(KG)
Did
use
(KG)
Difference(K
G)
Standar
d
cost/kg
($)
Variance(
$)
Alpha 1840 2200 360A 2 720A
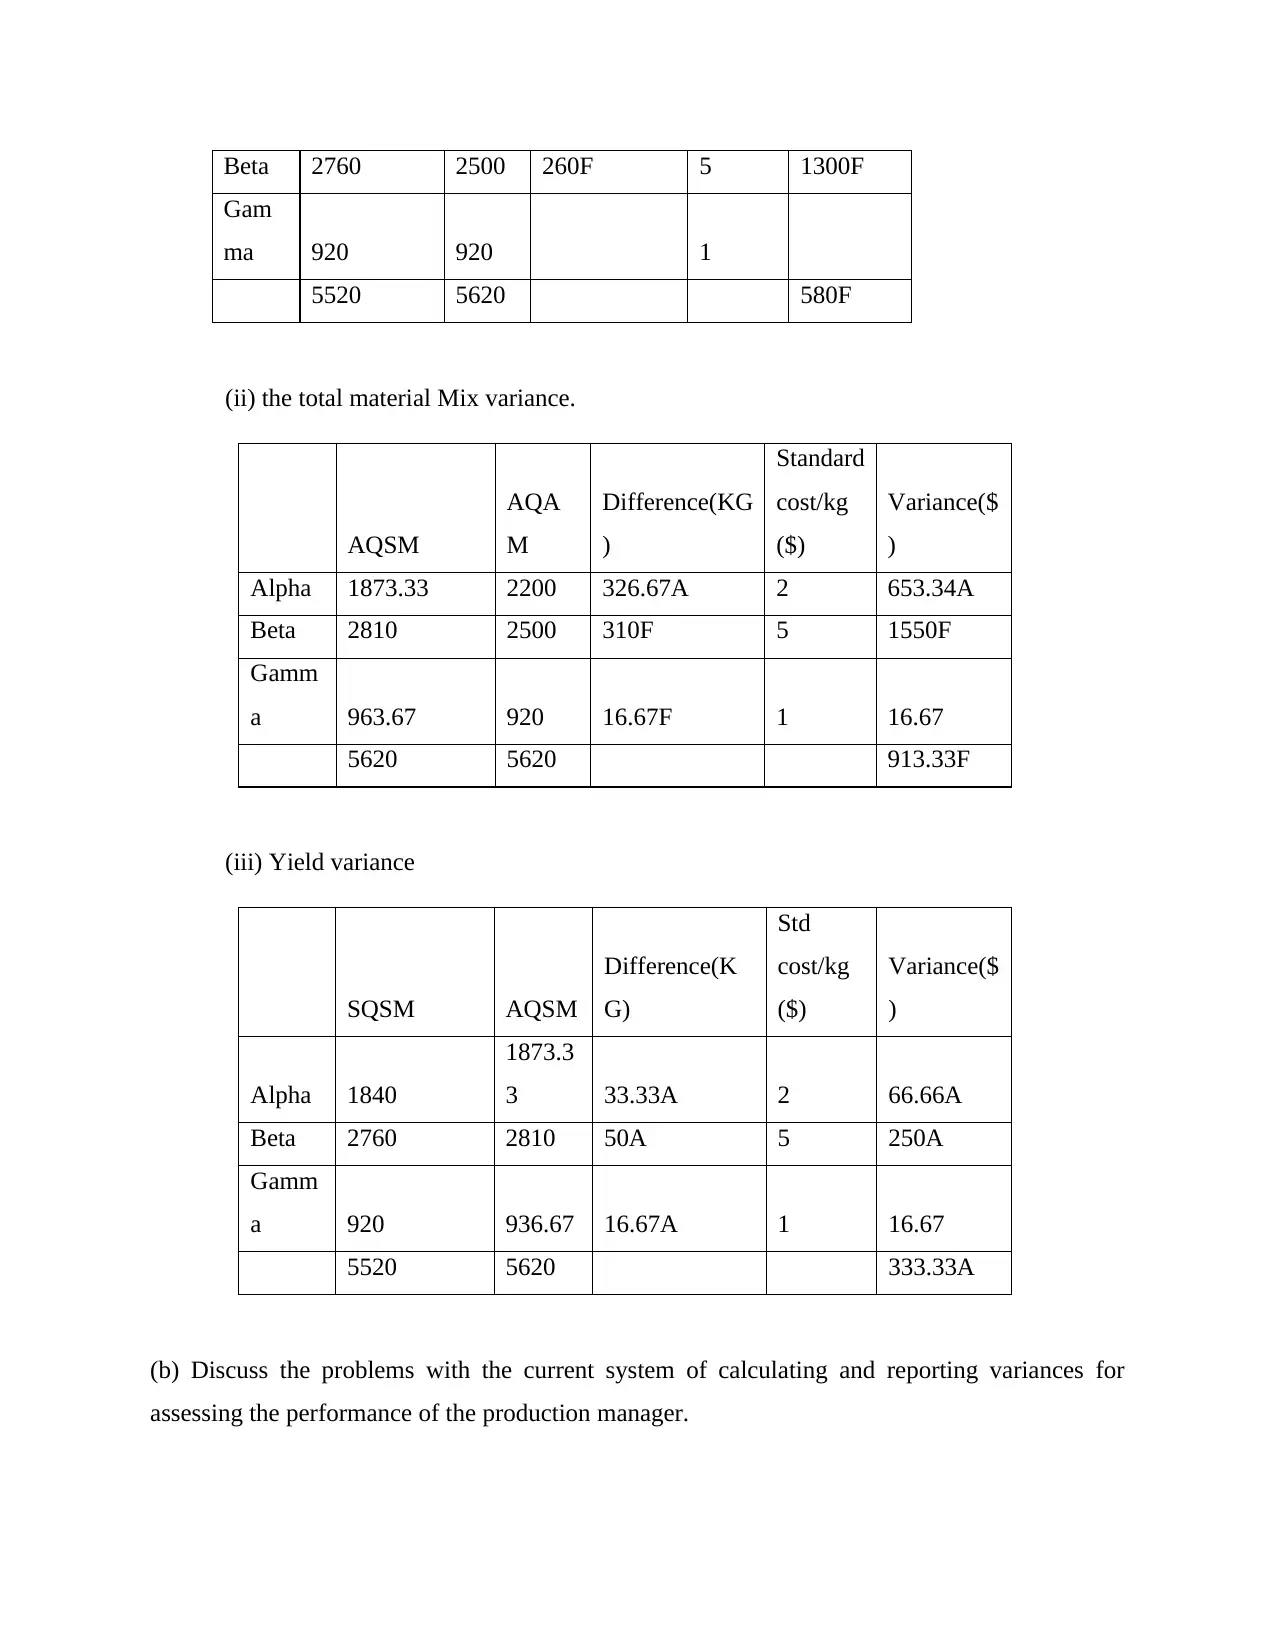
Beta 2760 2500 260F 5 1300F
Gam
ma 920 920 1
5520 5620 580F
(ii) the total material Mix variance.
AQSM
AQA
M
Difference(KG
)
Standard
cost/kg
($)
Variance($
)
Alpha 1873.33 2200 326.67A 2 653.34A
Beta 2810 2500 310F 5 1550F
Gamm
a 963.67 920 16.67F 1 16.67
5620 5620 913.33F
(iii) Yield variance
SQSM AQSM
Difference(K
G)
Std
cost/kg
($)
Variance($
)
Alpha 1840
1873.3
3 33.33A 2 66.66A
Beta 2760 2810 50A 5 250A
Gamm
a 920 936.67 16.67A 1 16.67
5520 5620 333.33A
(b) Discuss the problems with the current system of calculating and reporting variances for
assessing the performance of the production manager.
⊘ This is a preview!⊘
Do you want full access?
Subscribe today to unlock all pages.
Trusted by 1+ million students worldwide
The raw material price variances included in study are likely beyond the scope of the
manufacturing manager and are mostly the responsibility of the procurement manager. In
addition, the project manager is not interested in setting the regular blend (Santis, Albuquerque
and Lizarelli, 2016). It is demoralizing to keep management responsible for differences they
cannot regulate.
There is to be little need in scheduling differences. Prices and efficiency of the three materials
are unpredictable and the use of ex ante prices and use requirements can offer a skewed view of
mixing and yield differences. Failure to isolate uncontrollable preparation variances can be
demoralizing.
Despite improvements in the quality and price of products, the basic mixture for the substance
has not improved in five years. It can also cause the project manager to undertake control
decisions on the basis of differences that are measured on the basis of out-of-date specifications.
As Kappa Co does not actually have reviews or comments, there is a lack of a true image of the
success of the project manager. There is still no obeying to the measured variances. Since Kappa
Co does not seem to put much emphasis on differences, the project manager would not be able to
control costs that could become apathetic, that could adversely affect Kappa Co as a whole.
This can be shown by looking at the entire utilization variance registered, which indicates a
favorable variance of $580, such that the project manager might expect good efficiency. Even so,
if the use variation is viewed in more depth, by means of the mix and yield measurements, it can
be found that it was motivated by a shift in the mix. There is a clear connection between the two.
Materials combination variation and material yield variance, by using a blend of products that
varied from the default, resulting in savings of $913·33; nevertheless, the yield was slightly
smaller than would have been obtained by Kappa Co had the conventional mix of products been
applied to. Even adjusting the mix may have an effect on consistency and, as a result, revenue,
and there is little detail on this.
Paraphrase This Document
Need a fresh take? Get an instant paraphrase of this document with our AI Paraphraser
Question 3
Zero-based budgeting (ZBB) is a method from start to make a budget. The budget does not
depend on prior budgets. The plan stops at zero instead. For zero-based financial planning,
before applying it to the main feature, they need to explain any cost (Wahyudin and Solikhah,
2017). The aim of zero-based financial planning is to minimize expenditure by focusing at where
it is possible to cut expenses. Zero-based budgeting (ZBB) is a strategy that helps balance
corporate spending with financial priorities. The plan allows organizations to construct their
annual budget from zero per year and tests were performed that all aspects of the yearly budget
are expense, appropriate and generate better savings.
Role of ZBB in planning and coordination:
ZBB encourages top-level strategic priorities to be incorporated in the budgeting phase by
connecting them to the firm's particular functional regions, where expenditures can be grouped
first and then assessed against past performance and existing goals. It also strengthens
departmental teamwork and collaboration and motivates workers by engaging them in decision-
making.Many market issues accompany this style of strategy. In addition, during the planning of
a proposal, the possible adjustments in the next year are often taken into account, beyond
previous practice. If there is some drawback or mistake in the prior year's budget that has not
been found by any entity so far, it is very hard to schedule an appropriate budget for the years to
come. These elements are solved in the zero lose budgeting process.
Incremental budgeting: Incremental budgeting is a form of budgeting mechanism that is focused
on the premise that by having only certain minor adjustments to the existing budget, a budget
deal can better be created. In other words, the actual budget is used for budgetary control as a
basis on which additional adjustments are applied or deducted to assess new budget sums from
the base amounts. Incremental budgeting is widely known as the most restrictive strategy of all
types of financial planning. The best budgeting approach is gradual budgeting. Since it utilizes
the plan for the present period to estimate the future plan, detailed estimates are not needed.
Often, in the budgeting process, only a few assumptions are needed. Finally, the flexibility of the
approach helps the operations of the business to save time in the budgetary control.
Role of IB in planning and coordination:
Incrementalbudgets are important to demonstrate the budgetary consequences of the plans, to
describe the tools needed to implement these plans and to provide a way of evaluating, assessing
and monitoring the outcomes achieved as opposed to the plans (Nollet, Filis and Mitrokostas,
2016). The budget should also stop immediate crises, too. Incremental budgeting is an essential
aspect of planning for administration, based on the idea of making a minor adjustment to the
present budget to meet the new budget. Only incremental sums are applied to meet the latest
numbers budgeted. There is no set rule for hitting the incremental budget, but a strategy is
pursued. The cumulative budgeting strategy continues with the premise that the costs
accumulated in the prior year will be the starting point for the current year's projections. An
insight into the benefits and drawbacks of incremental budgeting can help understand the notion.
The budget used for the present fiscal year will become the framework for focusing on the
spending allocation for the next year. The analysts expect that all agencies will keep running at
their current spending level, and if any extra amount is needed, the budgeting figures for the next
year will be applied. Cases where spending could be smaller can, in the light of such
expectations, result in a budget cut from the existing base year.
⊘ This is a preview!⊘
Do you want full access?
Subscribe today to unlock all pages.
Trusted by 1+ million students worldwide
1 out of 13
Related Documents


Your All-in-One AI-Powered Toolkit for Academic Success.
+13062052269
info@desklib.com
Available 24*7 on WhatsApp / Email
![[object Object]](/_next/static/media/star-bottom.7253800d.svg)
Unlock your academic potential
Copyright © 2020–2026 A2Z Services. All Rights Reserved. Developed and managed by ZUCOL.