Financial Analysis Report: Performance of Airlines and CAPM

Verified

Added on  2019/12/18

|8
|1471
|264
Report
AI Summary
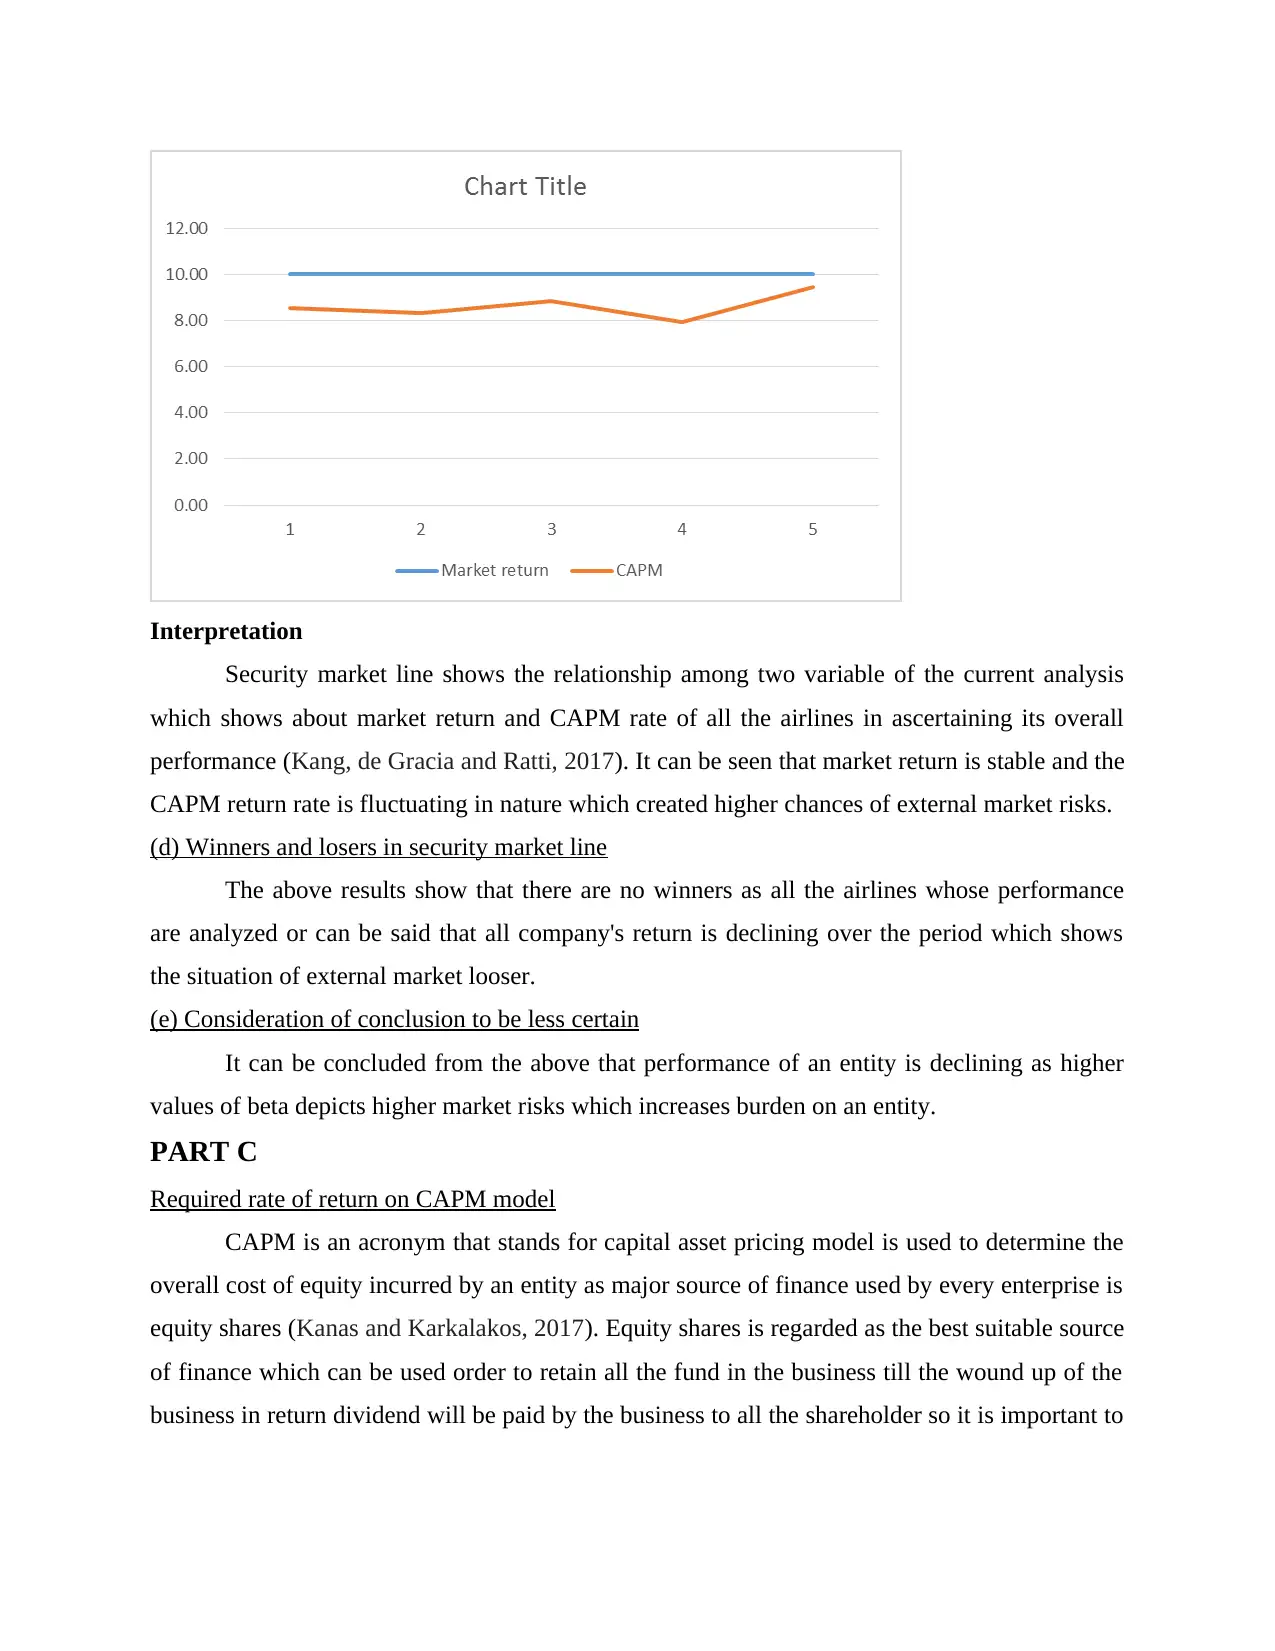
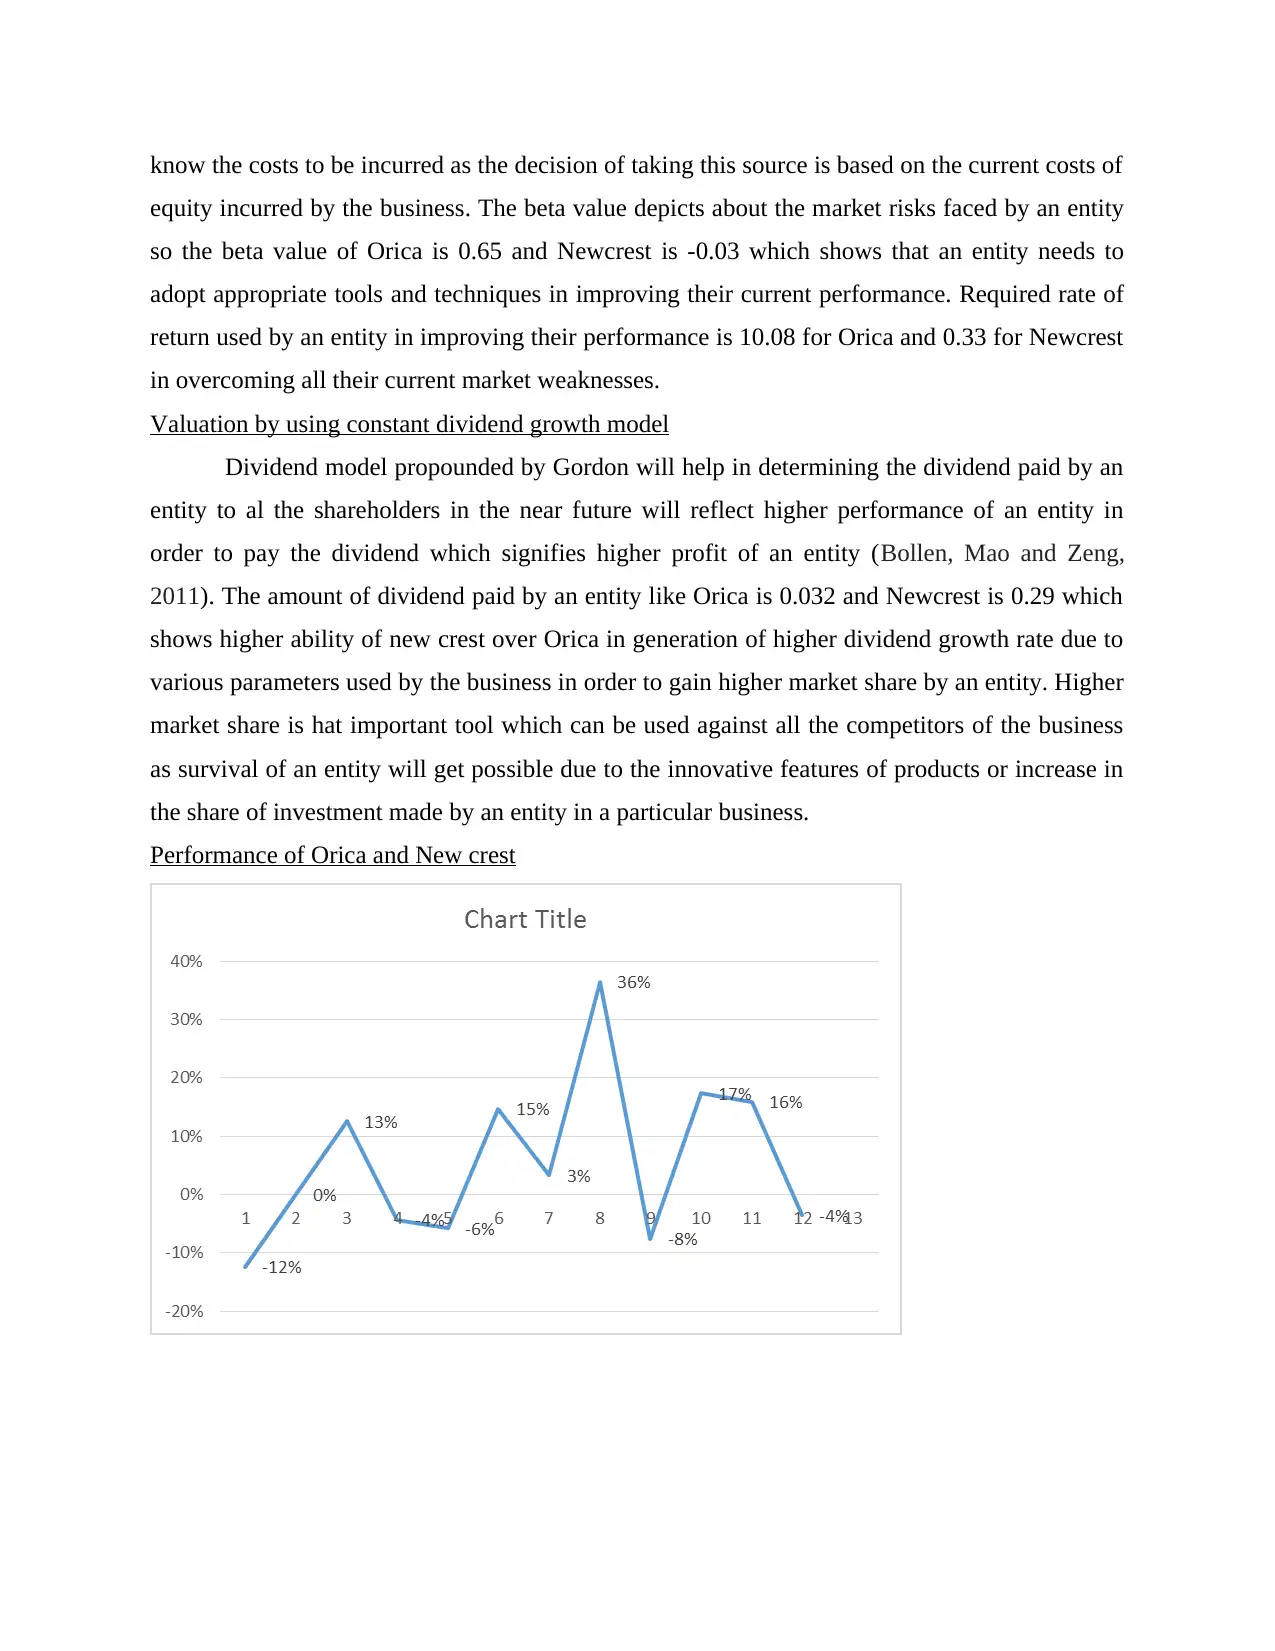
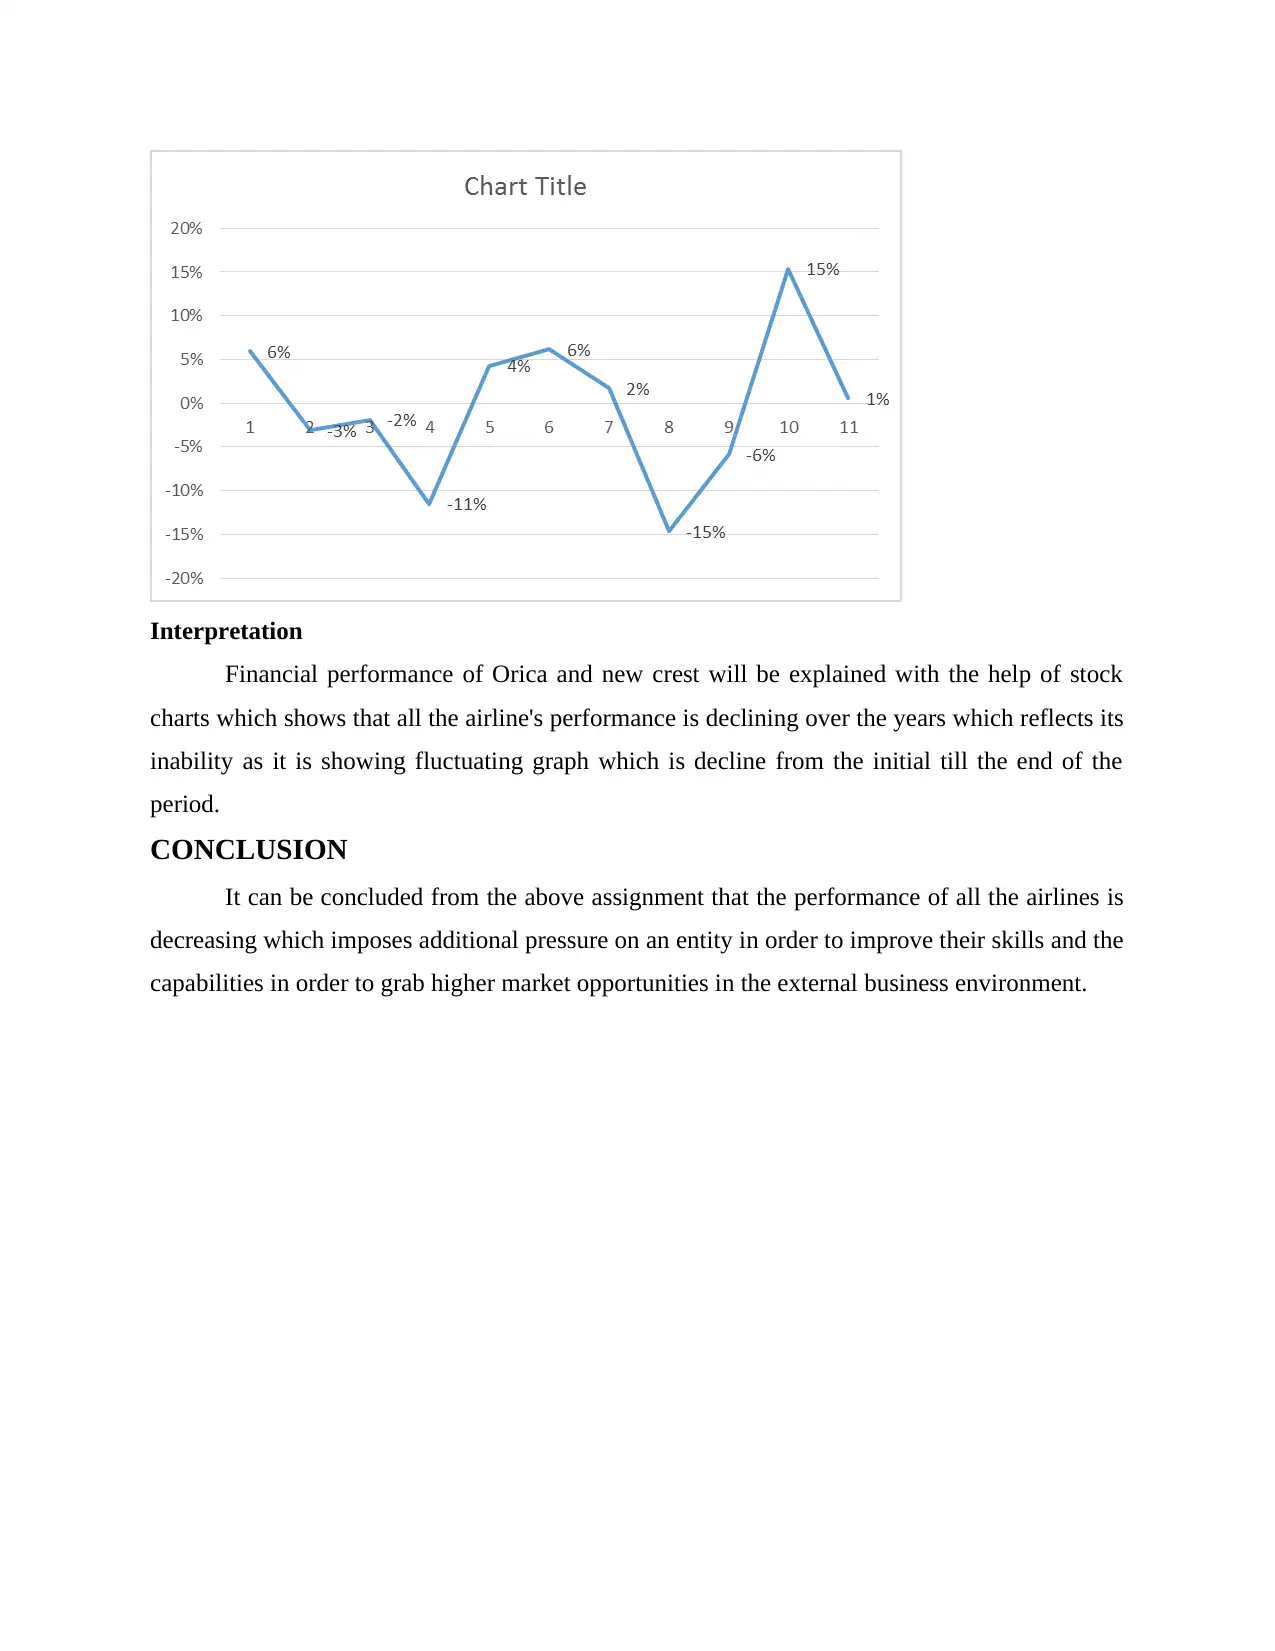
This report provides a comprehensive financial analysis, focusing on the performance of various airlines. It begins by examining loan interest rates and the impact of the Reserve Bank of Australia's cash rate. The core of the report analyzes portfolio returns and beta calculations, assessing market risks and the security market line to identify winners and losers. The analysis then delves into the Capital Asset Pricing Model (CAPM) to determine the required rate of return, followed by valuation using the constant dividend growth model. The report includes a performance comparison of Orica and Newcrest using stock charts, leading to a conclusion that emphasizes the need for airlines to improve their skills and capabilities to capitalize on market opportunities. The report references several academic sources to support its findings.
tabler-icon-diamond-filled.svg

Contribute Materials

Your contribution can guide someone’s learning journey. Share your documents today.
Document Page
ACCOUNTING AND
FINANCE
tabler-icon-diamond-filled.svg

Secure Best Marks with AI Grader

Need help grading? Try our AI Grader for instant feedback on your assignments.
Document Page
Table of Contents
INTRODUCTION...........................................................................................................................3
PART A...........................................................................................................................................3
a) If interest and principle are all repaid at the end of the three-month loan term, what is the
annual percentage rate on the loan offer make by the bank?.......................................................3
b) If the bank were to offer to lower the rate to the Reserve Bank of Australia cash rate if
interest is discounted, should you accept this alternative............................................................3
PART B............................................................................................................................................3
(a)Expected return on the portfolio..............................................................................................3
(b) Calculation of portfolio beta..................................................................................................4
c) Security market line.................................................................................................................4
(d) Winners and losers in security market line............................................................................5
(e) Consideration of conclusion to be less certain.......................................................................5
Part C...............................................................................................................................................5
Required rate of return on CAPM model.....................................................................................5
Valuation by using constant dividend growth model..................................................................6
Performance of Orica and New crest...........................................................................................6
CONCLUSION................................................................................................................................7
REFERENCES................................................................................................................................8
Document Page
INTRODUCTION
Role of finance has increases with the increasing complexities of the business which will
be managed through the application of various techniques. This project is all about analyzing
current business performance in order to predict future performance of an entity in relation to
various parameters used by an entity.
PART A
a) If interest and principle are all repaid at the end of the three-month loan term, what is the
annual percentage rate on the loan offer make by the bank?
Interest on loan is in total 4% by considering 3% standard limit along with the additional
rate of 1% charged especially by the commercial banks for providing loan to an entity in
accomplishing all the desired aims and the objectives.
b) If the bank were to offer to lower the rate to the Reserve Bank of Australia cash rate if interest
is discounted, should you accept this alternative
The cash flows taken in the present value is taken as 4% of total 240000 which is
additional need of an entity for a period of three-months. It can be seen that present value of the
additional requirements of an entity is higher in 2% as compared to the 4% so, this particular
interest will be rejected as paying higher interest will not generate higher returns in the near
future.
PART B
(a)Expected return on the portfolio
As per the data given in the file the total expected portfolio return on all the airlines is
15.80% that is strong enough in order to generate higher business outcomes in the near future by
improving its overall performance over the period (Kang, de Gracia and Ratti, 2017). The
Document Page
overall expected portfolio return of all the airlines is slightly higher than compare to the market
return which is not good for an entity that needs to be improved with the time. The higher
contribution given in the expected portfolio return by Harvey normal Holding is 3.2% and their
expected return is also higher which is 16%.
(b) Calculation of portfolio beta
Portfolio beta shows the higher market risks an entity faced in the external market which
is essential for them in order to improve its overall performance over the years. The total
portfolio beta is 0.8295 which is even less than one which is reflecting lower market
performance of the business by trading in the external business market which required o boost
their current market performance (Bollen, Mao and Zeng, 2011). Qantas airways leads in
generating higher portfolio beta return is 0.189 which is strong market return rate that may
generate higher returns in the near future for improving overall performance of a entity.
c) Security market line
Market return CAPM
10.00 8.55472
10.00 8.324198
10.00 8.85808
10.00 7.936624
10.00 9.467328
tabler-icon-diamond-filled.svg

Secure Best Marks with AI Grader

Need help grading? Try our AI Grader for instant feedback on your assignments.
Document Page
Interpretation
Security market line shows the relationship among two variable of the current analysis
which shows about market return and CAPM rate of all the airlines in ascertaining its overall
performance (Kang, de Gracia and Ratti, 2017). It can be seen that market return is stable and the
CAPM return rate is fluctuating in nature which created higher chances of external market risks.
(d) Winners and losers in security market line
The above results show that there are no winners as all the airlines whose performance
are analyzed or can be said that all company's return is declining over the period which shows
the situation of external market looser.
(e) Consideration of conclusion to be less certain
It can be concluded from the above that performance of an entity is declining as higher
values of beta depicts higher market risks which increases burden on an entity.
PART C
Required rate of return on CAPM model
CAPM is an acronym that stands for capital asset pricing model is used to determine the
overall cost of equity incurred by an entity as major source of finance used by every enterprise is
equity shares (Kanas and Karkalakos, 2017). Equity shares is regarded as the best suitable source
of finance which can be used order to retain all the fund in the business till the wound up of the
business in return dividend will be paid by the business to all the shareholder so it is important to
Document Page
know the costs to be incurred as the decision of taking this source is based on the current costs of
equity incurred by the business. The beta value depicts about the market risks faced by an entity
so the beta value of Orica is 0.65 and Newcrest is -0.03 which shows that an entity needs to
adopt appropriate tools and techniques in improving their current performance. Required rate of
return used by an entity in improving their performance is 10.08 for Orica and 0.33 for Newcrest
in overcoming all their current market weaknesses.
Valuation by using constant dividend growth model
Dividend model propounded by Gordon will help in determining the dividend paid by an
entity to al the shareholders in the near future will reflect higher performance of an entity in
order to pay the dividend which signifies higher profit of an entity (Bollen, Mao and Zeng,
2011). The amount of dividend paid by an entity like Orica is 0.032 and Newcrest is 0.29 which
shows higher ability of new crest over Orica in generation of higher dividend growth rate due to
various parameters used by the business in order to gain higher market share by an entity. Higher
market share is hat important tool which can be used against all the competitors of the business
as survival of an entity will get possible due to the innovative features of products or increase in
the share of investment made by an entity in a particular business.
Performance of Orica and New crest
Document Page
Interpretation
Financial performance of Orica and new crest will be explained with the help of stock
charts which shows that all the airline's performance is declining over the years which reflects its
inability as it is showing fluctuating graph which is decline from the initial till the end of the
period.
CONCLUSION
It can be concluded from the above assignment that the performance of all the airlines is
decreasing which imposes additional pressure on an entity in order to improve their skills and the
capabilities in order to grab higher market opportunities in the external business environment.
tabler-icon-diamond-filled.svg

Paraphrase This Document

Need a fresh take? Get an instant paraphrase of this document with our AI Paraphraser
Document Page
REFERENCES
Books and Journals
Bollen, J., Mao, H. and Zeng, X., 2011. Twitter mood predicts the stock market. Journal of
computational science. 2(1). pp.1-8.
Han, B., Subrahmanyam, A. and Zhou, Y., 2017. The term structure of credit spreads, firm
fundamentals, and expected stock returns. Journal of Financial Economics.
Kang, W., de Gracia, F. P. and Ratti, R. A., 2017. Oil price shocks, policy uncertainty, and stock
returns of oil and gas corporations. Journal of International Money and Finance. 70.
pp.344-359.
Kanas, A. and Karkalakos, S., 2017. Equity flows, stock returns and exchange
rates. International Journal of Finance & Economics.
Online
Cash rate, 2017. [Online]. Available through :< http://www.rba.gov.au/statistics/cash-rate/>.
[Accessed on 18th April 2017].
chevron_up_icon
1 out of 8
circle_padding
hide_on_mobile
zoom_out_icon
logo.png

Your All-in-One AI-Powered Toolkit for Academic Success.

Available 24*7 on WhatsApp / Email

[object Object]