Strategic Analysis of Financial Performance: Project Report
VerifiedAdded on 2020/05/16
|42
|13724
|303
Project
AI Summary
This project report presents a critical analysis of corporate financial and operating positions, employing both traditional and contemporary financial analysis methods. It begins with an introduction to financial statements and their importance in business decision-making, covering the statement of financial performance, position, cash flows, and equity changes. The report then delves into traditional methods, including horizontal and vertical analysis, and ratio analysis, evaluating their strengths and limitations. Horizontal analysis assesses financial data over time, while vertical analysis uses a comparative approach. The report also explores contemporary methods such as the Capital Asset Pricing Model (CAPM), the Dividend Growth Model (DGM), and the Efficient Market Hypothesis (EMH). The study examines the financial performance of Tate & Lyle and Wolseley using these methods, offering insights into their profitability, liquidity, solvency, and efficiency. The report concludes by emphasizing the importance of selecting financial evaluation techniques that align with an organization's specific needs and objectives, providing a comprehensive overview of financial analysis methodologies.
Running Head: Strategic Analysis
1
Project Report: Strategic Analysis
1
Project Report: Strategic Analysis
Paraphrase This Document
Need a fresh take? Get an instant paraphrase of this document with our AI Paraphraser
Strategic Analysis
2
Contents
Introduction.................................................................................................................... 3
Critical review of financial analysis’s traditional methods..............................................4
Horizontal analysis......................................................................................................4
Vertical analysis.......................................................................................................... 6
Traditional ratio analysis.............................................................................................8
Contemporary methods of financial analysis................................................................10
Capital asset pricing model.......................................................................................11
Dividend growth model.............................................................................................12
Effective market hypothesis......................................................................................13
Conclusion.....................................................................................................................13
References.................................................................................................................... 15
Appendix....................................................................................................................... 17
Strategic Analysis
3
Introduction:
This report has been described about the critically analyse of the financial and
operating position of corporations which is shepherding by the different traditional and
contemporary methods. Financial statement is apprehended four vital business actions:
Forecasting, Capitalising, funding and operation. To make Effective economic decisions,
financial statement analysis is the effective process by reviewing and analysing financial
statements. Financial statement consists of the statement of financial performance,
statement of financial position, statement of cash flows, and statement of changes in
equity. Financial statement analysis has described a technique or way which involved
identifying the risks, evaluating the performance, financial condition, and forthcoming
predictions of the corporation. Actually, this analysis has been used by the multiplicity of
interested party, as per investors of all categories, the supervision authority, and mainly the
management of the company. Usually, to analyse the financial statements, most popular
two types of method has been used. One is called Traditional Methods and another is
called Contemporary methods. The Most common process for financial statements
analysis is been the practise the numerous of ratios. Mainly, the Ratios are using to
compute the comparative dimensions of the individual amount in kin to a different.
Principally, Ratios are easily compared to the same ratio which is calculated for the
prior period, otherwise established of the average for the industry. It helps to measure
that company is carrying out their activities according the expectations or not. The
ratios change of the figure can take the attention of the commentator. Other method is
to calculation is horizontal and vertical analysis1. Horizontal analysis is judge by the
financial information which is presented sequence of reporting periods. Vertical
analysis has been done of the financial statement analysis followed by the comparative.
It describes like every item of the financial statement is listed as a percentage of
another item. In the contemporary methods, CAPM is very popular for analysis the risk
1 Charles H Gibson. Financial reporting and analysis. South-Western Cengage Learning,
2011.
⊘ This is a preview!⊘
Do you want full access?
Subscribe today to unlock all pages.
Trusted by 1+ million students worldwide
Strategic Analysis
4
effectively. DGM shows that how to grow the company dividends2. It grows the
perpetuity basis or different rates. And the last but not the list is EMH which idea is
partly established by the Eugene Fama in the 1960s.
Critical review of financial analysis’s traditional methods:
Financial analysis could be done through traditional as well as contemporary
methods. Following study explains about the traditional method of the company and its
critical evaluation:
Horizontal analysis:
Horizontal analysis or trend analysis is a financial tool which is used to evaluate a
financial statement data in excess of certain period of time. The purpose of the calculation is
to evaluate the increase or the decrease and mainly used in intra company comparison. The
changes of the amount are easily identified and it is the most advantage in this financial
tools. . But, sometimes difficulties create to do the calculations3. As an example, there is no
value an asset item has in the previous year but value is created in the next year, so the
problem is percentage don’t calculated. On the other hand, the negative figures give the
impression in the previous years and a positive figure exists the following year, but the
percentage change cannot figure. The following is the formula of horizontal analysis:
2 Tony Davies, and Crawford Ian. Business accounting and finance. Pearson, 2011.
3 Charles H Gibson. Financial reporting and analysis. South-Western Cengage Learning,
2011.
Paraphrase This Document
Need a fresh take? Get an instant paraphrase of this document with our AI Paraphraser
Strategic Analysis
5
4
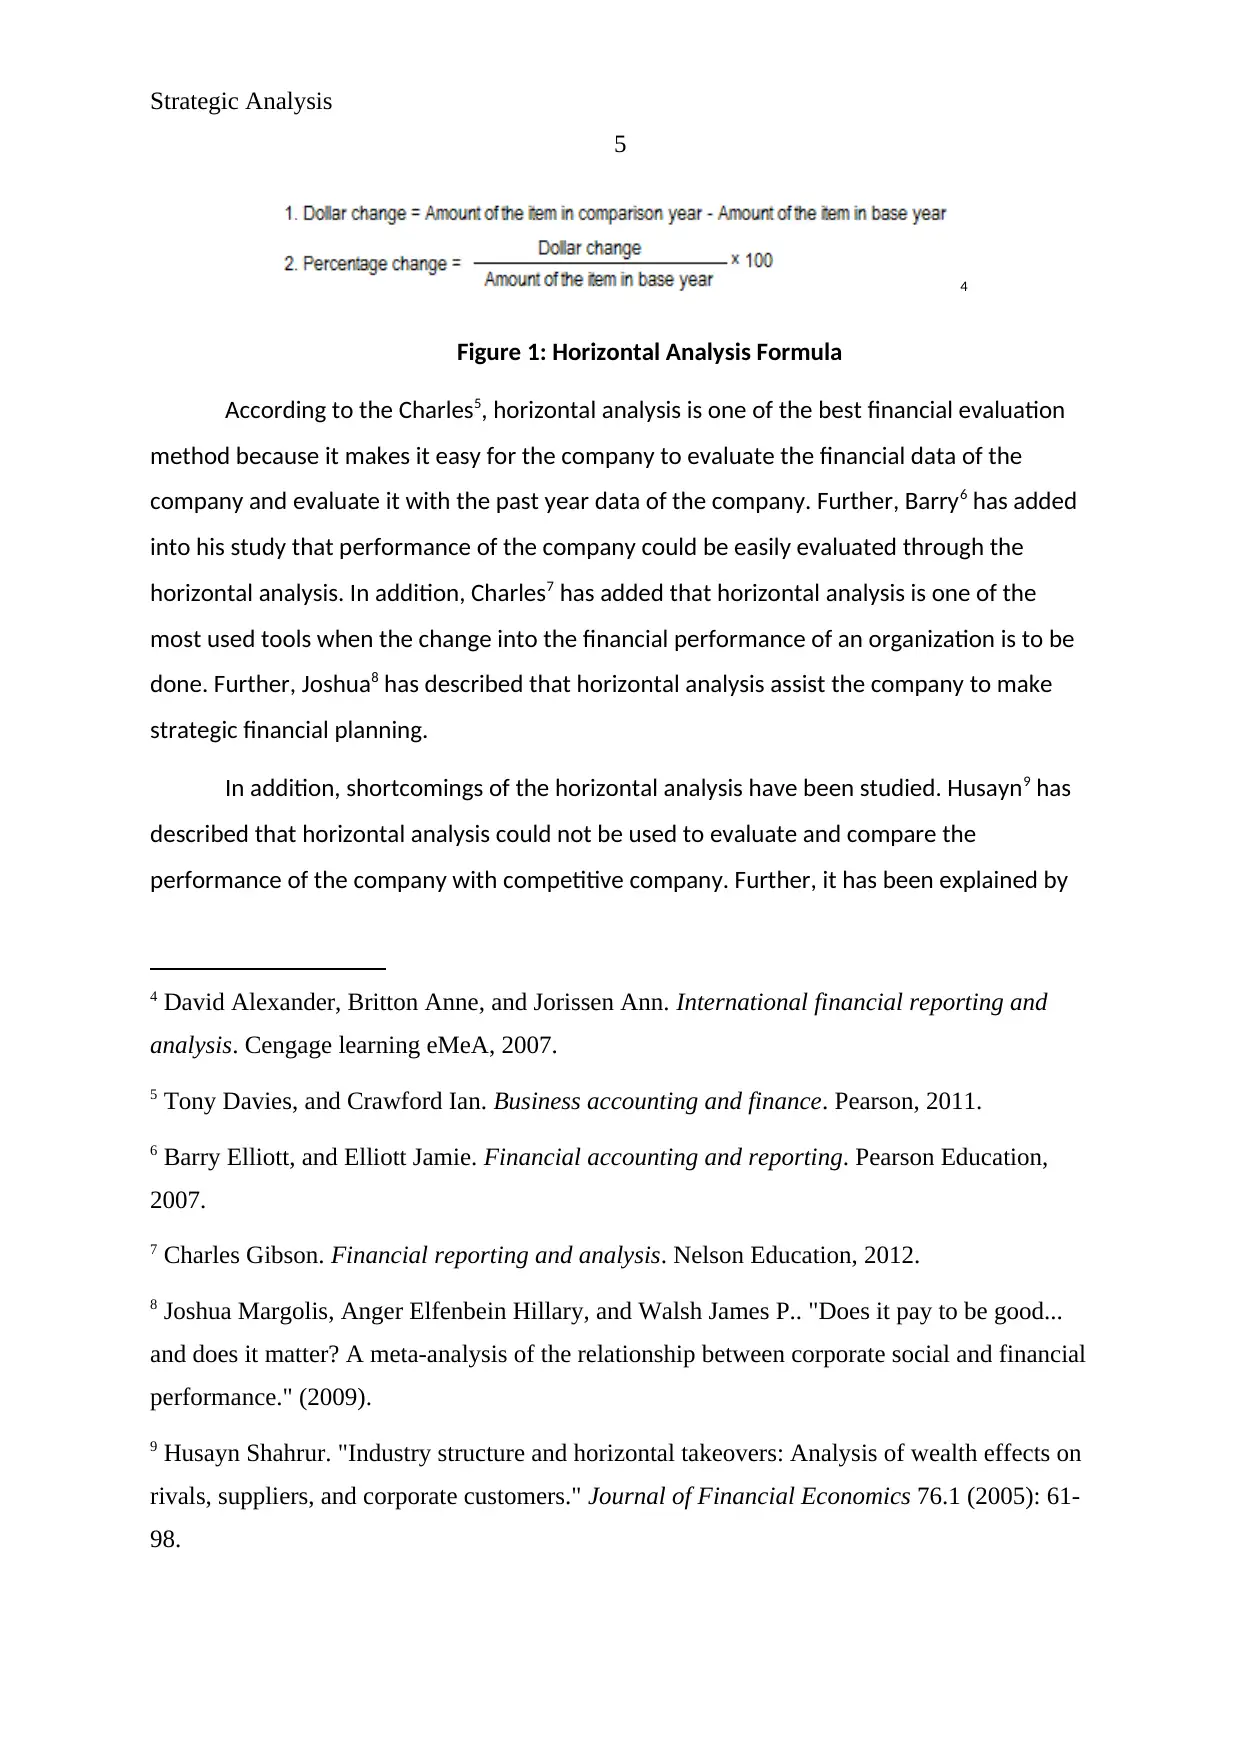
Figure 1: Horizontal Analysis Formula
According to the Charles5, horizontal analysis is one of the best financial evaluation
method because it makes it easy for the company to evaluate the financial data of the
company and evaluate it with the past year data of the company. Further, Barry6 has added
into his study that performance of the company could be easily evaluated through the
horizontal analysis. In addition, Charles7 has added that horizontal analysis is one of the
most used tools when the change into the financial performance of an organization is to be
done. Further, Joshua8 has described that horizontal analysis assist the company to make
strategic financial planning.
In addition, shortcomings of the horizontal analysis have been studied. Husayn9 has
described that horizontal analysis could not be used to evaluate and compare the
performance of the company with competitive company. Further, it has been explained by
4 David Alexander, Britton Anne, and Jorissen Ann. International financial reporting and
analysis. Cengage learning eMeA, 2007.
5 Tony Davies, and Crawford Ian. Business accounting and finance. Pearson, 2011.
6 Barry Elliott, and Elliott Jamie. Financial accounting and reporting. Pearson Education,
2007.
7 Charles Gibson. Financial reporting and analysis. Nelson Education, 2012.
8 Joshua Margolis, Anger Elfenbein Hillary, and Walsh James P.. "Does it pay to be good...
and does it matter? A meta-analysis of the relationship between corporate social and financial
performance." (2009).
9 Husayn Shahrur. "Industry structure and horizontal takeovers: Analysis of wealth effects on
rivals, suppliers, and corporate customers." Journal of Financial Economics 76.1 (2005): 61-
98.
5
4
Figure 1: Horizontal Analysis Formula
According to the Charles5, horizontal analysis is one of the best financial evaluation
method because it makes it easy for the company to evaluate the financial data of the
company and evaluate it with the past year data of the company. Further, Barry6 has added
into his study that performance of the company could be easily evaluated through the
horizontal analysis. In addition, Charles7 has added that horizontal analysis is one of the
most used tools when the change into the financial performance of an organization is to be
done. Further, Joshua8 has described that horizontal analysis assist the company to make
strategic financial planning.
In addition, shortcomings of the horizontal analysis have been studied. Husayn9 has
described that horizontal analysis could not be used to evaluate and compare the
performance of the company with competitive company. Further, it has been explained by
4 David Alexander, Britton Anne, and Jorissen Ann. International financial reporting and
analysis. Cengage learning eMeA, 2007.
5 Tony Davies, and Crawford Ian. Business accounting and finance. Pearson, 2011.
6 Barry Elliott, and Elliott Jamie. Financial accounting and reporting. Pearson Education,
2007.
7 Charles Gibson. Financial reporting and analysis. Nelson Education, 2012.
8 Joshua Margolis, Anger Elfenbein Hillary, and Walsh James P.. "Does it pay to be good...
and does it matter? A meta-analysis of the relationship between corporate social and financial
performance." (2009).
9 Husayn Shahrur. "Industry structure and horizontal takeovers: Analysis of wealth effects on
rivals, suppliers, and corporate customers." Journal of Financial Economics 76.1 (2005): 61-
98.
Strategic Analysis
6
David10 that it is tough to choose the base year for the horizontal analysis study. More, it has
been said that the various assumptions are required to be made for this study.
The study of horizontal analysis has been done on Tate and Lyle & Wolseley and it
has been found that the financial performance of Tate and Lyle plc has been worst in 2016
in comparison of last 5 years. Currently, the gross profit of the company has been lowered
by 5.25% and the net profit of the company has been lowered by 47.25%. Company is
required to focus on this point.
On the other hand, the study of horizontal analysis has been done on Wolseley and it
has been found that the financial performance of Wolseley plc has been better in 2016 in
comparison of last 5 years. Currently, the gross profit of the company has been enhanced by
10.33% and the net profit of the company has been enhanced by 1056.14%. Company is
required to manage the same level.
Vertical analysis:
Vertical analysis is a financial tool which is used to evaluate a financial statement
data in excess of certain period of time. The purpose of the calculation is to evaluate the
competition level of the company in the industry and the changes into the financial
performance of the company from last year11. The changes of the amount are easily
identified and it is the most advantage in this financial tools. . But, sometimes difficulties
create to do the calculations. As an example, there is an expense which has not been
occurred in a company but has taken place into other company, so the problem occurs while
evaluating the data. The following is the formula of vertical analysis:
10 David Alexander, Britton Anne, and Jorissen Ann. International financial reporting and
analysis. Cengage learning eMeA, 2007.
11 Charles H Gibson. Financial reporting and analysis. South-Western Cengage Learning,
2011.
⊘ This is a preview!⊘
Do you want full access?
Subscribe today to unlock all pages.
Trusted by 1+ million students worldwide
Strategic Analysis
7
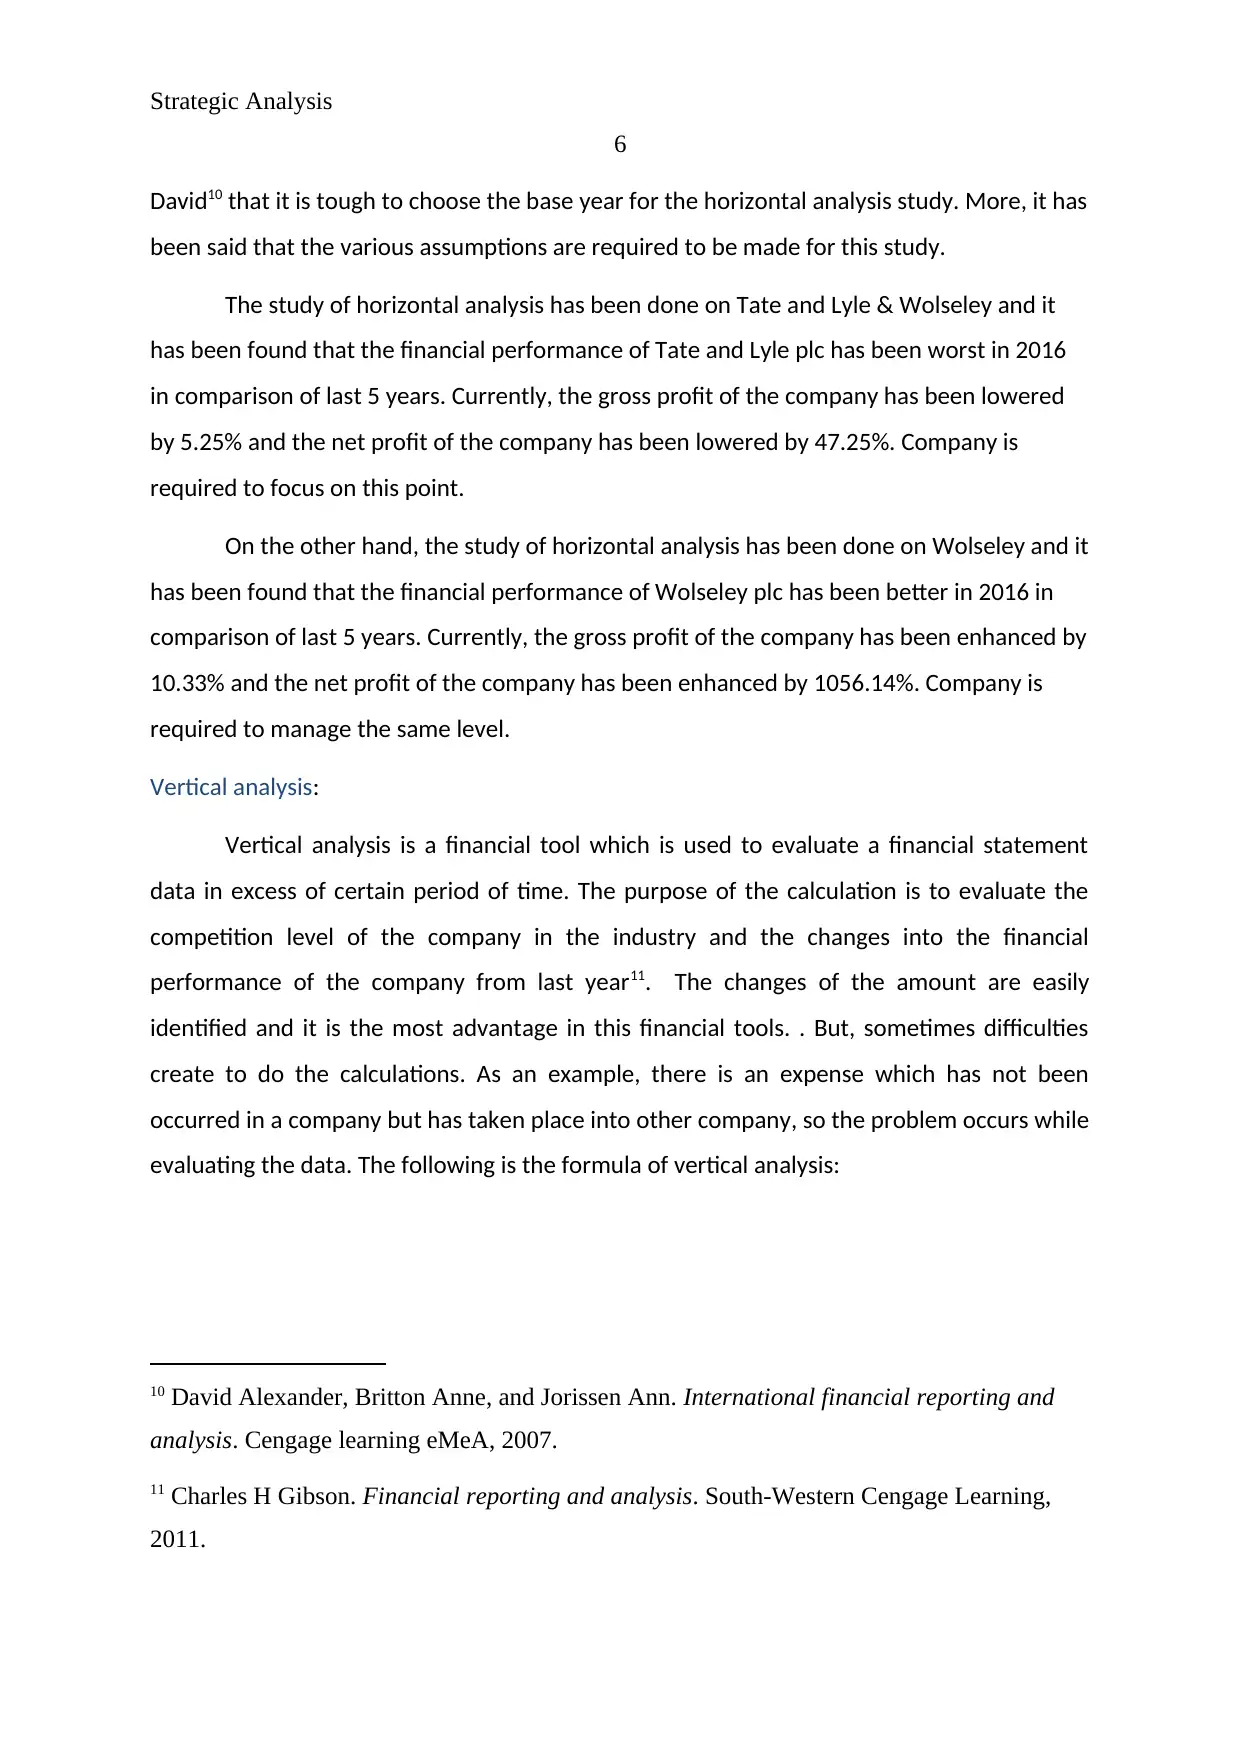
12
Figure 2: Formula of vertical analysis
According to the Mario13, vertical analysis is one of the most used financial
evaluation method by professionals because it makes it easy for the company to evaluate
the financial data of the company and evaluate it with the competitive company’s data of
the company. Further, Tobias14 has added into his study that performance of the company
and its financial performance in the industry could be easily evaluated through the vertical
analysis. In addition, vertical analysis is one of the most used tools when the change into the
financial performance of an organization is to be done in context with the competitive
companies. Further, it has described that vertical analysis assist the company to make
strategic financial planning15.
In addition, shortcomings of the vertical analysis have been studied. It has described
that vertical analysis could not be used to evaluate and compare the performance of the
company with past year data16. Further, it has been explained that it is tough to choose the
12 Robert M Grant. Contemporary strategy analysis: Text and cases edition. John Wiley &
Sons, 2016.
13 Mario C Deng. "Mechanical circulatory support device database of the International
Society for Heart and Lung Transplantation: third annual report—2005." The Journal of heart
and lung transplantation 24.9 (2005): 1182-1187.
14 Tobias Adrian, and Shin Hyun Song. "Liquidity and financial cycles." (2008).
15 Barry Elliott, and Elliott Jamie. Financial accounting and reporting. Pearson Education,
2007.
16 Shiguo Wang. "A comprehensive survey of data mining-based accounting-fraud detection
research." Intelligent Computation Technology and Automation (ICICTA), 2010 International
Conference on. Vol. 1. IEEE, 2010.
7
12
Figure 2: Formula of vertical analysis
According to the Mario13, vertical analysis is one of the most used financial
evaluation method by professionals because it makes it easy for the company to evaluate
the financial data of the company and evaluate it with the competitive company’s data of
the company. Further, Tobias14 has added into his study that performance of the company
and its financial performance in the industry could be easily evaluated through the vertical
analysis. In addition, vertical analysis is one of the most used tools when the change into the
financial performance of an organization is to be done in context with the competitive
companies. Further, it has described that vertical analysis assist the company to make
strategic financial planning15.
In addition, shortcomings of the vertical analysis have been studied. It has described
that vertical analysis could not be used to evaluate and compare the performance of the
company with past year data16. Further, it has been explained that it is tough to choose the
12 Robert M Grant. Contemporary strategy analysis: Text and cases edition. John Wiley &
Sons, 2016.
13 Mario C Deng. "Mechanical circulatory support device database of the International
Society for Heart and Lung Transplantation: third annual report—2005." The Journal of heart
and lung transplantation 24.9 (2005): 1182-1187.
14 Tobias Adrian, and Shin Hyun Song. "Liquidity and financial cycles." (2008).
15 Barry Elliott, and Elliott Jamie. Financial accounting and reporting. Pearson Education,
2007.
16 Shiguo Wang. "A comprehensive survey of data mining-based accounting-fraud detection
research." Intelligent Computation Technology and Automation (ICICTA), 2010 International
Conference on. Vol. 1. IEEE, 2010.
Paraphrase This Document
Need a fresh take? Get an instant paraphrase of this document with our AI Paraphraser
Strategic Analysis
8
competition company as the operations are quite different of each company. More, it has
been said that the various assumptions are required to be made for this study17.
The study of vertical analysis has been done on Tate and Lyle & Wolseley and it has
been found that the financial performance, income and expenses have not been managed
by the company in a better way. The gross profit and net profit of the company has been
lesser in comparison with last year’s data. Further, the balance sheet of the company
explains about the negative changes into the current assets, total debts etc of the company.
On the other hand, the study of vertical analysis has been done on Wolseley and it
has been found that the financial performance, income and expenses have been managed
by the company in a better way. The gross profit and net profit of the company has been
better in last year’s data. Further, the balance sheet of the company explains about the
positive changes into the total assets, liabilities and equity of the company.
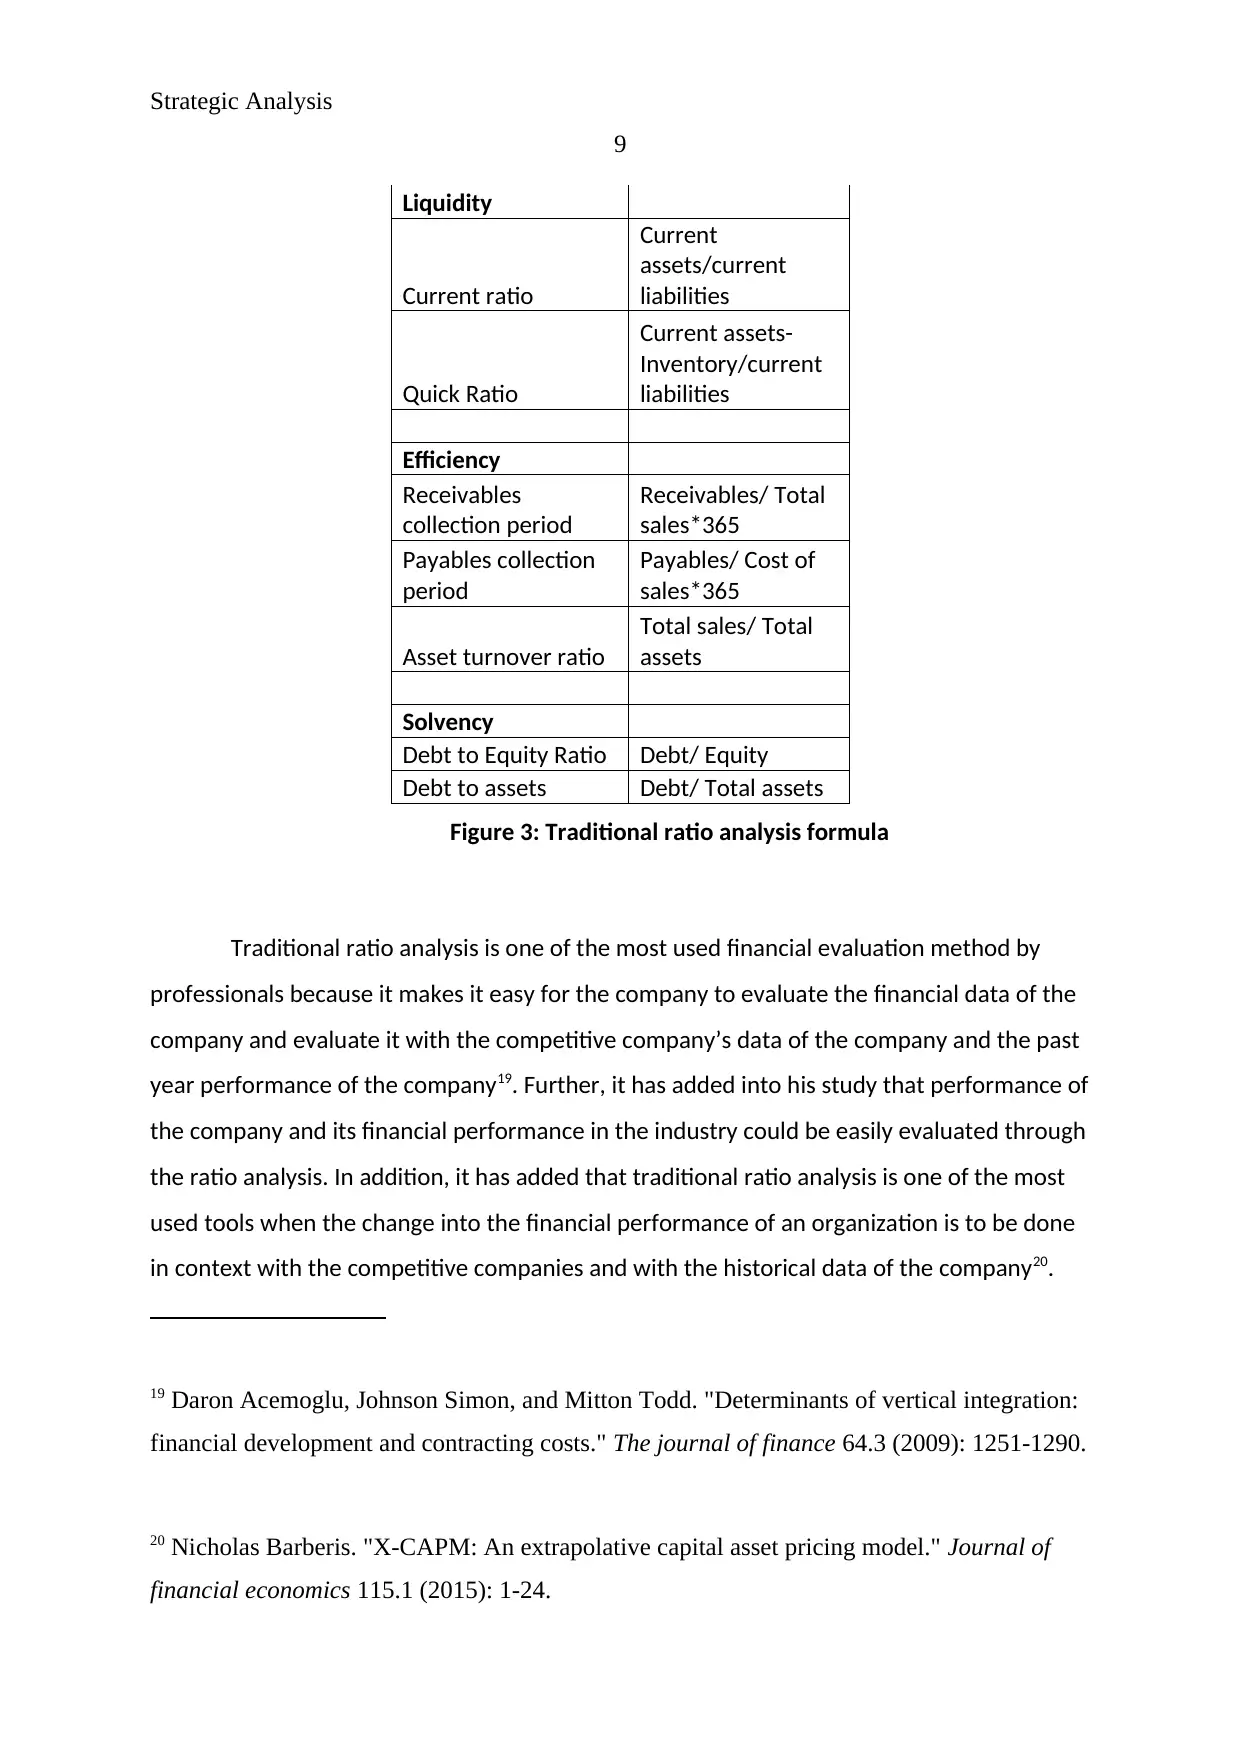
Traditional ratio analysis:
Traditional ratio analysis is a financial tool which is used to evaluate a financial
statement data in terms of other financial figures of the company. The purpose of the
calculation is to evaluate the competition, liquidity, stability, profitability etc level of the
company in the industry and the changes into the financial performance of the company
from last year. The changes of the amount could be easily identified through this tool. But,
sometimes difficulties create to do the calculations. The following is the formula of few parts
of traditional ratio analysis:
Profitability
Net margin
Net
profit/revenues
Return on equity Net profit/Equity18
17 Mario C Deng. "Mechanical circulatory support device database of the International
Society for Heart and Lung Transplantation: third annual report—2005." The Journal of heart
and lung transplantation 24.9 (2005): 1182-1187.
18 Tobias Adrian, and Shin Hyun Song. "Liquidity and financial cycles." (2008).
8
competition company as the operations are quite different of each company. More, it has
been said that the various assumptions are required to be made for this study17.
The study of vertical analysis has been done on Tate and Lyle & Wolseley and it has
been found that the financial performance, income and expenses have not been managed
by the company in a better way. The gross profit and net profit of the company has been
lesser in comparison with last year’s data. Further, the balance sheet of the company
explains about the negative changes into the current assets, total debts etc of the company.
On the other hand, the study of vertical analysis has been done on Wolseley and it
has been found that the financial performance, income and expenses have been managed
by the company in a better way. The gross profit and net profit of the company has been
better in last year’s data. Further, the balance sheet of the company explains about the
positive changes into the total assets, liabilities and equity of the company.
Traditional ratio analysis:
Traditional ratio analysis is a financial tool which is used to evaluate a financial
statement data in terms of other financial figures of the company. The purpose of the
calculation is to evaluate the competition, liquidity, stability, profitability etc level of the
company in the industry and the changes into the financial performance of the company
from last year. The changes of the amount could be easily identified through this tool. But,
sometimes difficulties create to do the calculations. The following is the formula of few parts
of traditional ratio analysis:
Profitability
Net margin
Net
profit/revenues
Return on equity Net profit/Equity18
17 Mario C Deng. "Mechanical circulatory support device database of the International
Society for Heart and Lung Transplantation: third annual report—2005." The Journal of heart
and lung transplantation 24.9 (2005): 1182-1187.
18 Tobias Adrian, and Shin Hyun Song. "Liquidity and financial cycles." (2008).
Strategic Analysis
9
Liquidity
Current ratio
Current
assets/current
liabilities
Quick Ratio
Current assets-
Inventory/current
liabilities
Efficiency
Receivables
collection period
Receivables/ Total
sales*365
Payables collection
period
Payables/ Cost of
sales*365
Asset turnover ratio
Total sales/ Total
assets
Solvency
Debt to Equity Ratio Debt/ Equity
Debt to assets Debt/ Total assets
Figure 3: Traditional ratio analysis formula
Traditional ratio analysis is one of the most used financial evaluation method by
professionals because it makes it easy for the company to evaluate the financial data of the
company and evaluate it with the competitive company’s data of the company and the past
year performance of the company19. Further, it has added into his study that performance of
the company and its financial performance in the industry could be easily evaluated through
the ratio analysis. In addition, it has added that traditional ratio analysis is one of the most
used tools when the change into the financial performance of an organization is to be done
in context with the competitive companies and with the historical data of the company20.
19 Daron Acemoglu, Johnson Simon, and Mitton Todd. "Determinants of vertical integration:
financial development and contracting costs." The journal of finance 64.3 (2009): 1251-1290.
20 Nicholas Barberis. "X-CAPM: An extrapolative capital asset pricing model." Journal of
financial economics 115.1 (2015): 1-24.
⊘ This is a preview!⊘
Do you want full access?
Subscribe today to unlock all pages.
Trusted by 1+ million students worldwide
Strategic Analysis
10
Further, it has described that traditional ratio analysis assist the company to make strategic
financial planning.
In addition, shortcomings of the ratio analysis have been studied. It has described
that ratio analysis study is based on various assumptions. Further, it has been explained that
it is tough to compare the data with the competitive companies21. Further, the different
level of ratios is set by the company according to its nature and policies22.
The study of traditional ratio analysis has been done on Tate and Lyle and it has been
found that the profitability level, liquidity level, solvency level and efficiency level have been
managed by the company in a better way. The profitability level of the company is
impressive on the other hand, liquidity position explains to reduce the level of current
assets. Further, the efficiency and solvency of the company explains about the good position
of the company.
On the other hand, the study of traditional ratio analysis has been done on Wolseley
and it has been found that the profitability level, liquidity level, solvency level and efficiency
level have been managed by the company in a better way. The profitability level of the
company is quite impressive. On the other hand, liquidity position explains to reduce the
level of current assets. Further, the efficiency and solvency of the company explains about
the few changes into the policies and capital structure of the company.
The above study of traditional method of financial evaluation technique expresses
that all the techniques have some pros as well as some cons. An organization should choose
the financial evaluation technique according to its nature, needs and objectives.
Contemporary methods of financial analysis:
21 Daron Acemoglu, Johnson Simon, and Mitton Todd. "Determinants of vertical integration:
financial development and contracting costs." The journal of finance 64.3 (2009): 1251-1290.
22 Eugene F Fama, and French Kenneth R.. "The value premium and the CAPM." The
Journal of Finance 61.5 (2006): 2163-2185.
Paraphrase This Document
Need a fresh take? Get an instant paraphrase of this document with our AI Paraphraser
Strategic Analysis
11
Financial analysis could be done through traditional as well as contemporary
methods. Following study explains about the contemporary method of the company and its
critical evaluation:
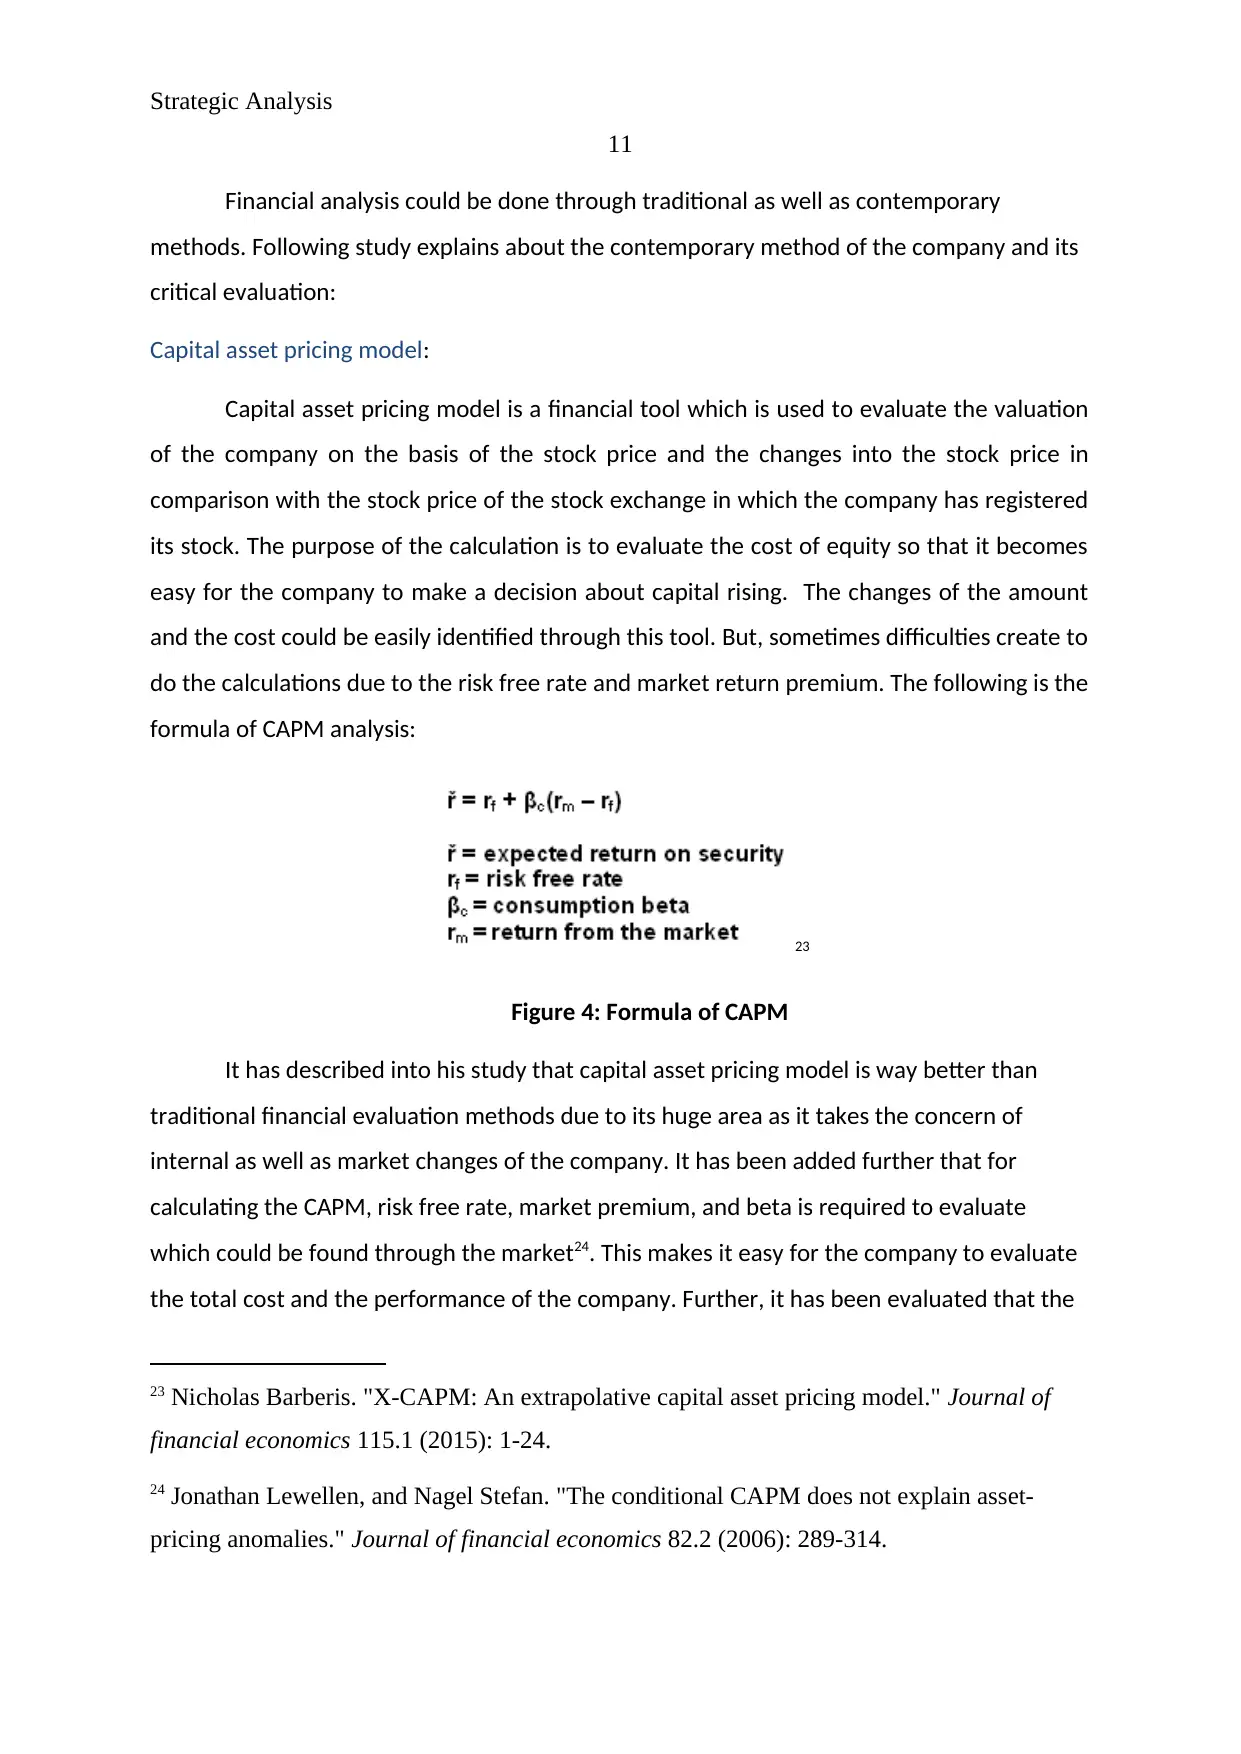
Capital asset pricing model:
Capital asset pricing model is a financial tool which is used to evaluate the valuation
of the company on the basis of the stock price and the changes into the stock price in
comparison with the stock price of the stock exchange in which the company has registered
its stock. The purpose of the calculation is to evaluate the cost of equity so that it becomes
easy for the company to make a decision about capital rising. The changes of the amount
and the cost could be easily identified through this tool. But, sometimes difficulties create to
do the calculations due to the risk free rate and market return premium. The following is the
formula of CAPM analysis:
23
Figure 4: Formula of CAPM
It has described into his study that capital asset pricing model is way better than
traditional financial evaluation methods due to its huge area as it takes the concern of
internal as well as market changes of the company. It has been added further that for
calculating the CAPM, risk free rate, market premium, and beta is required to evaluate
which could be found through the market24. This makes it easy for the company to evaluate
the total cost and the performance of the company. Further, it has been evaluated that the
23 Nicholas Barberis. "X-CAPM: An extrapolative capital asset pricing model." Journal of
financial economics 115.1 (2015): 1-24.
24 Jonathan Lewellen, and Nagel Stefan. "The conditional CAPM does not explain asset-
pricing anomalies." Journal of financial economics 82.2 (2006): 289-314.
11
Financial analysis could be done through traditional as well as contemporary
methods. Following study explains about the contemporary method of the company and its
critical evaluation:
Capital asset pricing model:
Capital asset pricing model is a financial tool which is used to evaluate the valuation
of the company on the basis of the stock price and the changes into the stock price in
comparison with the stock price of the stock exchange in which the company has registered
its stock. The purpose of the calculation is to evaluate the cost of equity so that it becomes
easy for the company to make a decision about capital rising. The changes of the amount
and the cost could be easily identified through this tool. But, sometimes difficulties create to
do the calculations due to the risk free rate and market return premium. The following is the
formula of CAPM analysis:
23
Figure 4: Formula of CAPM
It has described into his study that capital asset pricing model is way better than
traditional financial evaluation methods due to its huge area as it takes the concern of
internal as well as market changes of the company. It has been added further that for
calculating the CAPM, risk free rate, market premium, and beta is required to evaluate
which could be found through the market24. This makes it easy for the company to evaluate
the total cost and the performance of the company. Further, it has been evaluated that the
23 Nicholas Barberis. "X-CAPM: An extrapolative capital asset pricing model." Journal of
financial economics 115.1 (2015): 1-24.
24 Jonathan Lewellen, and Nagel Stefan. "The conditional CAPM does not explain asset-
pricing anomalies." Journal of financial economics 82.2 (2006): 289-314.
Strategic Analysis
12
CAPM does not based on the assumptions25. Always real values are taken to evaluate the
performance and the required rate of return of the company. Further, on the basis of
required rate of return, it becomes easy for the investors to make a decision about the
investment or divestment from the stock of the company26. Thus it could be said that this
option is way better than traditional methods of financial analysis.
Dividend growth model:
Dividend growth model is a financial tool which is used to evaluate the valuation of
the stock price of the company and the changes into the stock price (face value and market
value). This model could be conducted through the help of dividend payment, dividend
growth rate and the cost of equity. The purpose of the calculation is to evaluate the value of
the shares so that it becomes easy for the investors to make a decision about investment in
the company. The changes of the amount and the value of shares could be easily identified
through this tool. But, sometimes difficulties create to do the calculations due to the growth
%. The following is the formula of dividend growth model analysis:
Gordon Growth Model: stock price = (dividend payment in the next period) / (cost
of equity - dividend growth rate) 27
It has described into his study that dividend growth model is way better than
traditional financial evaluation methods due to its huge area as it takes the concern of
internal as well as market changes of the company28. It has been added further that for
calculating the DGM, dividend payment, growth rate, and cost of equity is required to
evaluate which could be found through the market. This makes it easy for the investors to
25 Eugene F Fama, and French Kenneth R.. "The value premium and the CAPM." The
Journal of Finance 61.5 (2006): 2163-2185.
26 Roelinka Broekhuizen. "Optimizing oral nutritional drink supplementation in patients with
chronic obstructive pulmonary disease." British journal of nutrition 93.6 (2005): 965-971.
27 E. F. M. Wouters et al. "Airway biology." Thorax 60.6 (2005): 480-487.
28 Paul Barnes. "Dividend Growth Model." Wiley Encyclopedia of Management. 2009.
⊘ This is a preview!⊘
Do you want full access?
Subscribe today to unlock all pages.
Trusted by 1+ million students worldwide
1 out of 42
Related Documents


Your All-in-One AI-Powered Toolkit for Academic Success.
+13062052269
info@desklib.com
Available 24*7 on WhatsApp / Email
![[object Object]](/_next/static/media/star-bottom.7253800d.svg)
Unlock your academic potential
Copyright © 2020–2026 A2Z Services. All Rights Reserved. Developed and managed by ZUCOL.