JCU Accounting: Comparative Financial Performance Analysis Report
VerifiedAdded on 2020/05/28
|30
|6845
|89
Report
AI Summary
This report undertakes a comparative financial performance analysis of Site Group International Ltd and National Storage Australia. The analysis employs various financial ratios, including profitability ratios (gross profit margin, net profit margin, return on equity), asset efficiency ratios (asset turnover, inventory turnover, receivables turnover), liquidity ratios (current ratio, quick ratio, cash flow ratio), and capital structure ratios (gearing, debt ratio, equity ratio), to assess the financial health of both companies. The report also includes horizontal and vertical analyses of the income statement and balance sheet. The findings reveal insights into the companies' performance, highlighting strengths and weaknesses in areas such as profitability, asset management, liquidity, and capital structure. National Storage Australia demonstrates better profitability and liquidity, while Site Group International shows strengths in asset turnover but struggles with receivables turnover. The report concludes with recommendations for improvement and acknowledges the limitations of ratio analysis.
Running head: ACCOUNTING FOR DECISION MAKING
INDIVIDUAL TASK COVER SHEET
Student
Please sign, date and attach cover sheet to front of assessment task
for all hard copy submissions
SUBJECT CODE
STUDENT FAMILY NAME Student Given Name JCU Student Number
ASSESSMENT TITLE
DUE DATE
LECTURER NAME
TUTOR NAME
Student Declaration
1. This assignment is my original work and no part has been copied/ reproduced from any other person’s work or from any
other source, except where acknowledgement has been made (see Learning, Teaching and Assessment Policy 5.1).
2. This work has not been submitted for any other course/subject (see Learning, Teaching and Assessment Policy 5.9).
3. This assignment has not been written for me.
4. I hold a copy of this assignment and can produce a copy if requested.
5. This work may be used for the purposes of moderation and identifying plagiarism.
6. I give permission for a copy of this marked assignment to be retained by the College for benchmarking and course review and
accreditation purposes.
Learning, Teaching and Assessment Policy 5.1. A student who submits work containing plagiarised material
for assessment will be subject to the provisions of the Student Academic Misconduct Requirements.
Note definition of plagiarism and self plagiarism in Learning, Teaching and Assessment Policy:
Plagiarism: reproduction without acknowledgement of another person’s words, work or expressed thoughts from any
source. The definition of words, works and thoughts includes such representations as diagrams, drawings, sketches,
pictures, objects, text, lecture hand-outs, artistic works and other such expressions of ideas, but hereafter the term
‘work’ is used to embrace all of these. Plagiarism comprises not only direct copying of aspects of another person’s
work but also the reproduction, even if slightly rewritten or adapted, of someone else’s ideas. In both cases, someone
else’s work is presented as the student’s own. Under the Australian Copyright Act 1968 a copyright owner can take
legal action in the courts against a party who has infringed their copyright.
Self Plagiarism: the use of one’s own previously assessed material being resubmitted without acknowledgement or
citing of the original.
Student Signature
…………………………………………………… Submission date ……../……../……..
Paraphrase This Document
Need a fresh take? Get an instant paraphrase of this document with our AI Paraphraser
1ACCOUNTING FOR DECISION MAKING
Table of Contents
Content Development & Analysis:............................................................................................4
Introduction:...............................................................................................................................4
Data Manipulation & Presentation:............................................................................................4
Comparative ratio analysis:........................................................................................................4
Profitability analysis:.................................................................................................................4
Asset efficiency Analysis:..........................................................................................................5
Liquidity Analysis:.....................................................................................................................6
Capital Structure ratios (Gearing):.............................................................................................7
Limitations:................................................................................................................................7
Conclusion & Recommendations...............................................................................................8
Conclusion:................................................................................................................................8
Recommendations:.....................................................................................................................9
Reference List:.........................................................................................................................10
Appendix:.................................................................................................................................11
Ratios:......................................................................................................................................11
Site Group International:..........................................................................................................11
National Storage Australia:......................................................................................................13
Horizontal analysis of income statement:................................................................................16
Horizontal Income Statement Analysis:...................................................................................19
National Storage Australia:......................................................................................................19
Horizontal analysis of balance sheet:.......................................................................................22
Vertical analysis of income statement: Site Group International Ltd......................................25
Vertical analysis of balance sheet: Site Group International Ltd.............................................27

2ACCOUNTING FOR DECISION MAKING
⊘ This is a preview!⊘
Do you want full access?
Subscribe today to unlock all pages.
Trusted by 1+ million students worldwide
3ACCOUNTING FOR DECISION MAKING
Content Development & Analysis:
Introduction:
The current report is based on the assessing the financial performance of the two
companies namely the Site Group International Ltd and National Storage Australia. The
primary reason for considering the ratio is to determine the overall performance of both the
organization. The profitability ratio, liquidity ratios, asset efficiency ratio and capital
structure ratio will be calculated along with the horizontal and vertical analysis will be carried
out to summarize the overall conditions of the organizations. The report will be evidently
putting forward the profit and loss situations to express the present state of affairs.
National storage Australia is considered as one of the leading self-storage providers of
Australian and New Zealand having more than 110 centres offering solutions of storage to
more than 35,000 residential and commercial customers throughout both the nations
(nationalstorage.com.au, 2018). During the year 2013 the national storage Australia was
listed on the Australian stock exchange and the company was better known as Storage Reit.
On the other hand, the site group international limited offers training, education and
workforce services to the government, corporate and individual clients in Australia and
across the world (site.edu.au, 2018). The company functions in a segmental manner and
assess candidates in the areas of mining, processing, etc through the site institute.
Data Manipulation & Presentation:
Comparative ratio analysis:
Profitability analysis:
The profitability ratio helps in measuring the overall profitability situation of the
organization for a certain period (Williams, 2014). The profitability ratio is based on the
assessment of the gross profit margin, net profit margin and return on equity. An organization
profitability situation or the in sufficient liquidity helps in determining whether the firm can
obtain sufficient amount of debt and equity t finance its business and maintain the position of
liquidity. The return on equity represents the measurement of the profitability, which
determines the amount of profit generated from one unit of equity. The return on equity helps
in reflecting every dollar of sales represented by its profit and the same is computed by
Paraphrase This Document
Need a fresh take? Get an instant paraphrase of this document with our AI Paraphraser
4ACCOUNTING FOR DECISION MAKING
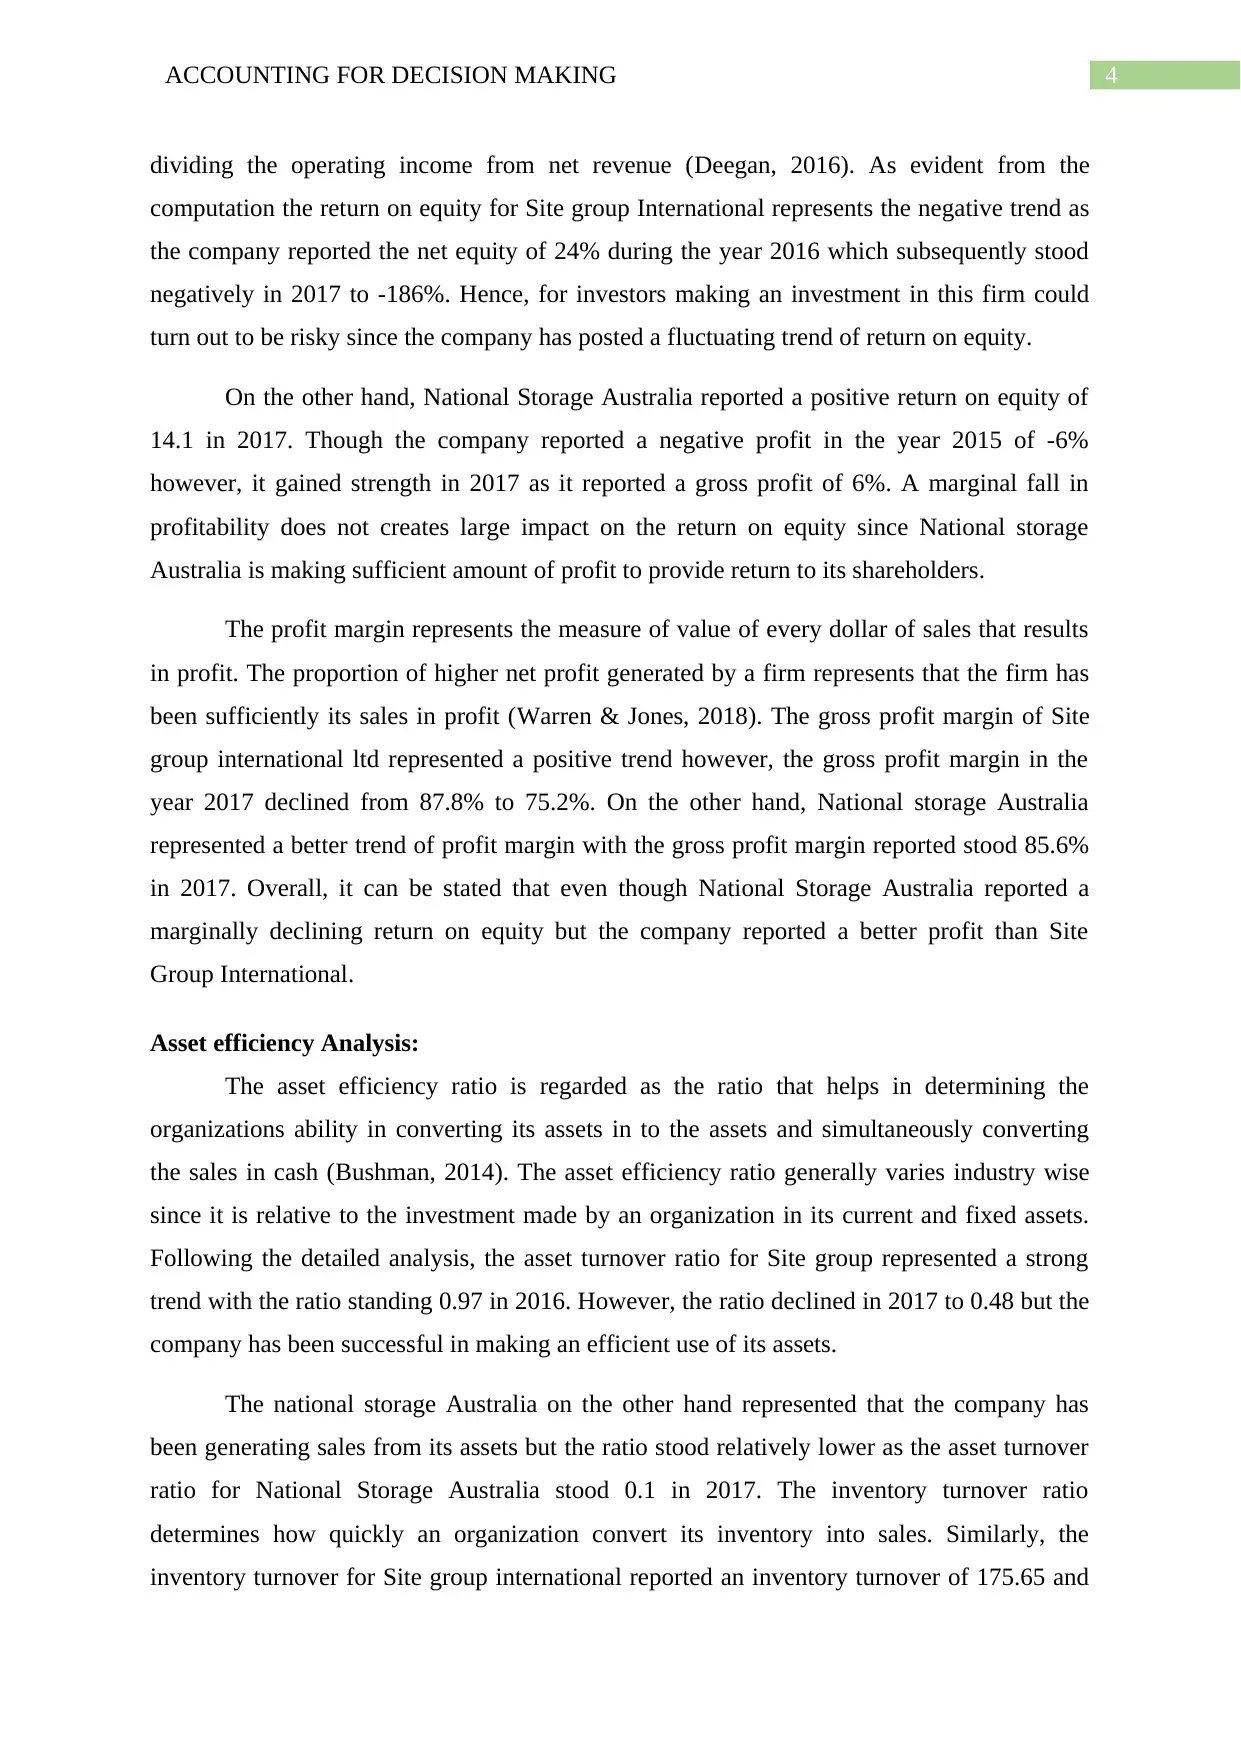
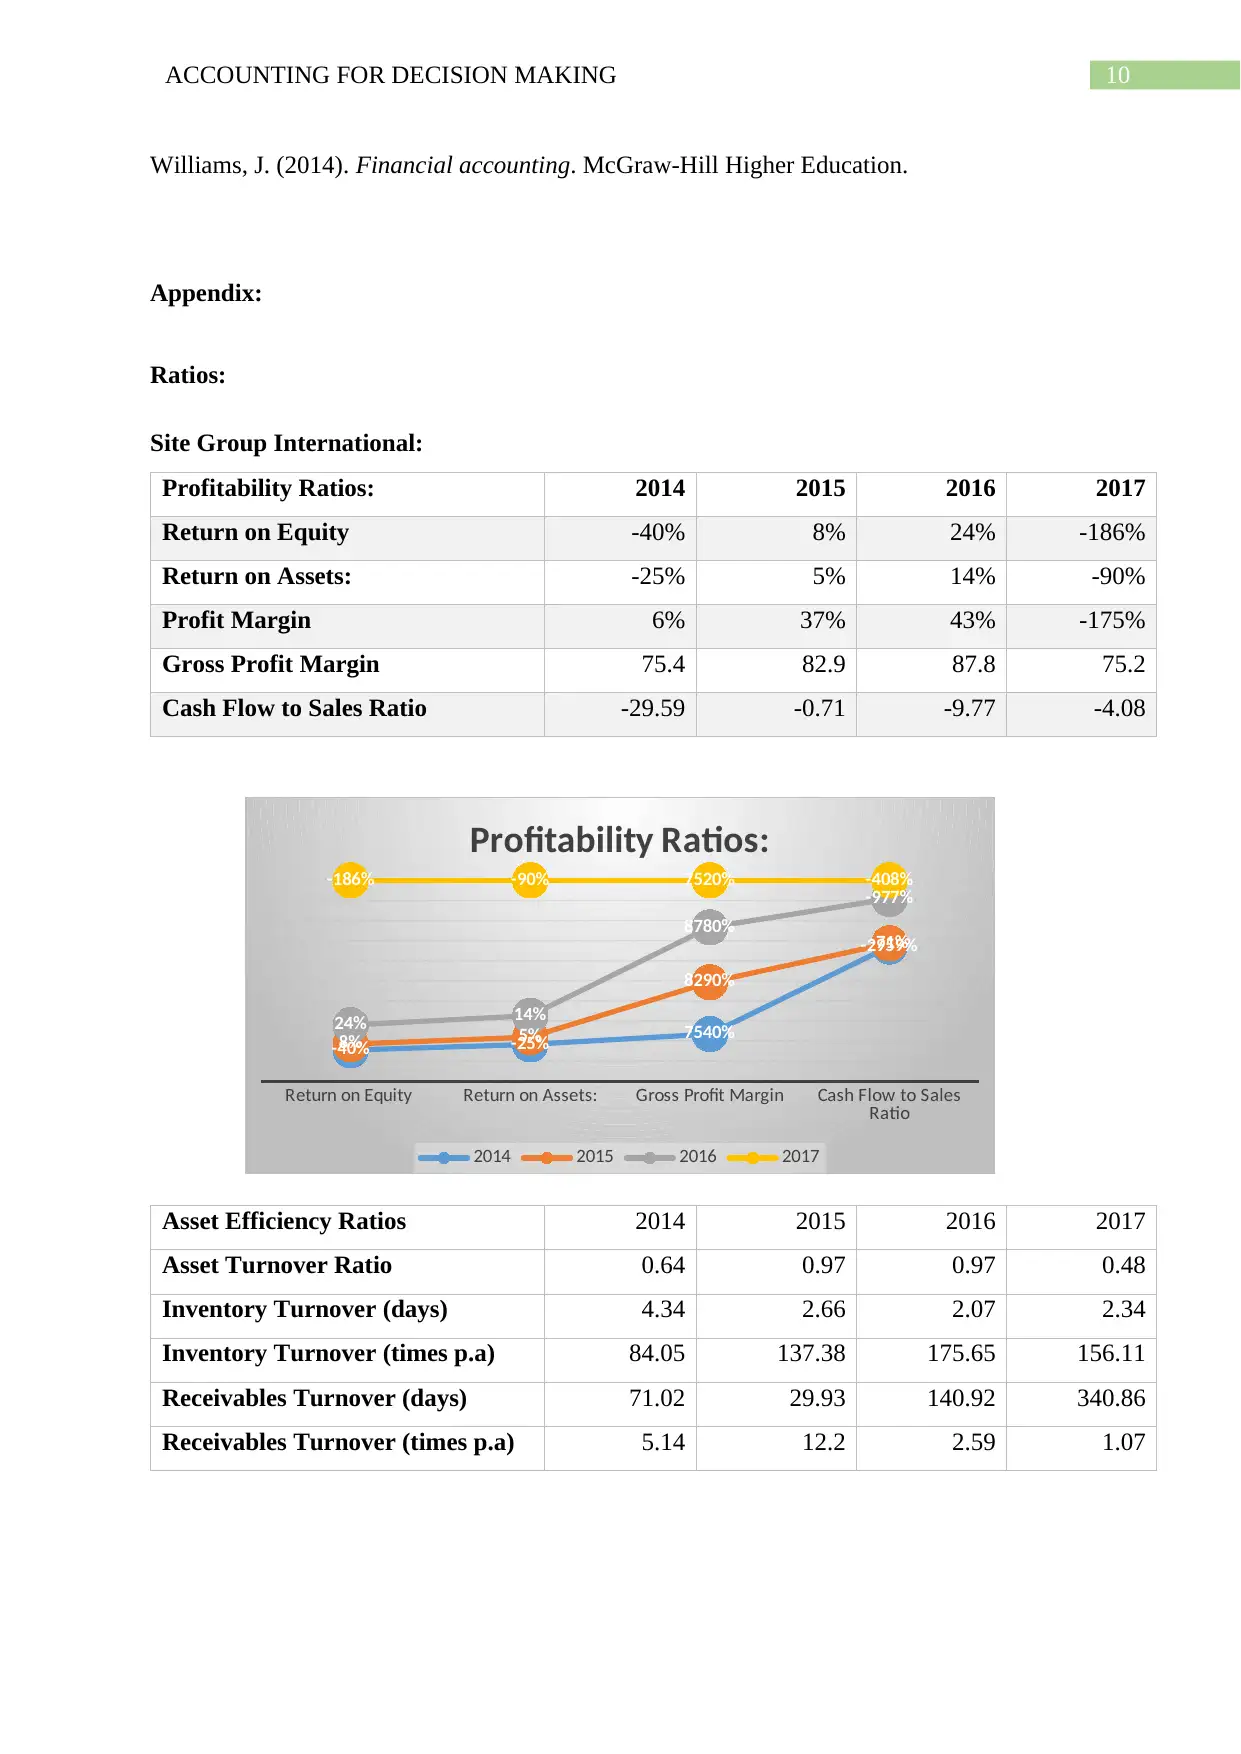
dividing the operating income from net revenue (Deegan, 2016). As evident from the
computation the return on equity for Site group International represents the negative trend as
the company reported the net equity of 24% during the year 2016 which subsequently stood
negatively in 2017 to -186%. Hence, for investors making an investment in this firm could
turn out to be risky since the company has posted a fluctuating trend of return on equity.
On the other hand, National Storage Australia reported a positive return on equity of
14.1 in 2017. Though the company reported a negative profit in the year 2015 of -6%
however, it gained strength in 2017 as it reported a gross profit of 6%. A marginal fall in
profitability does not creates large impact on the return on equity since National storage
Australia is making sufficient amount of profit to provide return to its shareholders.
The profit margin represents the measure of value of every dollar of sales that results
in profit. The proportion of higher net profit generated by a firm represents that the firm has
been sufficiently its sales in profit (Warren & Jones, 2018). The gross profit margin of Site
group international ltd represented a positive trend however, the gross profit margin in the
year 2017 declined from 87.8% to 75.2%. On the other hand, National storage Australia
represented a better trend of profit margin with the gross profit margin reported stood 85.6%
in 2017. Overall, it can be stated that even though National Storage Australia reported a
marginally declining return on equity but the company reported a better profit than Site
Group International.
Asset efficiency Analysis:
The asset efficiency ratio is regarded as the ratio that helps in determining the
organizations ability in converting its assets in to the assets and simultaneously converting
the sales in cash (Bushman, 2014). The asset efficiency ratio generally varies industry wise
since it is relative to the investment made by an organization in its current and fixed assets.
Following the detailed analysis, the asset turnover ratio for Site group represented a strong
trend with the ratio standing 0.97 in 2016. However, the ratio declined in 2017 to 0.48 but the
company has been successful in making an efficient use of its assets.
The national storage Australia on the other hand represented that the company has
been generating sales from its assets but the ratio stood relatively lower as the asset turnover
ratio for National Storage Australia stood 0.1 in 2017. The inventory turnover ratio
determines how quickly an organization convert its inventory into sales. Similarly, the
inventory turnover for Site group international reported an inventory turnover of 175.65 and
5ACCOUNTING FOR DECISION MAKING
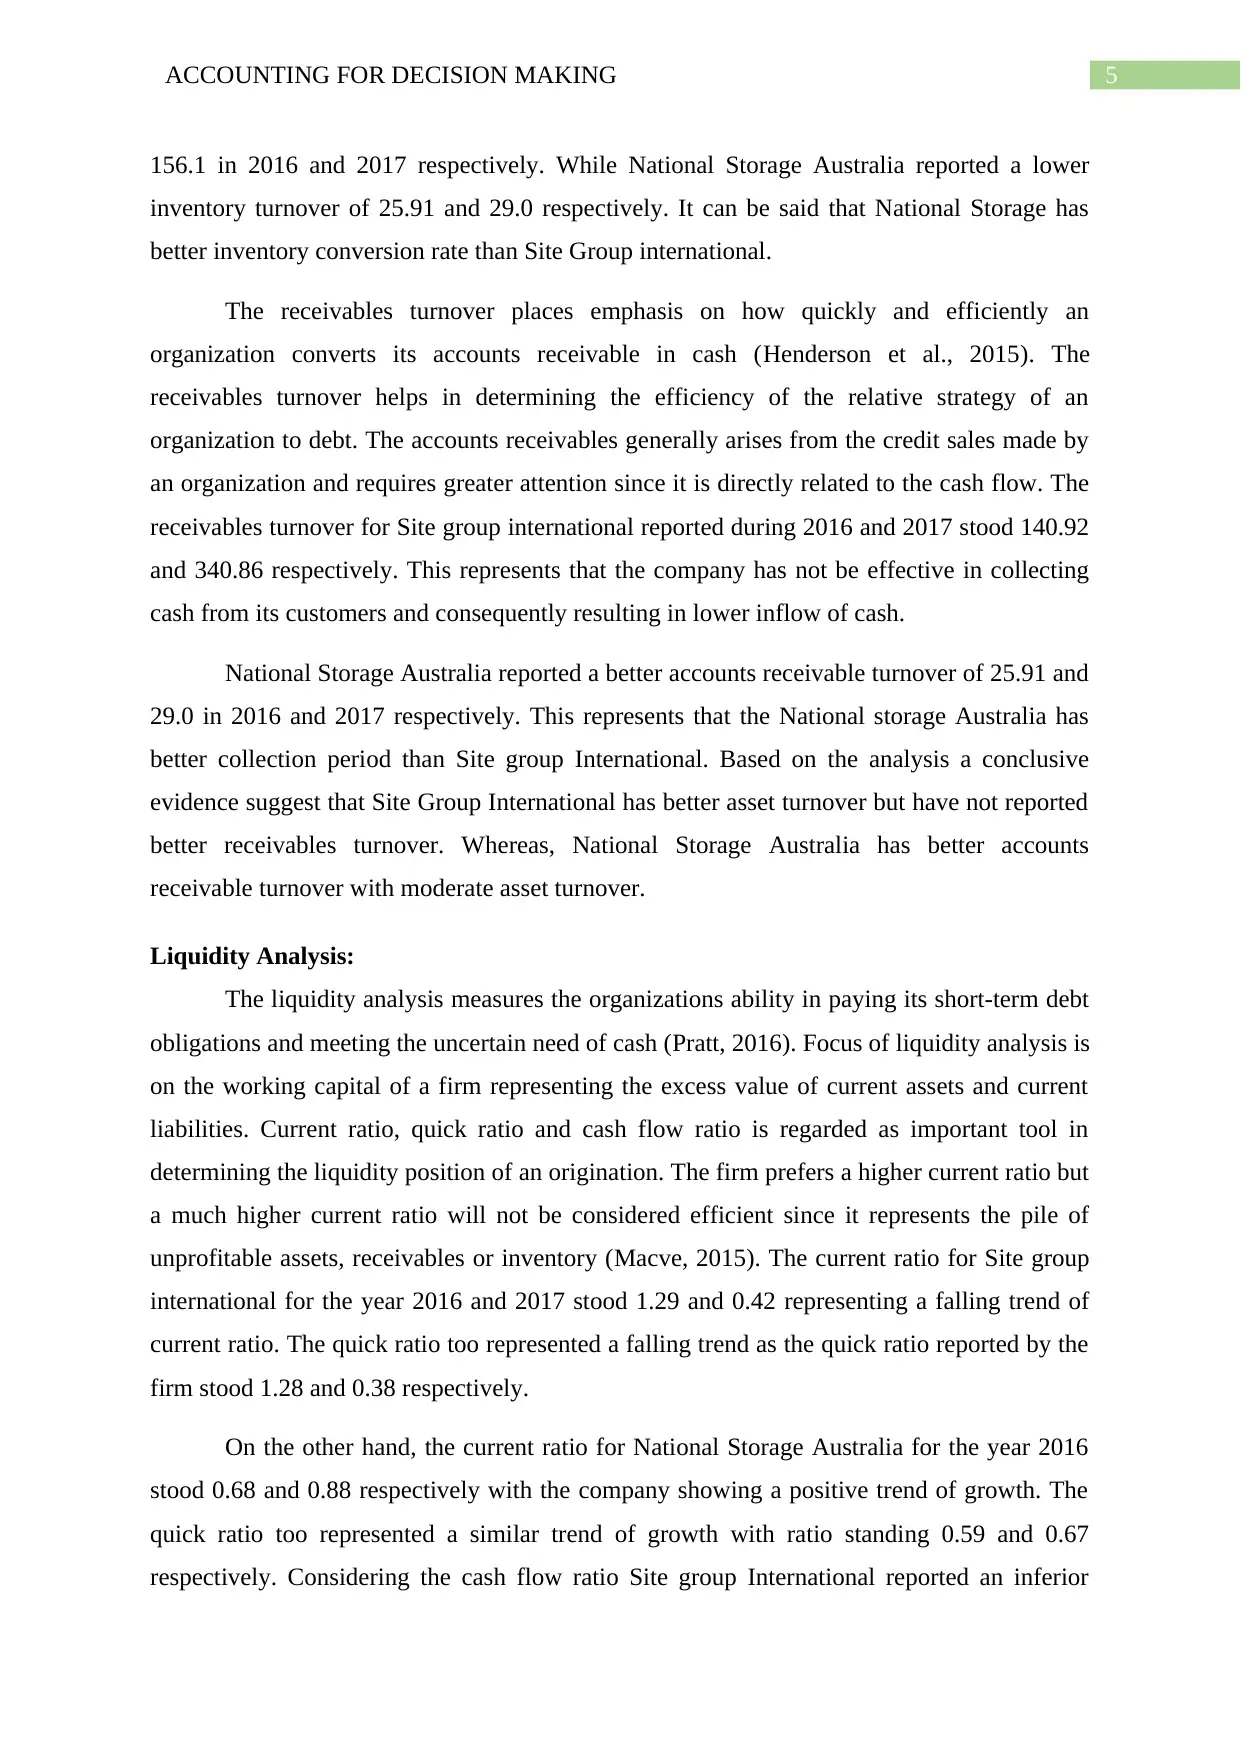
156.1 in 2016 and 2017 respectively. While National Storage Australia reported a lower
inventory turnover of 25.91 and 29.0 respectively. It can be said that National Storage has
better inventory conversion rate than Site Group international.
The receivables turnover places emphasis on how quickly and efficiently an
organization converts its accounts receivable in cash (Henderson et al., 2015). The
receivables turnover helps in determining the efficiency of the relative strategy of an
organization to debt. The accounts receivables generally arises from the credit sales made by
an organization and requires greater attention since it is directly related to the cash flow. The
receivables turnover for Site group international reported during 2016 and 2017 stood 140.92
and 340.86 respectively. This represents that the company has not be effective in collecting
cash from its customers and consequently resulting in lower inflow of cash.
National Storage Australia reported a better accounts receivable turnover of 25.91 and
29.0 in 2016 and 2017 respectively. This represents that the National storage Australia has
better collection period than Site group International. Based on the analysis a conclusive
evidence suggest that Site Group International has better asset turnover but have not reported
better receivables turnover. Whereas, National Storage Australia has better accounts
receivable turnover with moderate asset turnover.
Liquidity Analysis:
The liquidity analysis measures the organizations ability in paying its short-term debt
obligations and meeting the uncertain need of cash (Pratt, 2016). Focus of liquidity analysis is
on the working capital of a firm representing the excess value of current assets and current
liabilities. Current ratio, quick ratio and cash flow ratio is regarded as important tool in
determining the liquidity position of an origination. The firm prefers a higher current ratio but
a much higher current ratio will not be considered efficient since it represents the pile of
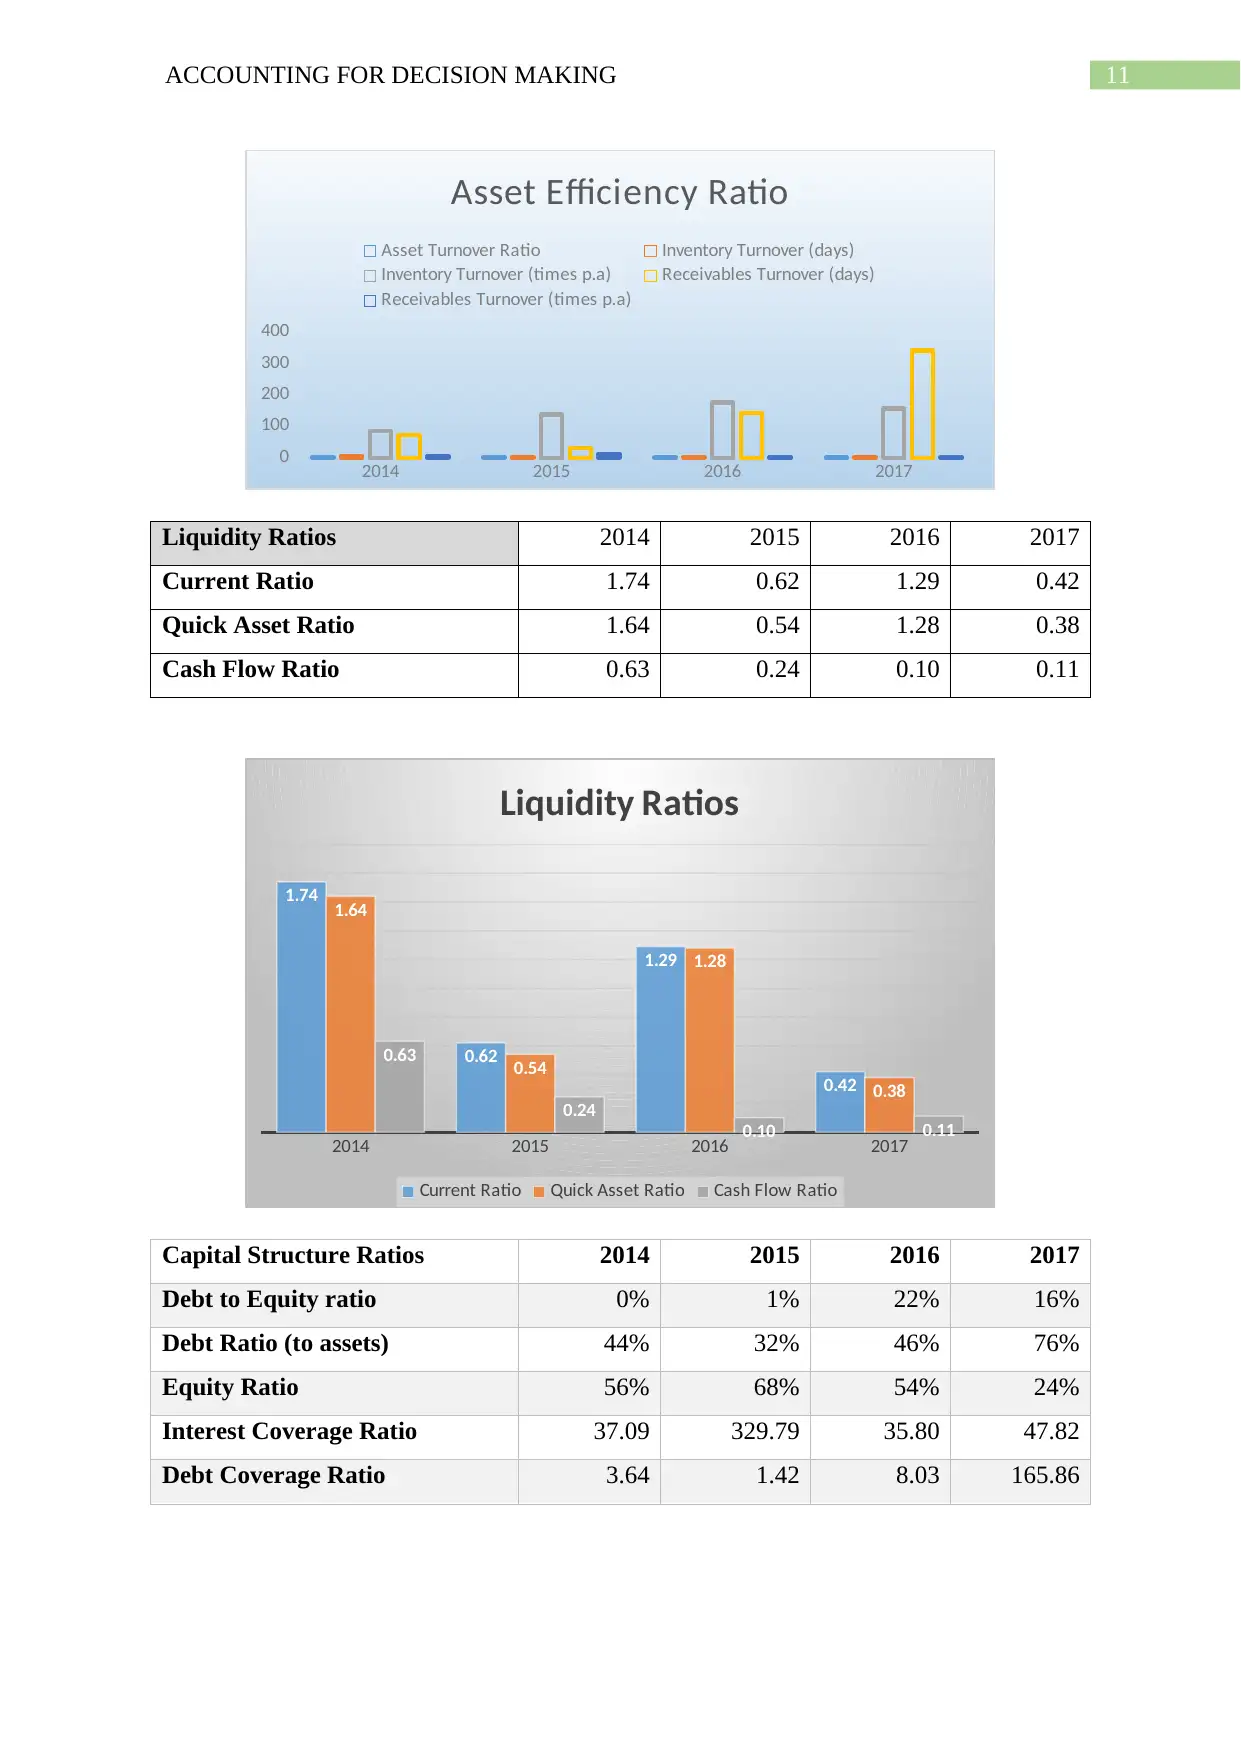
unprofitable assets, receivables or inventory (Macve, 2015). The current ratio for Site group
international for the year 2016 and 2017 stood 1.29 and 0.42 representing a falling trend of
current ratio. The quick ratio too represented a falling trend as the quick ratio reported by the
firm stood 1.28 and 0.38 respectively.
On the other hand, the current ratio for National Storage Australia for the year 2016
stood 0.68 and 0.88 respectively with the company showing a positive trend of growth. The
quick ratio too represented a similar trend of growth with ratio standing 0.59 and 0.67
respectively. Considering the cash flow ratio Site group International reported an inferior
156.1 in 2016 and 2017 respectively. While National Storage Australia reported a lower
inventory turnover of 25.91 and 29.0 respectively. It can be said that National Storage has
better inventory conversion rate than Site Group international.
The receivables turnover places emphasis on how quickly and efficiently an
organization converts its accounts receivable in cash (Henderson et al., 2015). The
receivables turnover helps in determining the efficiency of the relative strategy of an
organization to debt. The accounts receivables generally arises from the credit sales made by
an organization and requires greater attention since it is directly related to the cash flow. The
receivables turnover for Site group international reported during 2016 and 2017 stood 140.92
and 340.86 respectively. This represents that the company has not be effective in collecting
cash from its customers and consequently resulting in lower inflow of cash.
National Storage Australia reported a better accounts receivable turnover of 25.91 and
29.0 in 2016 and 2017 respectively. This represents that the National storage Australia has
better collection period than Site group International. Based on the analysis a conclusive
evidence suggest that Site Group International has better asset turnover but have not reported
better receivables turnover. Whereas, National Storage Australia has better accounts
receivable turnover with moderate asset turnover.
Liquidity Analysis:
The liquidity analysis measures the organizations ability in paying its short-term debt
obligations and meeting the uncertain need of cash (Pratt, 2016). Focus of liquidity analysis is
on the working capital of a firm representing the excess value of current assets and current
liabilities. Current ratio, quick ratio and cash flow ratio is regarded as important tool in
determining the liquidity position of an origination. The firm prefers a higher current ratio but
a much higher current ratio will not be considered efficient since it represents the pile of
unprofitable assets, receivables or inventory (Macve, 2015). The current ratio for Site group
international for the year 2016 and 2017 stood 1.29 and 0.42 representing a falling trend of
current ratio. The quick ratio too represented a falling trend as the quick ratio reported by the
firm stood 1.28 and 0.38 respectively.
On the other hand, the current ratio for National Storage Australia for the year 2016
stood 0.68 and 0.88 respectively with the company showing a positive trend of growth. The
quick ratio too represented a similar trend of growth with ratio standing 0.59 and 0.67
respectively. Considering the cash flow ratio Site group International reported an inferior
⊘ This is a preview!⊘
Do you want full access?
Subscribe today to unlock all pages.
Trusted by 1+ million students worldwide
6ACCOUNTING FOR DECISION MAKING
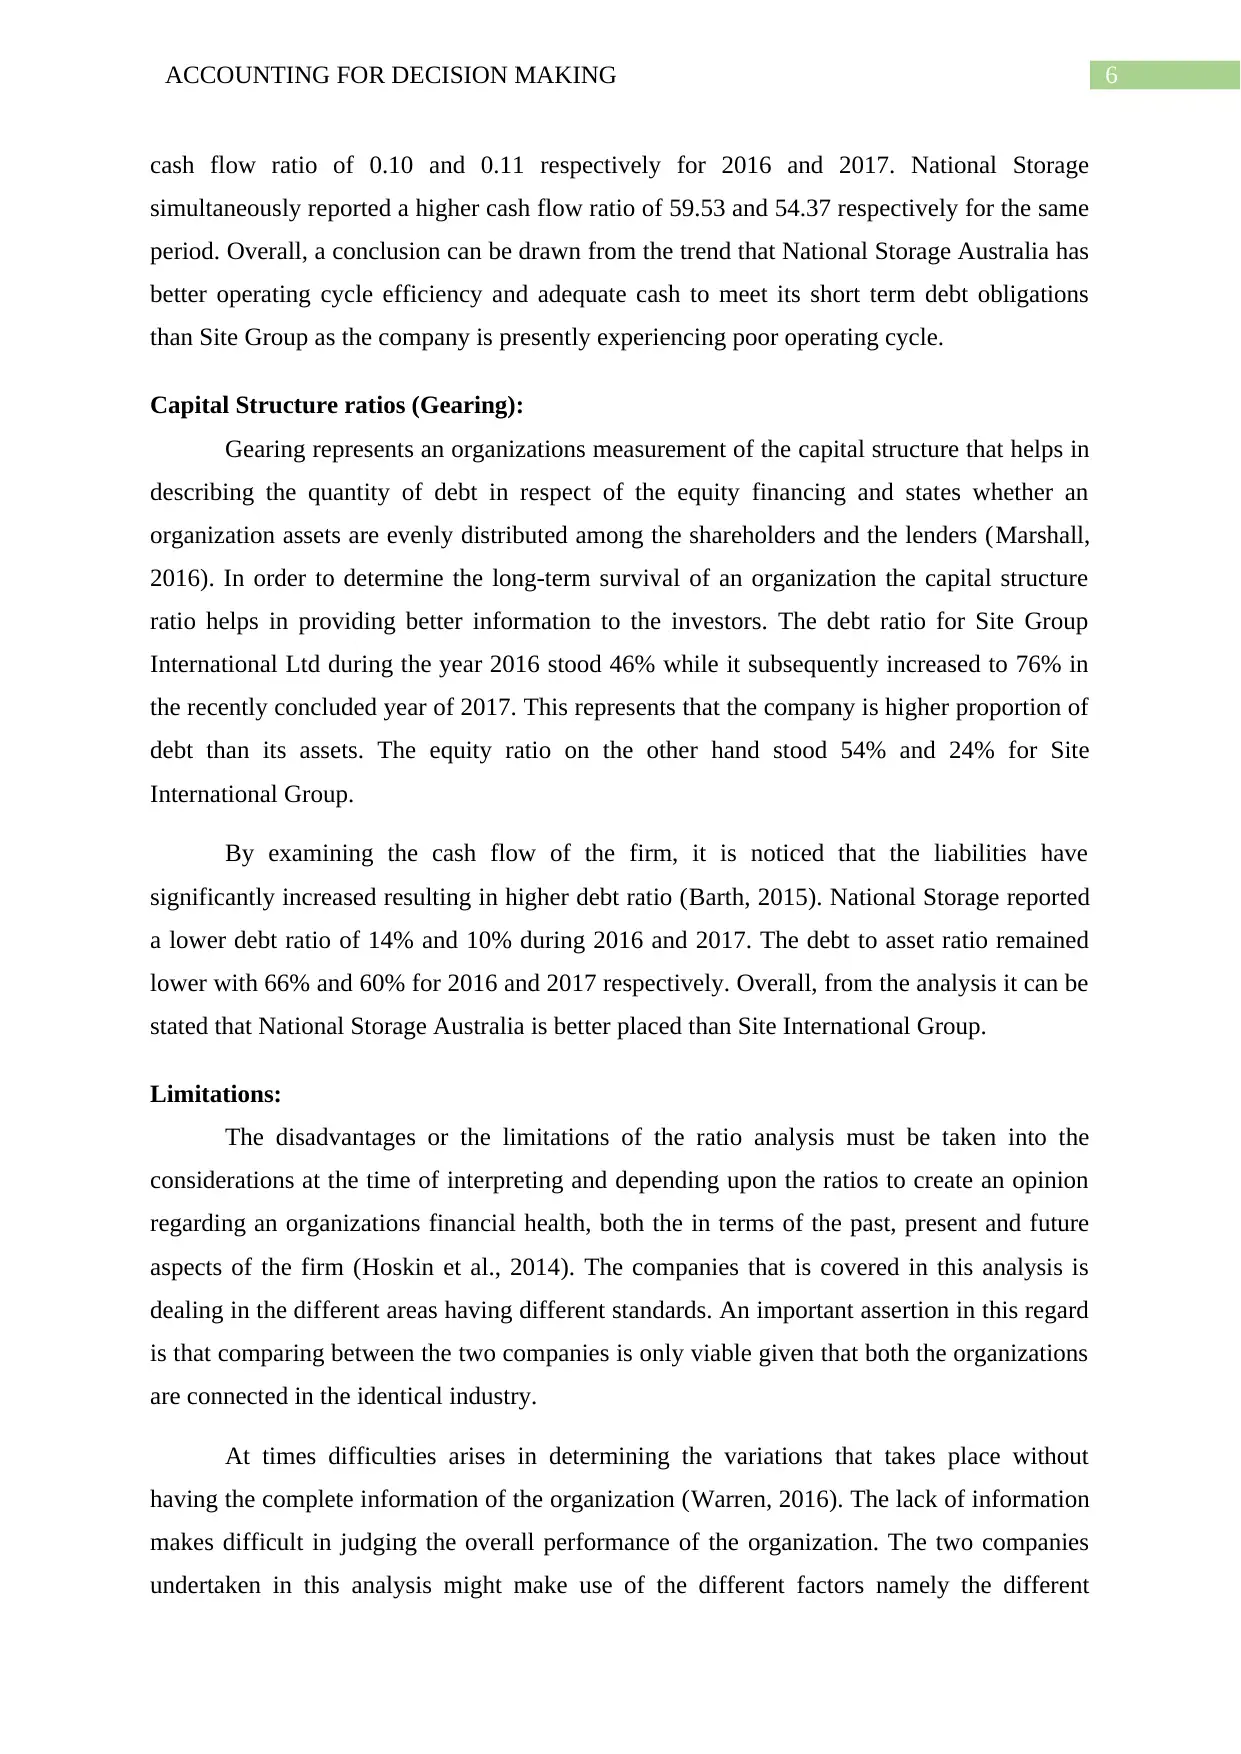
cash flow ratio of 0.10 and 0.11 respectively for 2016 and 2017. National Storage
simultaneously reported a higher cash flow ratio of 59.53 and 54.37 respectively for the same
period. Overall, a conclusion can be drawn from the trend that National Storage Australia has
better operating cycle efficiency and adequate cash to meet its short term debt obligations
than Site Group as the company is presently experiencing poor operating cycle.
Capital Structure ratios (Gearing):
Gearing represents an organizations measurement of the capital structure that helps in
describing the quantity of debt in respect of the equity financing and states whether an
organization assets are evenly distributed among the shareholders and the lenders (Marshall,
2016). In order to determine the long-term survival of an organization the capital structure
ratio helps in providing better information to the investors. The debt ratio for Site Group
International Ltd during the year 2016 stood 46% while it subsequently increased to 76% in
the recently concluded year of 2017. This represents that the company is higher proportion of
debt than its assets. The equity ratio on the other hand stood 54% and 24% for Site
International Group.
By examining the cash flow of the firm, it is noticed that the liabilities have
significantly increased resulting in higher debt ratio (Barth, 2015). National Storage reported
a lower debt ratio of 14% and 10% during 2016 and 2017. The debt to asset ratio remained
lower with 66% and 60% for 2016 and 2017 respectively. Overall, from the analysis it can be
stated that National Storage Australia is better placed than Site International Group.
Limitations:
The disadvantages or the limitations of the ratio analysis must be taken into the
considerations at the time of interpreting and depending upon the ratios to create an opinion
regarding an organizations financial health, both the in terms of the past, present and future
aspects of the firm (Hoskin et al., 2014). The companies that is covered in this analysis is
dealing in the different areas having different standards. An important assertion in this regard
is that comparing between the two companies is only viable given that both the organizations
are connected in the identical industry.
At times difficulties arises in determining the variations that takes place without
having the complete information of the organization (Warren, 2016). The lack of information
makes difficult in judging the overall performance of the organization. The two companies
undertaken in this analysis might make use of the different factors namely the different
Paraphrase This Document
Need a fresh take? Get an instant paraphrase of this document with our AI Paraphraser
7ACCOUNTING FOR DECISION MAKING
method of bookkeeping, size of the origination, accounting principles followed and the
different lines of product dealt by them. With such kind of variations, the data obtained might
fail provide an expressive conclusion.
An organization might eventually alter its organizational structure and the ratio that is
computed years before may provide an expression that may entirely change the perspective
opinion of an organization among the investors (Wild, 2015). There are often disclosure of
financial reports that eventually makes it hard for the investors in determining whether the
investors could rely on the data or the given set of information. The qualitative aspects of the
information derived might not be sufficient for appropriate disclosure of detailed financial
statements or the accounting policies undertaken. In addition to this limitation, financial data
obtained of an organization cannot be considered adequate to ascertain the present financial
health (Gassen, 2014). Ratio analysis ignores the qualitative aspects of the information since
it requires wide-ranging assessment, evaluation of competitors and current economic
scenarios.
Ratio analysis usually deals with the general data of the organization. Ratio analysis
ignores the concept of inflation since the inflationary market conditions might force an
organization to change its value and such changes might make it difficult for investors in
making the investment decision. The difficulty in investment decision usually arises because
of the insufficient information regarding the organizational policy or information about its
competitors (Williams, 2016). Conclusively, ratio analysis ignores qualitative aspects of an
organization. However, it can be useful for investors obtaining the present financial health of
the firm but the analysis overlooks the economic aspects of the study.
Conclusion & Recommendations
Conclusion:
A conclusion can be drawn by stating that National Storage Australia has reported a
better profitability, liquidity, asset efficiency and gearing than Site International Group.
National Storage Australia has posted a better asset efficiency figure representing that the
firm has better return on its assets than other firms and the profitability situations reflects that
the firm can better meet its short term obligations than Site Group. Conclusively, National
Australia Group is proved to be better firm in regulating its profit margin with better current
and quick ratio.
8ACCOUNTING FOR DECISION MAKING
Recommendations:
From an investors perspective it is recommended that they should make investment in
National Storage Australia instead of investing in Site International Group. This is because
the evidence presented from the ratio analysis has stated that the organization is making profit
with stable return on equity.
⊘ This is a preview!⊘
Do you want full access?
Subscribe today to unlock all pages.
Trusted by 1+ million students worldwide
9ACCOUNTING FOR DECISION MAKING
Reference List:
Barth, M. E. (2015). Financial accounting research, practice, and financial
accountability. Abacus, 51(4), 499-510.
Bushman, R. M. (2014). Thoughts on financial accounting and the banking industry. Journal
of Accounting and Economics, 58(2), 384-395.
Deegan, C. (2016). Financial accounting. McGraw-Hill Education Australia.
Gassen, J. (2014). Causal inference in empirical archival financial accounting
research. Accounting, Organizations and Society, 39(7), 535-544.
Henderson, S., Peirson, G., Herbohn, K., & Howieson, B. (2015). Issues in financial
accounting. Pearson Higher Education AU.
Hoskin, R. E., Fizzell, M. R., & Cherry, D. C. (2014). Financial Accounting: a user
perspective. Wiley Global Education.
Macve, R. (2015). A Conceptual Framework for Financial Accounting and Reporting:
Vision, Tool, Or Threat?. Routledge.
Marshall, D. (2016). Accounting: What the numbers mean. McGraw-Hill Higher Education.
Pratt, J. (2016). Financial accounting in an economic context. John Wiley & Sons.
Site Group International Ltd | ASX:SIT. (2018). Site. Retrieved 14 January 2018, from
http://www.site.edu.au/
Tailored Storage Solutions - National Storage Australia. (2018). National Storage Australia.
Retrieved 14 January 2018, from https://www.nationalstorage.com.au/
Warren, C. M. (2016). The impact of International Accounting Standards Board
(IASB)/International Financial Reporting Standard 16 (IFRS 16). Property
Management, 34(3).
Warren, C. S., & Jones, J. (2018). Corporate financial accounting. Cengage Learning.
Wild, J. (2015). Financial accounting fundamentals. McGraw-Hill Higher Education.
Williams, B. (2016). Financial Accounting Standards, Audit Profession Development, and
Firm-Level Tax Evasion.
Paraphrase This Document
Need a fresh take? Get an instant paraphrase of this document with our AI Paraphraser
10ACCOUNTING FOR DECISION MAKING
Williams, J. (2014). Financial accounting. McGraw-Hill Higher Education.
Appendix:
Ratios:
Site Group International:
Profitability Ratios: 2014 2015 2016 2017
Return on Equity -40% 8% 24% -186%
Return on Assets: -25% 5% 14% -90%
Profit Margin 6% 37% 43% -175%
Gross Profit Margin 75.4 82.9 87.8 75.2
Cash Flow to Sales Ratio -29.59 -0.71 -9.77 -4.08
Return on Equity Return on Assets: Gross Profit Margin Cash Flow to Sales
Ratio
-40% -25% 7540%
-2959%
8% 5%
8290%
-71%
24% 14%
8780%
-977%
-186% -90% 7520% -408%
Profitability Ratios:
2014 2015 2016 2017
Asset Efficiency Ratios 2014 2015 2016 2017
Asset Turnover Ratio 0.64 0.97 0.97 0.48
Inventory Turnover (days) 4.34 2.66 2.07 2.34
Inventory Turnover (times p.a) 84.05 137.38 175.65 156.11
Receivables Turnover (days) 71.02 29.93 140.92 340.86
Receivables Turnover (times p.a) 5.14 12.2 2.59 1.07
11ACCOUNTING FOR DECISION MAKING
2014 2015 2016 2017
0
100
200
300
400
Asset Efficiency Ratio
Asset Turnover Ratio Inventory Turnover (days)
Inventory Turnover (times p.a) Receivables Turnover (days)
Receivables Turnover (times p.a)
Liquidity Ratios 2014 2015 2016 2017
Current Ratio 1.74 0.62 1.29 0.42
Quick Asset Ratio 1.64 0.54 1.28 0.38
Cash Flow Ratio 0.63 0.24 0.10 0.11
2014 2015 2016 2017
1.74
0.62
1.29
0.42
1.64
0.54
1.28
0.38
0.63
0.24
0.10 0.11
Liquidity Ratios
Current Ratio Quick Asset Ratio Cash Flow Ratio
Capital Structure Ratios 2014 2015 2016 2017
Debt to Equity ratio 0% 1% 22% 16%
Debt Ratio (to assets) 44% 32% 46% 76%
Equity Ratio 56% 68% 54% 24%
Interest Coverage Ratio 37.09 329.79 35.80 47.82
Debt Coverage Ratio 3.64 1.42 8.03 165.86
2014 2015 2016 2017
0
100
200
300
400
Asset Efficiency Ratio
Asset Turnover Ratio Inventory Turnover (days)
Inventory Turnover (times p.a) Receivables Turnover (days)
Receivables Turnover (times p.a)
Liquidity Ratios 2014 2015 2016 2017
Current Ratio 1.74 0.62 1.29 0.42
Quick Asset Ratio 1.64 0.54 1.28 0.38
Cash Flow Ratio 0.63 0.24 0.10 0.11
2014 2015 2016 2017
1.74
0.62
1.29
0.42
1.64
0.54
1.28
0.38
0.63
0.24
0.10 0.11
Liquidity Ratios
Current Ratio Quick Asset Ratio Cash Flow Ratio
Capital Structure Ratios 2014 2015 2016 2017
Debt to Equity ratio 0% 1% 22% 16%
Debt Ratio (to assets) 44% 32% 46% 76%
Equity Ratio 56% 68% 54% 24%
Interest Coverage Ratio 37.09 329.79 35.80 47.82
Debt Coverage Ratio 3.64 1.42 8.03 165.86
⊘ This is a preview!⊘
Do you want full access?
Subscribe today to unlock all pages.
Trusted by 1+ million students worldwide
1 out of 30
Related Documents


Your All-in-One AI-Powered Toolkit for Academic Success.
+13062052269
info@desklib.com
Available 24*7 on WhatsApp / Email
![[object Object]](/_next/static/media/star-bottom.7253800d.svg)
Unlock your academic potential
Copyright © 2020–2026 A2Z Services. All Rights Reserved. Developed and managed by ZUCOL.