Financial Performance Analysis of Next Plc and H&M Companies
VerifiedAdded on 2020/02/03
|13
|3607
|773
Report
AI Summary
This report provides a comprehensive financial and non-financial performance analysis of Next Plc and Hennes & Mauritz (H&M), comparing their financial health and operational efficiency. It utilizes various financial ratios, including gross margin, net margin, return on assets, return on equity, current ratio, and quick ratio, to evaluate profitability, liquidity, and solvency. The analysis extends to non-financial metrics like revenue per employee and EBITDA per employee. The report recommends investment decisions for the CFO of Asol Ltd, suggesting the purchase of Next Plc shares based on its superior performance. Additionally, it includes graphical presentations of key financial data and offers recommendations to H&M for improving its performance. The report also discusses the limitations of ratio analysis and applies capital investment appraisal techniques, such as calculating net cash flow, payback period, net present value, and accounting rate of return, to evaluate potential investment projects for Hilltop Limited, aiding in making informed financial decisions.

ACCOUNTING AND
FINANCE
1 | P a g e
FINANCE
1 | P a g e
Paraphrase This Document
Need a fresh take? Get an instant paraphrase of this document with our AI Paraphraser
Table of Contents
INTRODUCTION .....................................................................................................................1
TASK 1 .....................................................................................................................................1
Financial performance analysis.............................................................................................1
Non-financial performance analysis......................................................................................3
Graphical presentation through charts...................................................................................3
Recommendation to H & M for improving their performance.............................................6
Limitations or drawbacks of ratio analysis............................................................................7
TASK 2 Capital investment appraisal .......................................................................................7
Calculation of Net cash flow (NCF)......................................................................................8
Payback period......................................................................................................................8
Project Net present value (NPV)...........................................................................................9
Project Accounting rate of return (ARR)..............................................................................9
Limitations of capital investment appraisal techniques.......................................................10
CONCLUSION........................................................................................................................10
REFERENCES.........................................................................................................................12
2 | P a g e
INTRODUCTION
Financial and management accounting are different from each other. Financial
accounting is the process of recording, summarizing, analysing and interpreting the business
affairs. However, under the management accounting, managers use this information to take
strategic and qualified managerial decisions. The present project report will make financial as
well as non financial performance analysis of Next Plc and Hennes and Mautriz. It will also
help in taking effective investment decisions by the CFO of Asol Ltd who is considered for
purchasing shares in either of two cloth retailer companies, next plc and H & M. In addition
to it, various capital investment appraisal tools have been used to select most viable project
for Hilltop Limited.
TASK 1
Financial performance analysis
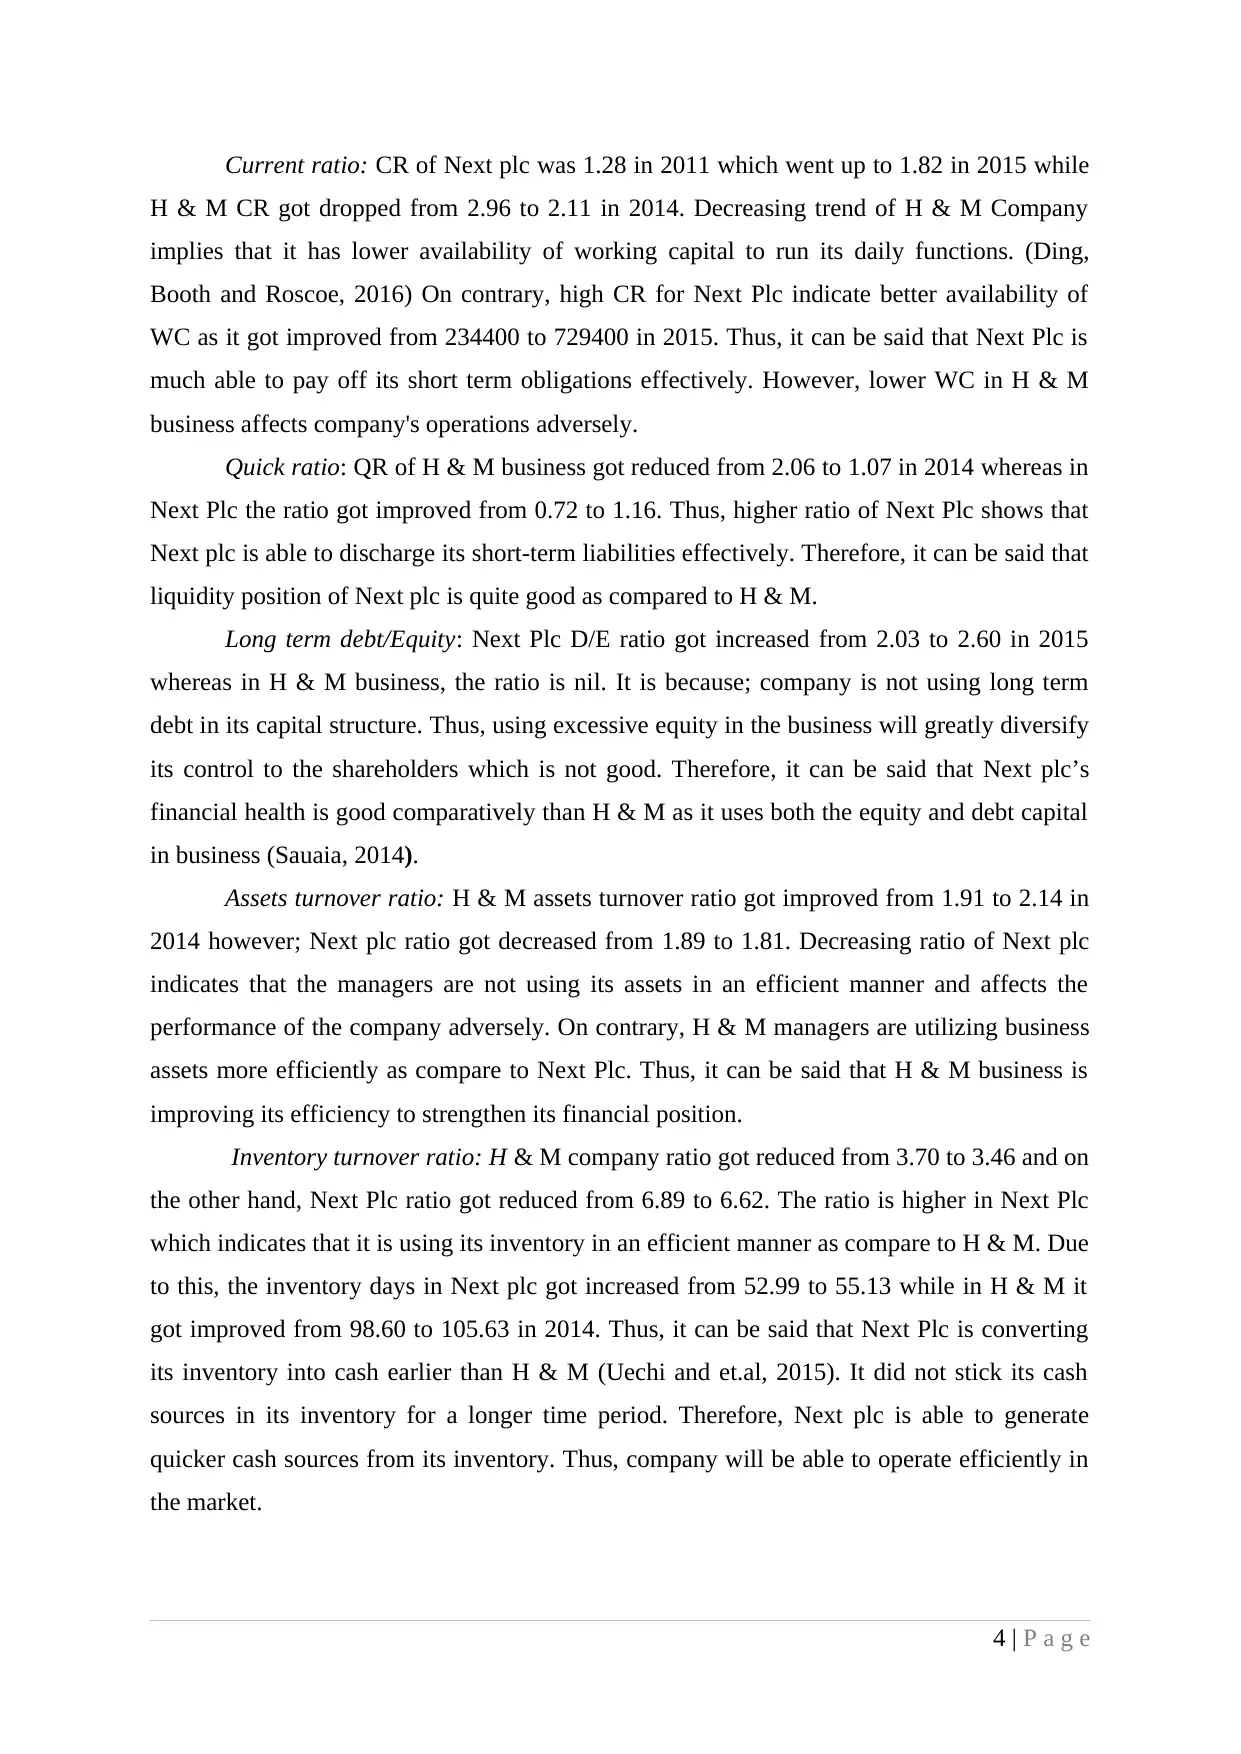
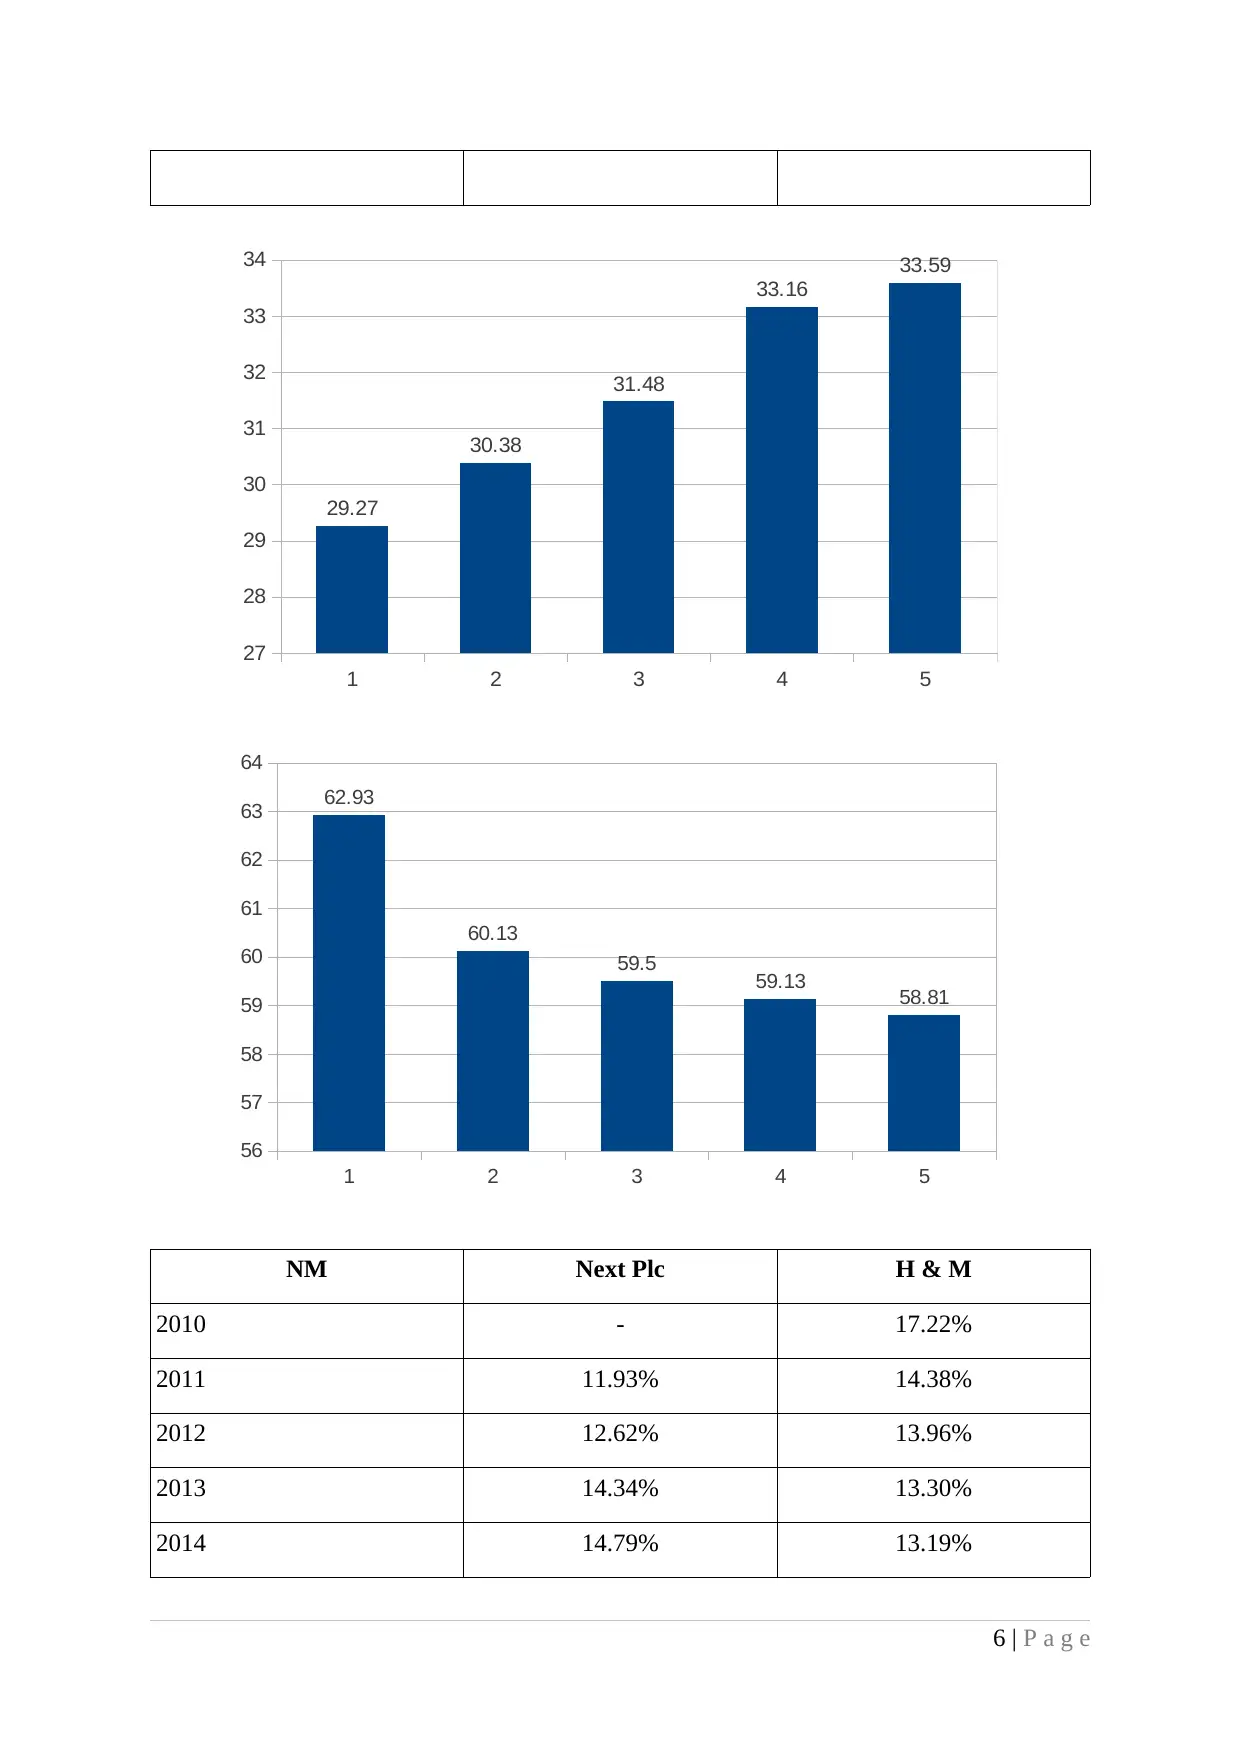
Gross margin (GM): Next plc GM has been improved from 29.27% to 33.59% in
2015, whilst GM of H & M Company got reduced from 62.93% to 58.81% in 2014, which is
bad. Thus, increasing trend of GM for Next plc indicate that the company is improving their
performance continuously. However, GM of H & M Company shows that although it is
earning higher profit margin but declining trend is a negative sign and indicate poor
operational performance. The reason for this is its COGS to revenue ratio got improved from
37.07% to 41.19% while in Next Plc; it got dropped from 70.73% to 66.41%.
Net margin (NM): Next plc net margin got increased from 11.93% to 15.87% in the
year 2015 whereas in H & M business, it got dropped from 17.22% to 13.19% in 2014. High
ratio of Next Plc implies that it is performing better than H & M business. However,
declining trend of H & M's NM arisen because of high operating expenses.
Return on assets (ROA): H & M Company’s ROA ratio fell from 32.91% to 28.28%
in 2014 however; Next Plc ROA got increased from 22.55% to 28.68% in 2015. It is higher
in Next plc which indicates that its mangers are efficient and manage company's operations
effectively as compared to H & M. Increase in company's profits is the reason for higher
ROA for Next Plc.
Return on equity (ROE): Next plc ROE ratio fell from 214.98% to 208.75% while in
H & M; it got decreased to 41.27% in 2014. It is higher in Next Plc Company which implies
that it is earning greater amount of profitability on total equity funds. However, the reason for
lower ratio in H & M is that it is using only the equity in its capital structure. Decreased
business profits are another reason for lowering ROE.
3 | P a g e
Financial and management accounting are different from each other. Financial
accounting is the process of recording, summarizing, analysing and interpreting the business
affairs. However, under the management accounting, managers use this information to take
strategic and qualified managerial decisions. The present project report will make financial as
well as non financial performance analysis of Next Plc and Hennes and Mautriz. It will also
help in taking effective investment decisions by the CFO of Asol Ltd who is considered for
purchasing shares in either of two cloth retailer companies, next plc and H & M. In addition
to it, various capital investment appraisal tools have been used to select most viable project
for Hilltop Limited.
TASK 1
Financial performance analysis
Gross margin (GM): Next plc GM has been improved from 29.27% to 33.59% in
2015, whilst GM of H & M Company got reduced from 62.93% to 58.81% in 2014, which is
bad. Thus, increasing trend of GM for Next plc indicate that the company is improving their
performance continuously. However, GM of H & M Company shows that although it is
earning higher profit margin but declining trend is a negative sign and indicate poor
operational performance. The reason for this is its COGS to revenue ratio got improved from
37.07% to 41.19% while in Next Plc; it got dropped from 70.73% to 66.41%.
Net margin (NM): Next plc net margin got increased from 11.93% to 15.87% in the
year 2015 whereas in H & M business, it got dropped from 17.22% to 13.19% in 2014. High
ratio of Next Plc implies that it is performing better than H & M business. However,
declining trend of H & M's NM arisen because of high operating expenses.
Return on assets (ROA): H & M Company’s ROA ratio fell from 32.91% to 28.28%
in 2014 however; Next Plc ROA got increased from 22.55% to 28.68% in 2015. It is higher
in Next plc which indicates that its mangers are efficient and manage company's operations
effectively as compared to H & M. Increase in company's profits is the reason for higher
ROA for Next Plc.
Return on equity (ROE): Next plc ROE ratio fell from 214.98% to 208.75% while in
H & M; it got decreased to 41.27% in 2014. It is higher in Next Plc Company which implies
that it is earning greater amount of profitability on total equity funds. However, the reason for
lower ratio in H & M is that it is using only the equity in its capital structure. Decreased
business profits are another reason for lowering ROE.
3 | P a g e
⊘ This is a preview!⊘
Do you want full access?
Subscribe today to unlock all pages.
Trusted by 1+ million students worldwide
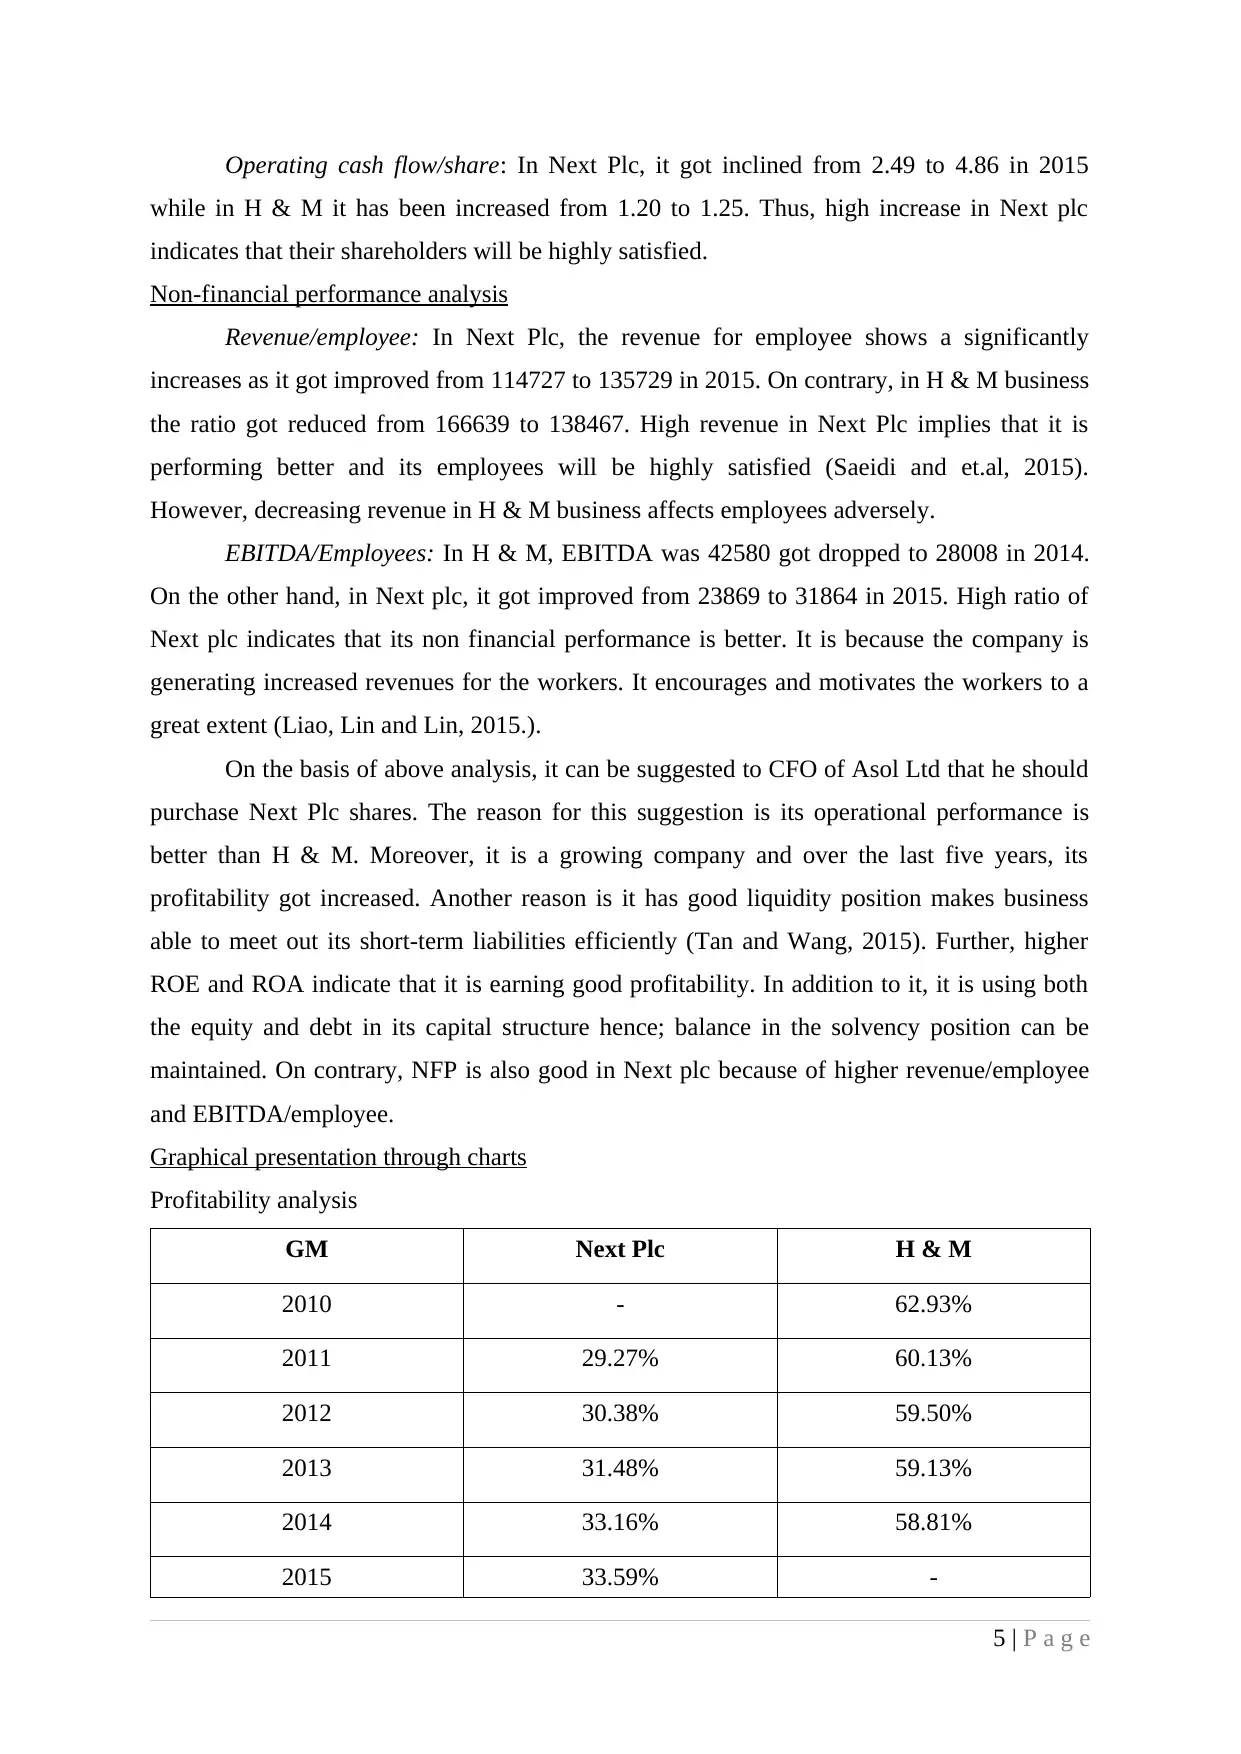
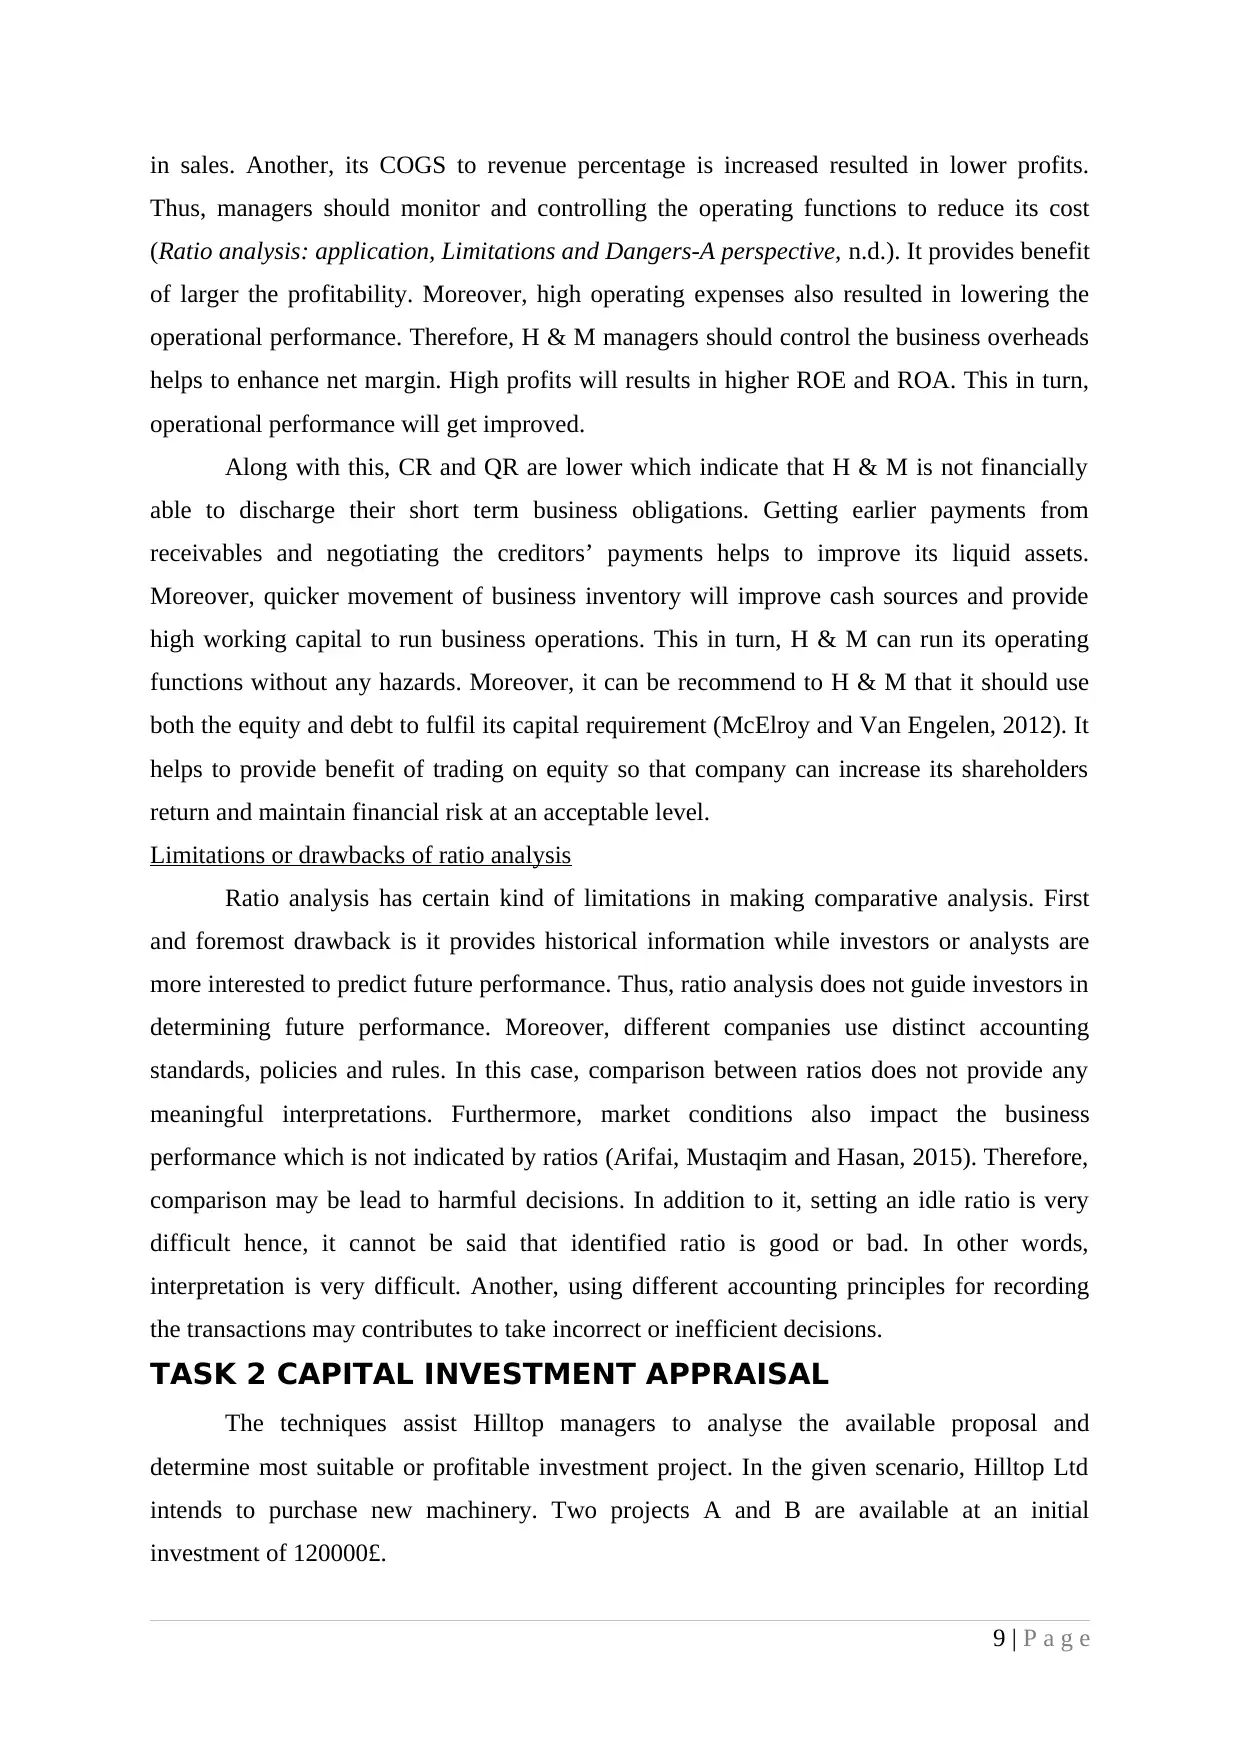
Current ratio: CR of Next plc was 1.28 in 2011 which went up to 1.82 in 2015 while
H & M CR got dropped from 2.96 to 2.11 in 2014. Decreasing trend of H & M Company
implies that it has lower availability of working capital to run its daily functions. (Ding,
Booth and Roscoe, 2016) On contrary, high CR for Next Plc indicate better availability of
WC as it got improved from 234400 to 729400 in 2015. Thus, it can be said that Next Plc is
much able to pay off its short term obligations effectively. However, lower WC in H & M
business affects company's operations adversely.
Quick ratio: QR of H & M business got reduced from 2.06 to 1.07 in 2014 whereas in
Next Plc the ratio got improved from 0.72 to 1.16. Thus, higher ratio of Next Plc shows that
Next plc is able to discharge its short-term liabilities effectively. Therefore, it can be said that
liquidity position of Next plc is quite good as compared to H & M.
Long term debt/Equity: Next Plc D/E ratio got increased from 2.03 to 2.60 in 2015
whereas in H & M business, the ratio is nil. It is because; company is not using long term
debt in its capital structure. Thus, using excessive equity in the business will greatly diversify
its control to the shareholders which is not good. Therefore, it can be said that Next plc’s
financial health is good comparatively than H & M as it uses both the equity and debt capital
in business (Sauaia, 2014).
Assets turnover ratio: H & M assets turnover ratio got improved from 1.91 to 2.14 in
2014 however; Next plc ratio got decreased from 1.89 to 1.81. Decreasing ratio of Next plc
indicates that the managers are not using its assets in an efficient manner and affects the
performance of the company adversely. On contrary, H & M managers are utilizing business
assets more efficiently as compare to Next Plc. Thus, it can be said that H & M business is
improving its efficiency to strengthen its financial position.
Inventory turnover ratio: H & M company ratio got reduced from 3.70 to 3.46 and on
the other hand, Next Plc ratio got reduced from 6.89 to 6.62. The ratio is higher in Next Plc
which indicates that it is using its inventory in an efficient manner as compare to H & M. Due
to this, the inventory days in Next plc got increased from 52.99 to 55.13 while in H & M it
got improved from 98.60 to 105.63 in 2014. Thus, it can be said that Next Plc is converting
its inventory into cash earlier than H & M (Uechi and et.al, 2015). It did not stick its cash
sources in its inventory for a longer time period. Therefore, Next plc is able to generate
quicker cash sources from its inventory. Thus, company will be able to operate efficiently in
the market.
4 | P a g e
Paraphrase This Document
Need a fresh take? Get an instant paraphrase of this document with our AI Paraphraser
Operating cash flow/share: In Next Plc, it got inclined from 2.49 to 4.86 in 2015
while in H & M it has been increased from 1.20 to 1.25. Thus, high increase in Next plc
indicates that their shareholders will be highly satisfied.
Non-financial performance analysis
Revenue/employee: In Next Plc, the revenue for employee shows a significantly
increases as it got improved from 114727 to 135729 in 2015. On contrary, in H & M business
the ratio got reduced from 166639 to 138467. High revenue in Next Plc implies that it is
performing better and its employees will be highly satisfied (Saeidi and et.al, 2015).
However, decreasing revenue in H & M business affects employees adversely.
EBITDA/Employees: In H & M, EBITDA was 42580 got dropped to 28008 in 2014.
On the other hand, in Next plc, it got improved from 23869 to 31864 in 2015. High ratio of
Next plc indicates that its non financial performance is better. It is because the company is
generating increased revenues for the workers. It encourages and motivates the workers to a
great extent (Liao, Lin and Lin, 2015.).
On the basis of above analysis, it can be suggested to CFO of Asol Ltd that he should
purchase Next Plc shares. The reason for this suggestion is its operational performance is
better than H & M. Moreover, it is a growing company and over the last five years, its
profitability got increased. Another reason is it has good liquidity position makes business
able to meet out its short-term liabilities efficiently (Tan and Wang, 2015). Further, higher
ROE and ROA indicate that it is earning good profitability. In addition to it, it is using both
the equity and debt in its capital structure hence; balance in the solvency position can be
maintained. On contrary, NFP is also good in Next plc because of higher revenue/employee
and EBITDA/employee.
Graphical presentation through charts
Profitability analysis
GM Next Plc H & M
2010 - 62.93%
2011 29.27% 60.13%
2012 30.38% 59.50%
2013 31.48% 59.13%
2014 33.16% 58.81%
2015 33.59% -
5 | P a g e
1 2 3 4 5
27
28
29
30
31
32
33
34
29.27
30.38
31.48
33.16
33.59
1 2 3 4 5
56
57
58
59
60
61
62
63
64
62.93
60.13
59.5 59.13 58.81
NM Next Plc H & M
2010 - 17.22%
2011 11.93% 14.38%
2012 12.62% 13.96%
2013 14.34% 13.30%
2014 14.79% 13.19%
6 | P a g e
27
28
29
30
31
32
33
34
29.27
30.38
31.48
33.16
33.59
1 2 3 4 5
56
57
58
59
60
61
62
63
64
62.93
60.13
59.5 59.13 58.81
NM Next Plc H & M
2010 - 17.22%
2011 11.93% 14.38%
2012 12.62% 13.96%
2013 14.34% 13.30%
2014 14.79% 13.19%
6 | P a g e
⊘ This is a preview!⊘
Do you want full access?
Subscribe today to unlock all pages.
Trusted by 1+ million students worldwide
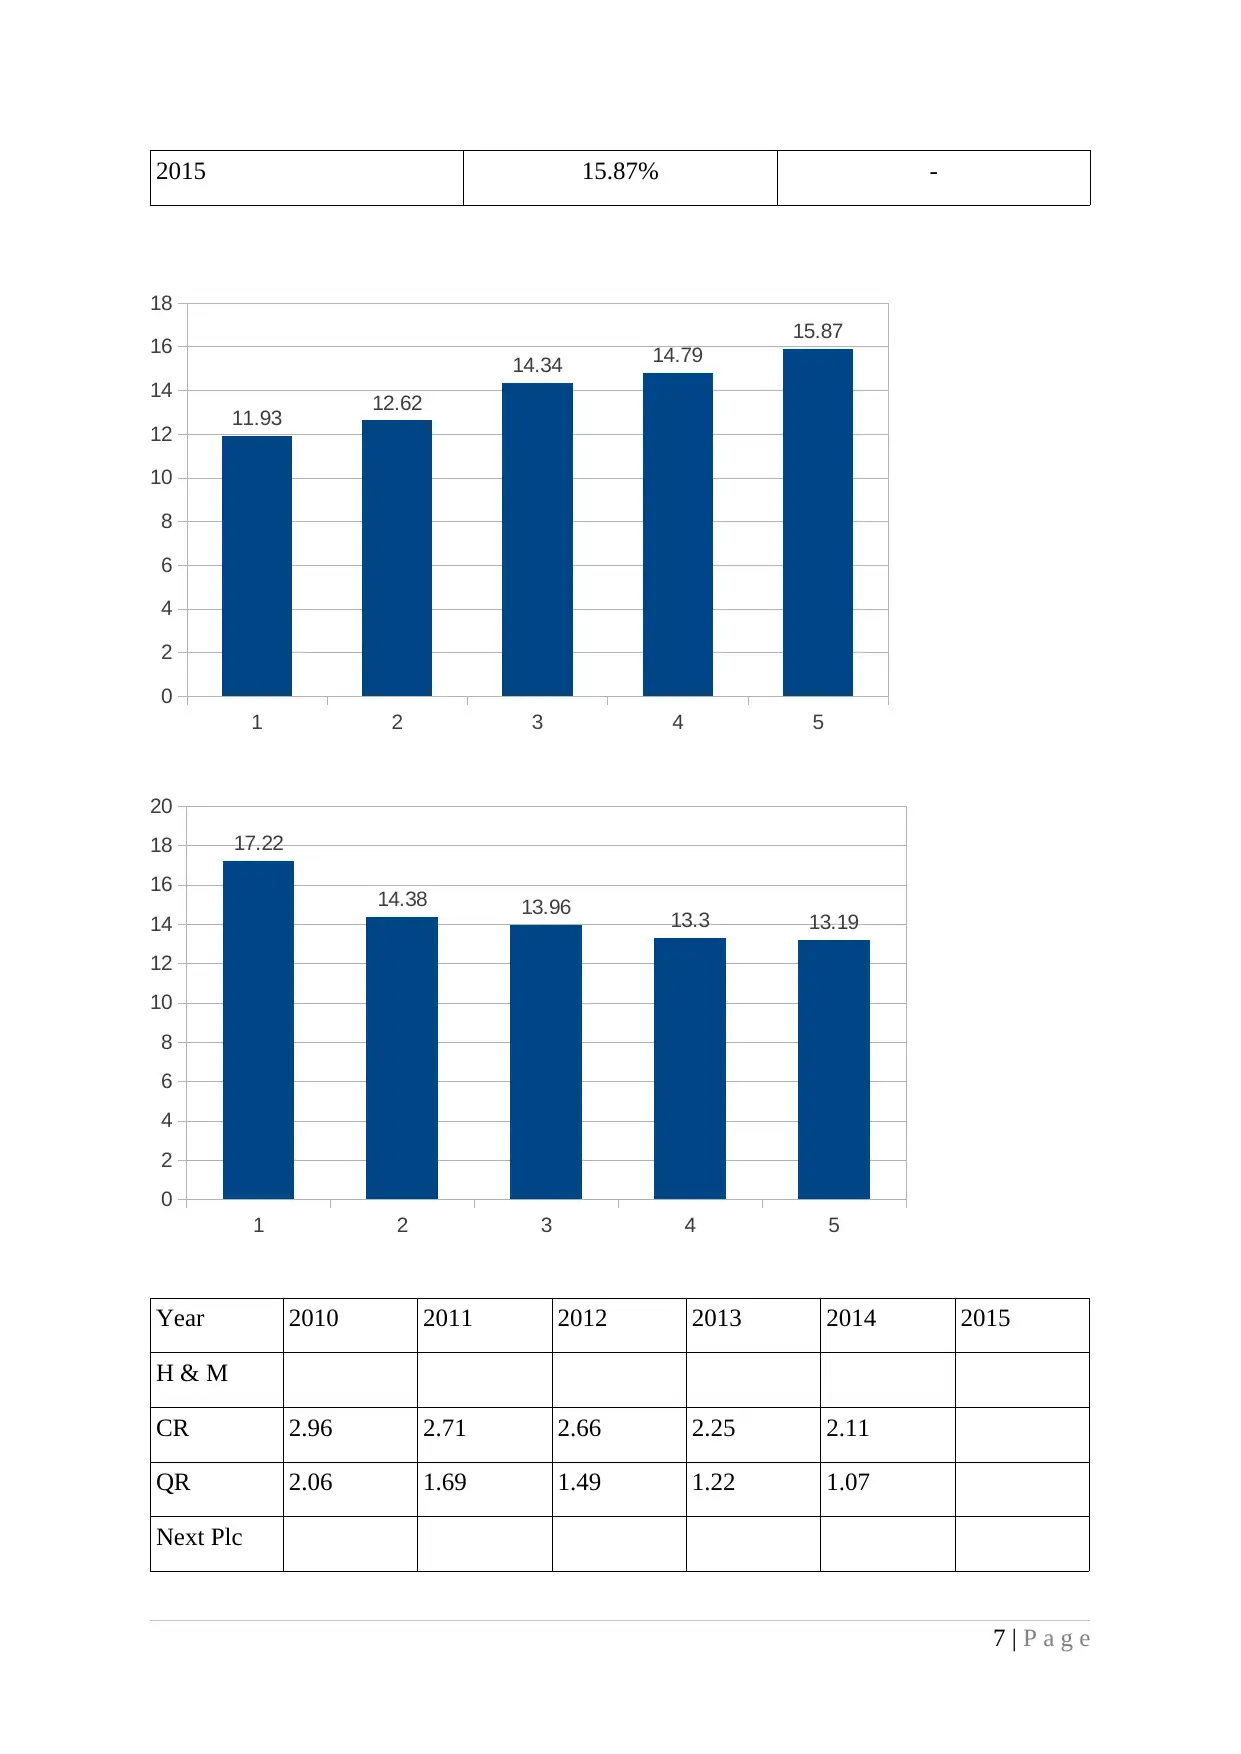
2015 15.87% -
1 2 3 4 5
0
2
4
6
8
10
12
14
16
18
11.93 12.62
14.34 14.79
15.87
1 2 3 4 5
0
2
4
6
8
10
12
14
16
18
20
17.22
14.38 13.96 13.3 13.19
Year 2010 2011 2012 2013 2014 2015
H & M
CR 2.96 2.71 2.66 2.25 2.11
QR 2.06 1.69 1.49 1.22 1.07
Next Plc
7 | P a g e
1 2 3 4 5
0
2
4
6
8
10
12
14
16
18
11.93 12.62
14.34 14.79
15.87
1 2 3 4 5
0
2
4
6
8
10
12
14
16
18
20
17.22
14.38 13.96 13.3 13.19
Year 2010 2011 2012 2013 2014 2015
H & M
CR 2.96 2.71 2.66 2.25 2.11
QR 2.06 1.69 1.49 1.22 1.07
Next Plc
7 | P a g e
Paraphrase This Document
Need a fresh take? Get an instant paraphrase of this document with our AI Paraphraser
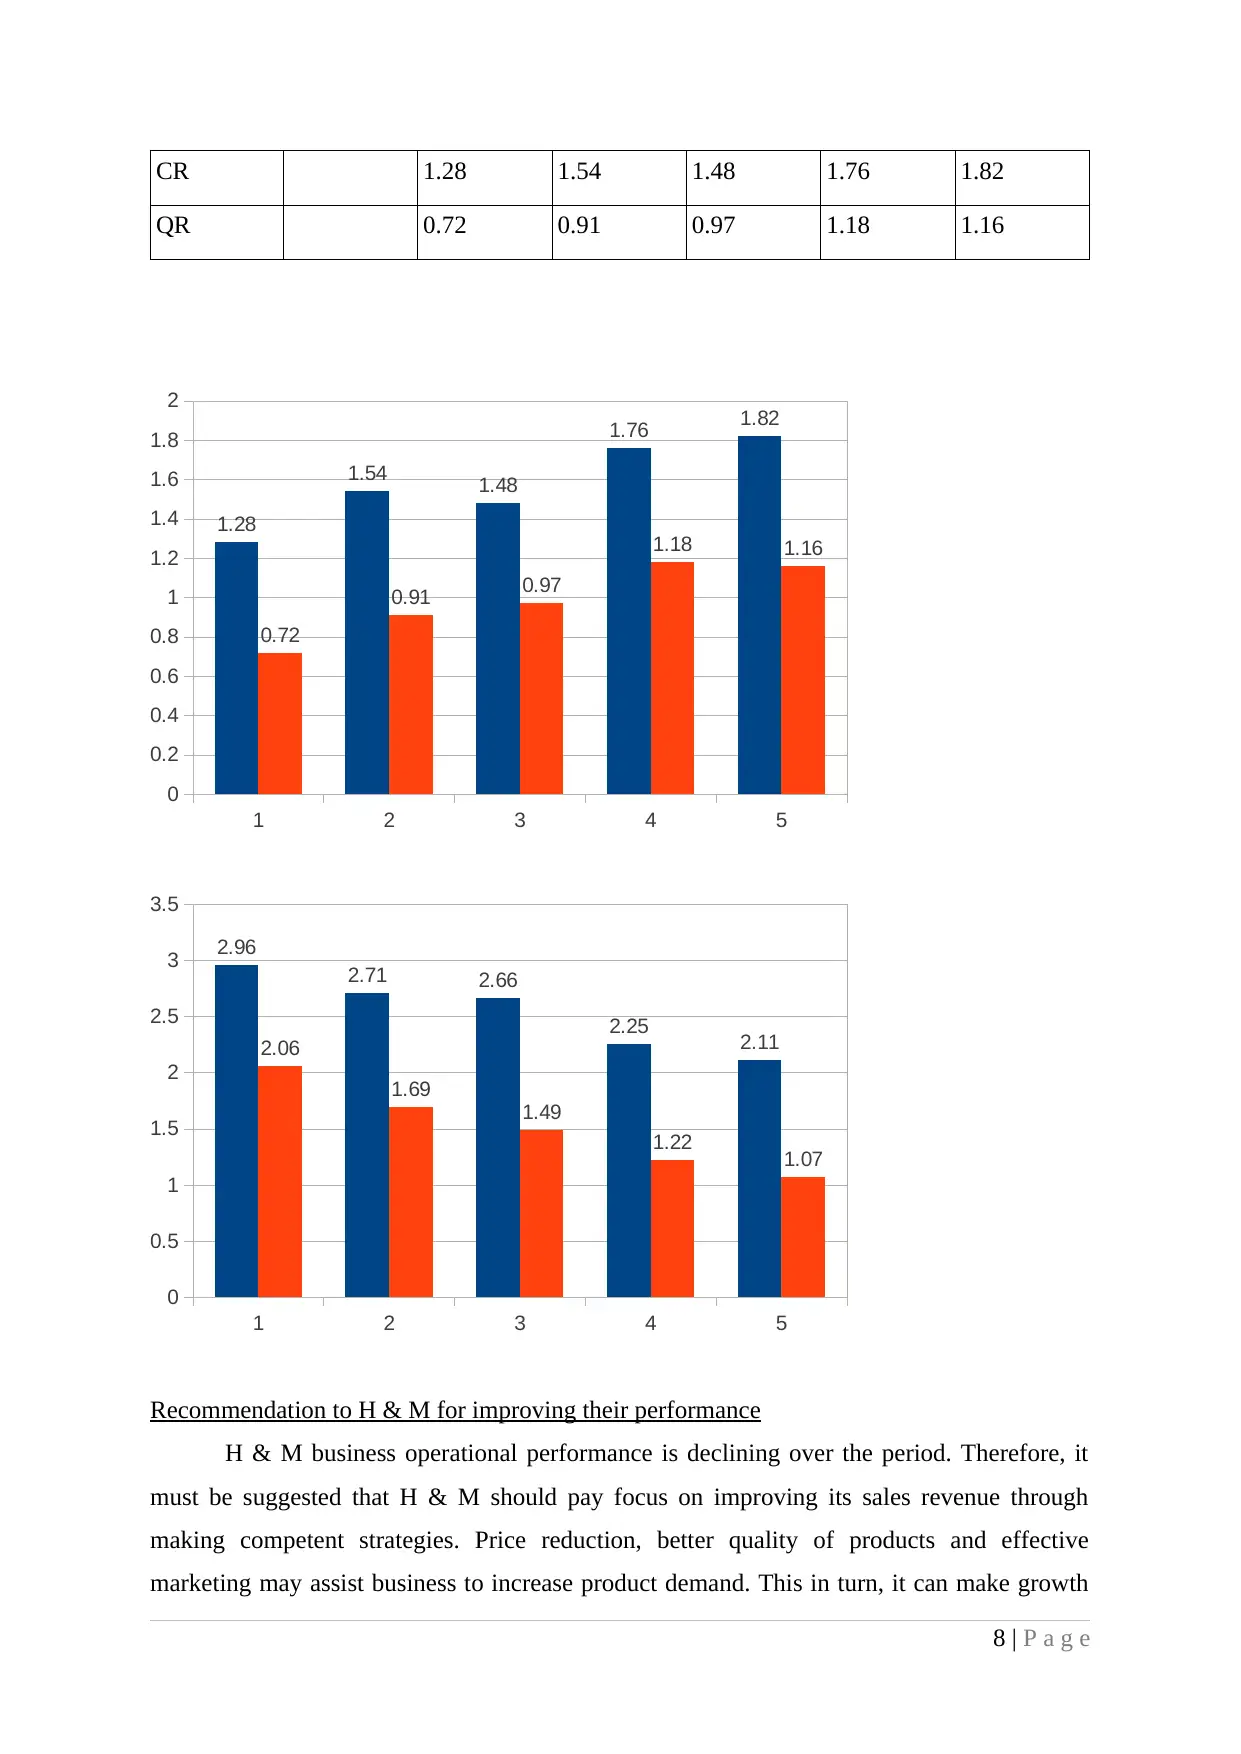
CR 1.28 1.54 1.48 1.76 1.82
QR 0.72 0.91 0.97 1.18 1.16
1 2 3 4 5
0
0.2
0.4
0.6
0.8
1
1.2
1.4
1.6
1.8
2
1.28
1.54 1.48
1.76 1.82
0.72
0.91 0.97
1.18 1.16
1 2 3 4 5
0
0.5
1
1.5
2
2.5
3
3.5
2.96
2.71 2.66
2.25 2.112.06
1.69
1.49
1.22 1.07
Recommendation to H & M for improving their performance
H & M business operational performance is declining over the period. Therefore, it
must be suggested that H & M should pay focus on improving its sales revenue through
making competent strategies. Price reduction, better quality of products and effective
marketing may assist business to increase product demand. This in turn, it can make growth
8 | P a g e
in sales. Another, its COGS to revenue percentage is increased resulted in lower profits.
Thus, managers should monitor and controlling the operating functions to reduce its cost
(Ratio analysis: application, Limitations and Dangers-A perspective, n.d.). It provides benefit
of larger the profitability. Moreover, high operating expenses also resulted in lowering the
operational performance. Therefore, H & M managers should control the business overheads
helps to enhance net margin. High profits will results in higher ROE and ROA. This in turn,
operational performance will get improved.
Along with this, CR and QR are lower which indicate that H & M is not financially
able to discharge their short term business obligations. Getting earlier payments from
receivables and negotiating the creditors’ payments helps to improve its liquid assets.
Moreover, quicker movement of business inventory will improve cash sources and provide
high working capital to run business operations. This in turn, H & M can run its operating
functions without any hazards. Moreover, it can be recommend to H & M that it should use
both the equity and debt to fulfil its capital requirement (McElroy and Van Engelen, 2012). It
helps to provide benefit of trading on equity so that company can increase its shareholders
return and maintain financial risk at an acceptable level.
Limitations or drawbacks of ratio analysis
Ratio analysis has certain kind of limitations in making comparative analysis. First
and foremost drawback is it provides historical information while investors or analysts are
more interested to predict future performance. Thus, ratio analysis does not guide investors in
determining future performance. Moreover, different companies use distinct accounting
standards, policies and rules. In this case, comparison between ratios does not provide any
meaningful interpretations. Furthermore, market conditions also impact the business
performance which is not indicated by ratios (Arifai, Mustaqim and Hasan, 2015). Therefore,
comparison may be lead to harmful decisions. In addition to it, setting an idle ratio is very
difficult hence, it cannot be said that identified ratio is good or bad. In other words,
interpretation is very difficult. Another, using different accounting principles for recording
the transactions may contributes to take incorrect or inefficient decisions.
TASK 2 CAPITAL INVESTMENT APPRAISAL
The techniques assist Hilltop managers to analyse the available proposal and
determine most suitable or profitable investment project. In the given scenario, Hilltop Ltd
intends to purchase new machinery. Two projects A and B are available at an initial
investment of 120000£.
9 | P a g e
⊘ This is a preview!⊘
Do you want full access?
Subscribe today to unlock all pages.
Trusted by 1+ million students worldwide
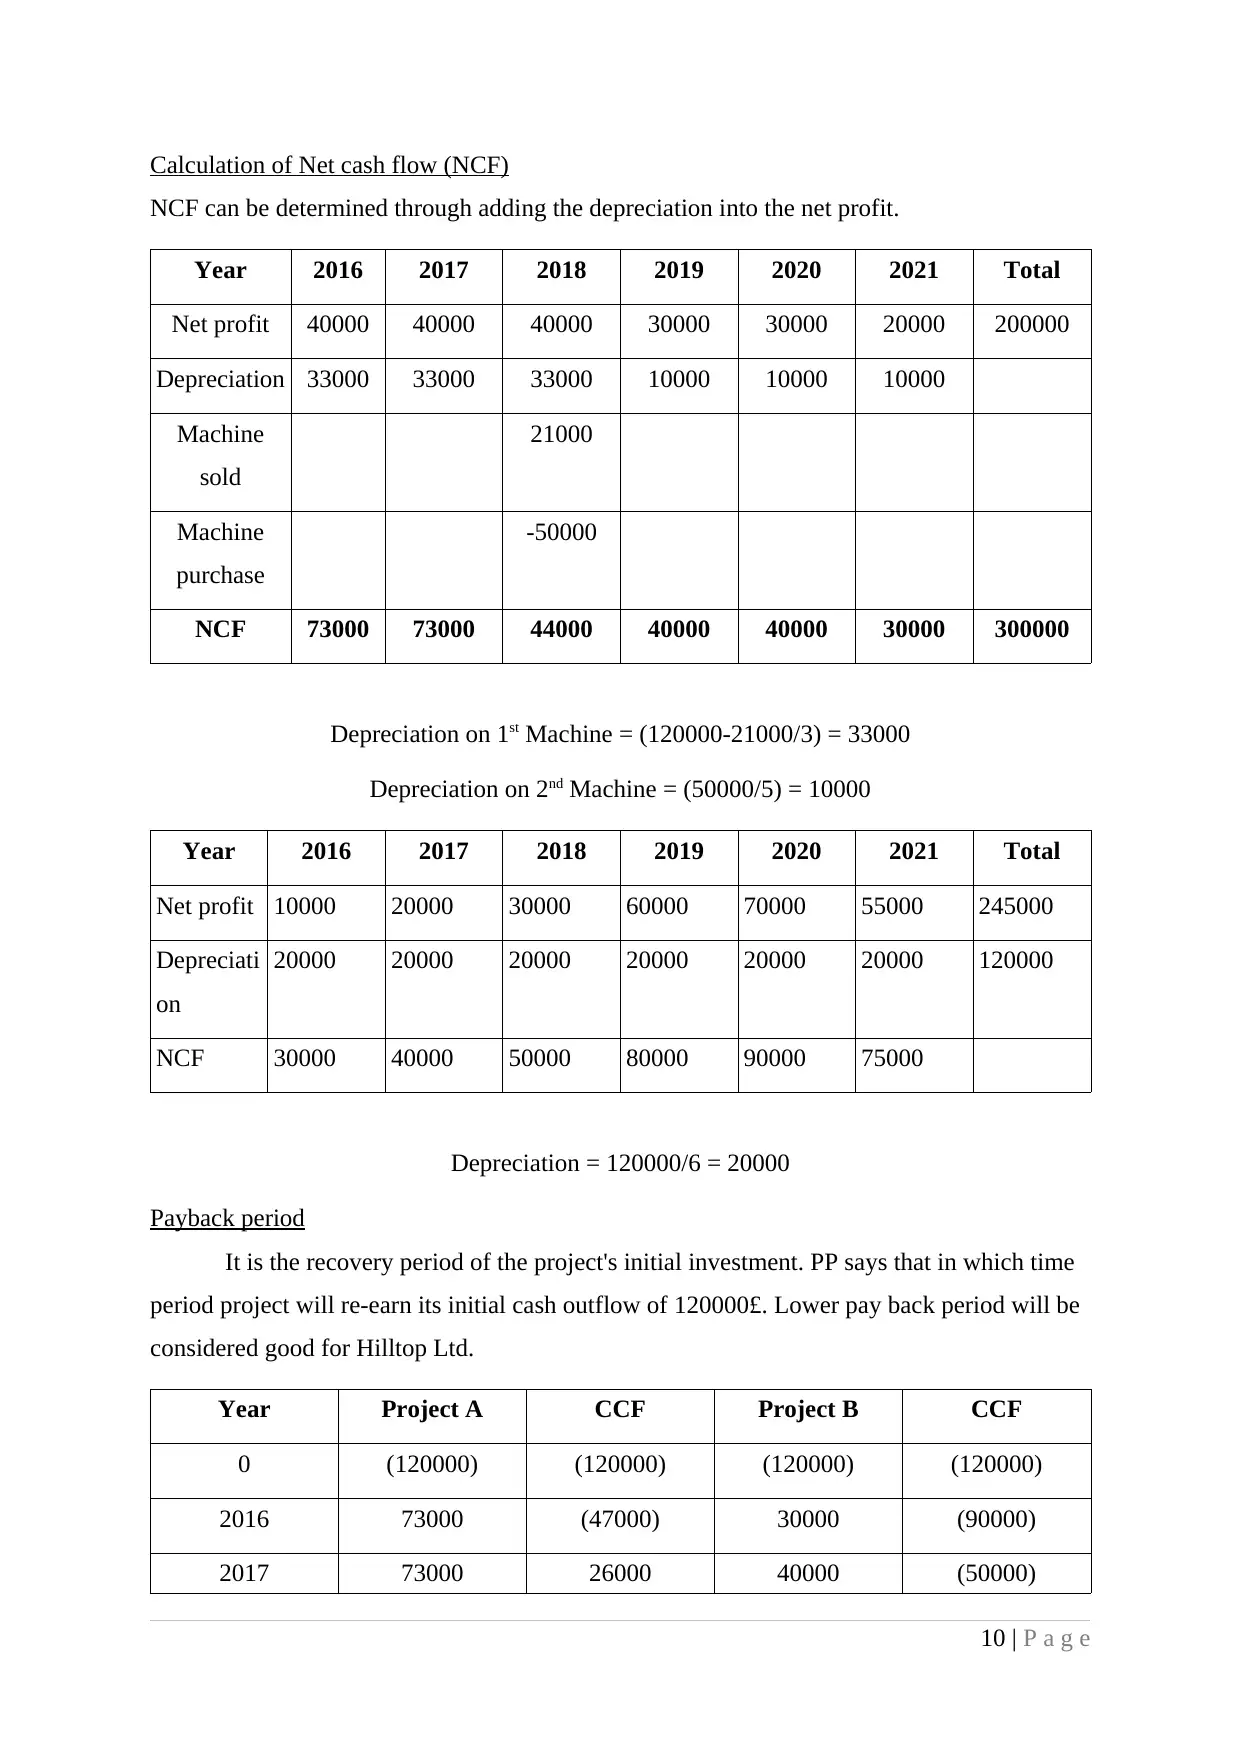
Calculation of Net cash flow (NCF)
NCF can be determined through adding the depreciation into the net profit.
Year 2016 2017 2018 2019 2020 2021 Total
Net profit 40000 40000 40000 30000 30000 20000 200000
Depreciation 33000 33000 33000 10000 10000 10000
Machine
sold
21000
Machine
purchase
-50000
NCF 73000 73000 44000 40000 40000 30000 300000
Depreciation on 1st Machine = (120000-21000/3) = 33000
Depreciation on 2nd Machine = (50000/5) = 10000
Year 2016 2017 2018 2019 2020 2021 Total
Net profit 10000 20000 30000 60000 70000 55000 245000
Depreciati
on
20000 20000 20000 20000 20000 20000 120000
NCF 30000 40000 50000 80000 90000 75000
Depreciation = 120000/6 = 20000
Payback period
It is the recovery period of the project's initial investment. PP says that in which time
period project will re-earn its initial cash outflow of 120000£. Lower pay back period will be
considered good for Hilltop Ltd.
Year Project A CCF Project B CCF
0 (120000) (120000) (120000) (120000)
2016 73000 (47000) 30000 (90000)
2017 73000 26000 40000 (50000)
10 | P a g e
Paraphrase This Document
Need a fresh take? Get an instant paraphrase of this document with our AI Paraphraser
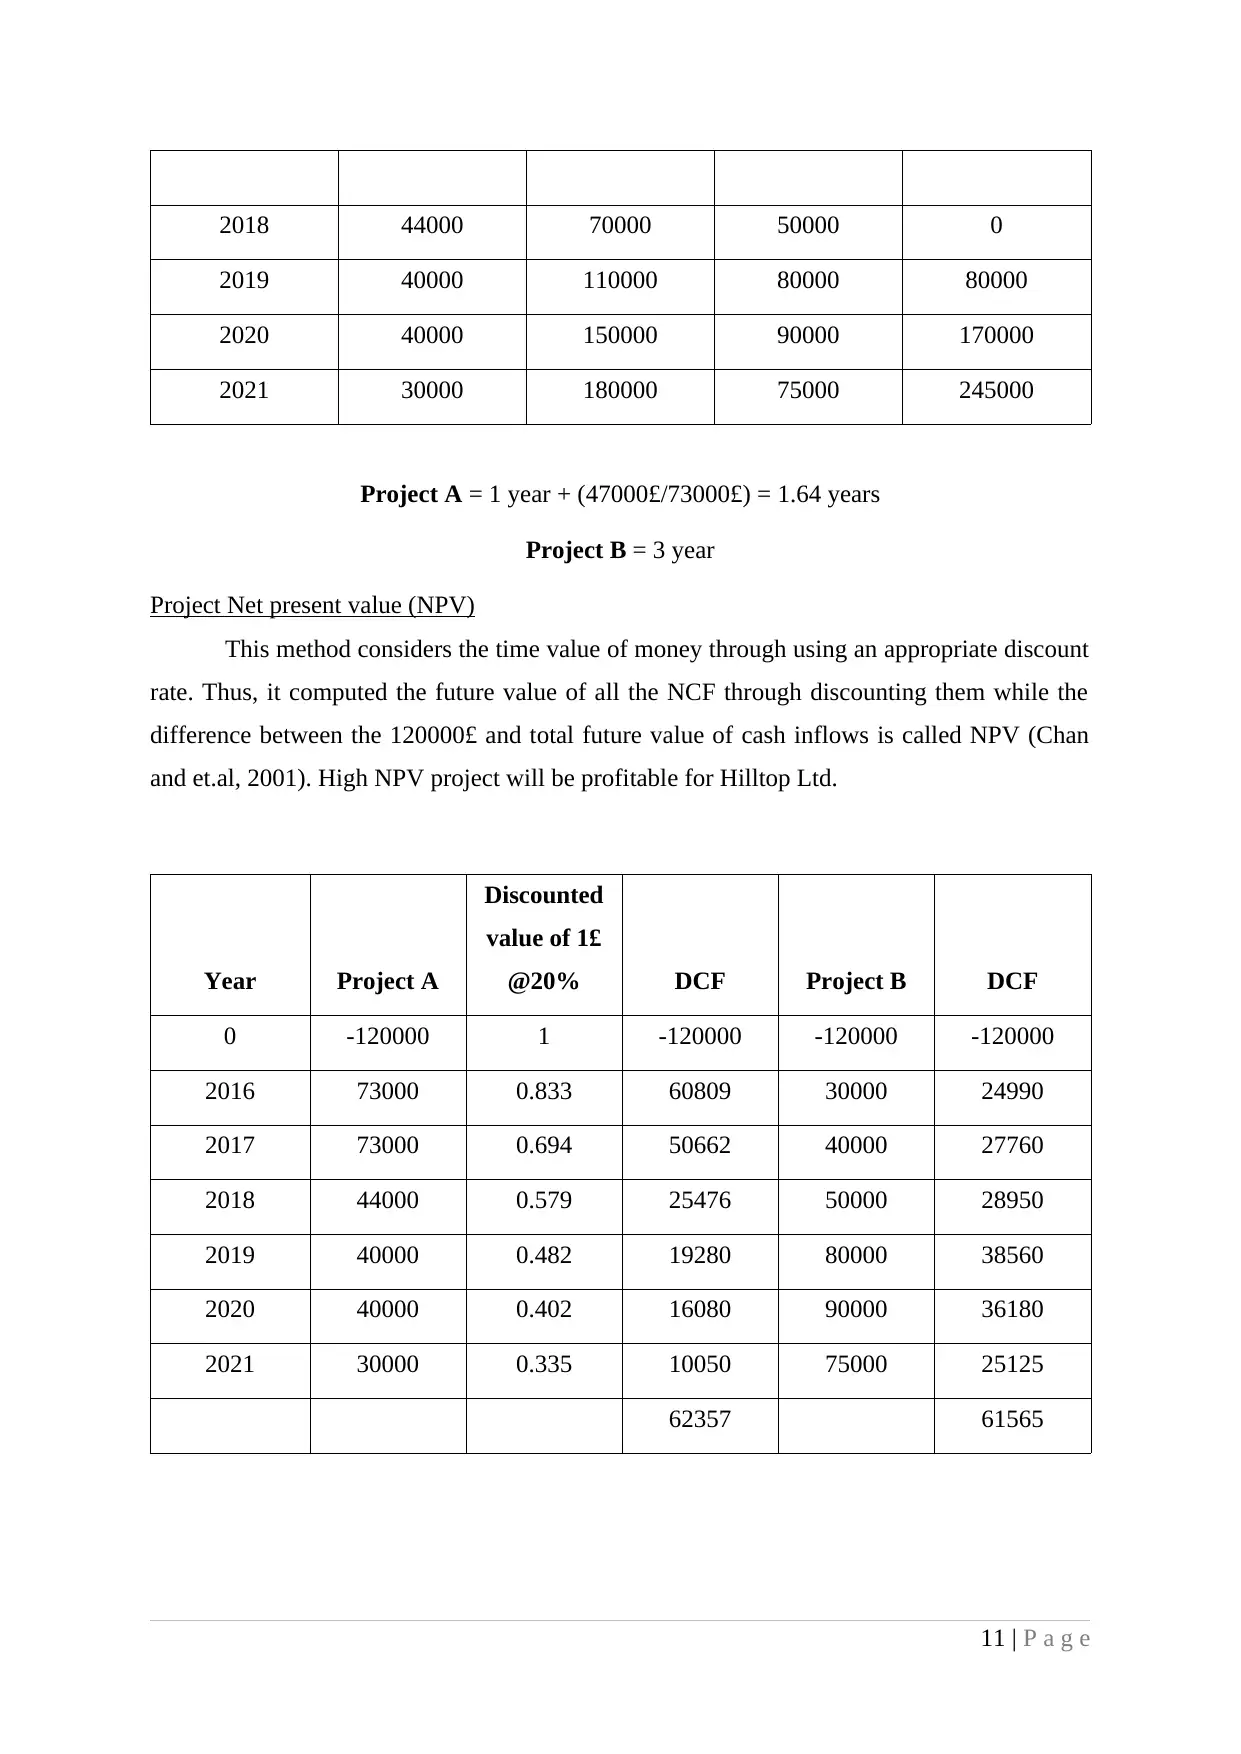
2018 44000 70000 50000 0
2019 40000 110000 80000 80000
2020 40000 150000 90000 170000
2021 30000 180000 75000 245000
Project A = 1 year + (47000£/73000£) = 1.64 years
Project B = 3 year
Project Net present value (NPV)
This method considers the time value of money through using an appropriate discount
rate. Thus, it computed the future value of all the NCF through discounting them while the
difference between the 120000£ and total future value of cash inflows is called NPV (Chan
and et.al, 2001). High NPV project will be profitable for Hilltop Ltd.
Year Project A
Discounted
value of 1£
@20% DCF Project B DCF
0 -120000 1 -120000 -120000 -120000
2016 73000 0.833 60809 30000 24990
2017 73000 0.694 50662 40000 27760
2018 44000 0.579 25476 50000 28950
2019 40000 0.482 19280 80000 38560
2020 40000 0.402 16080 90000 36180
2021 30000 0.335 10050 75000 25125
62357 61565
11 | P a g e
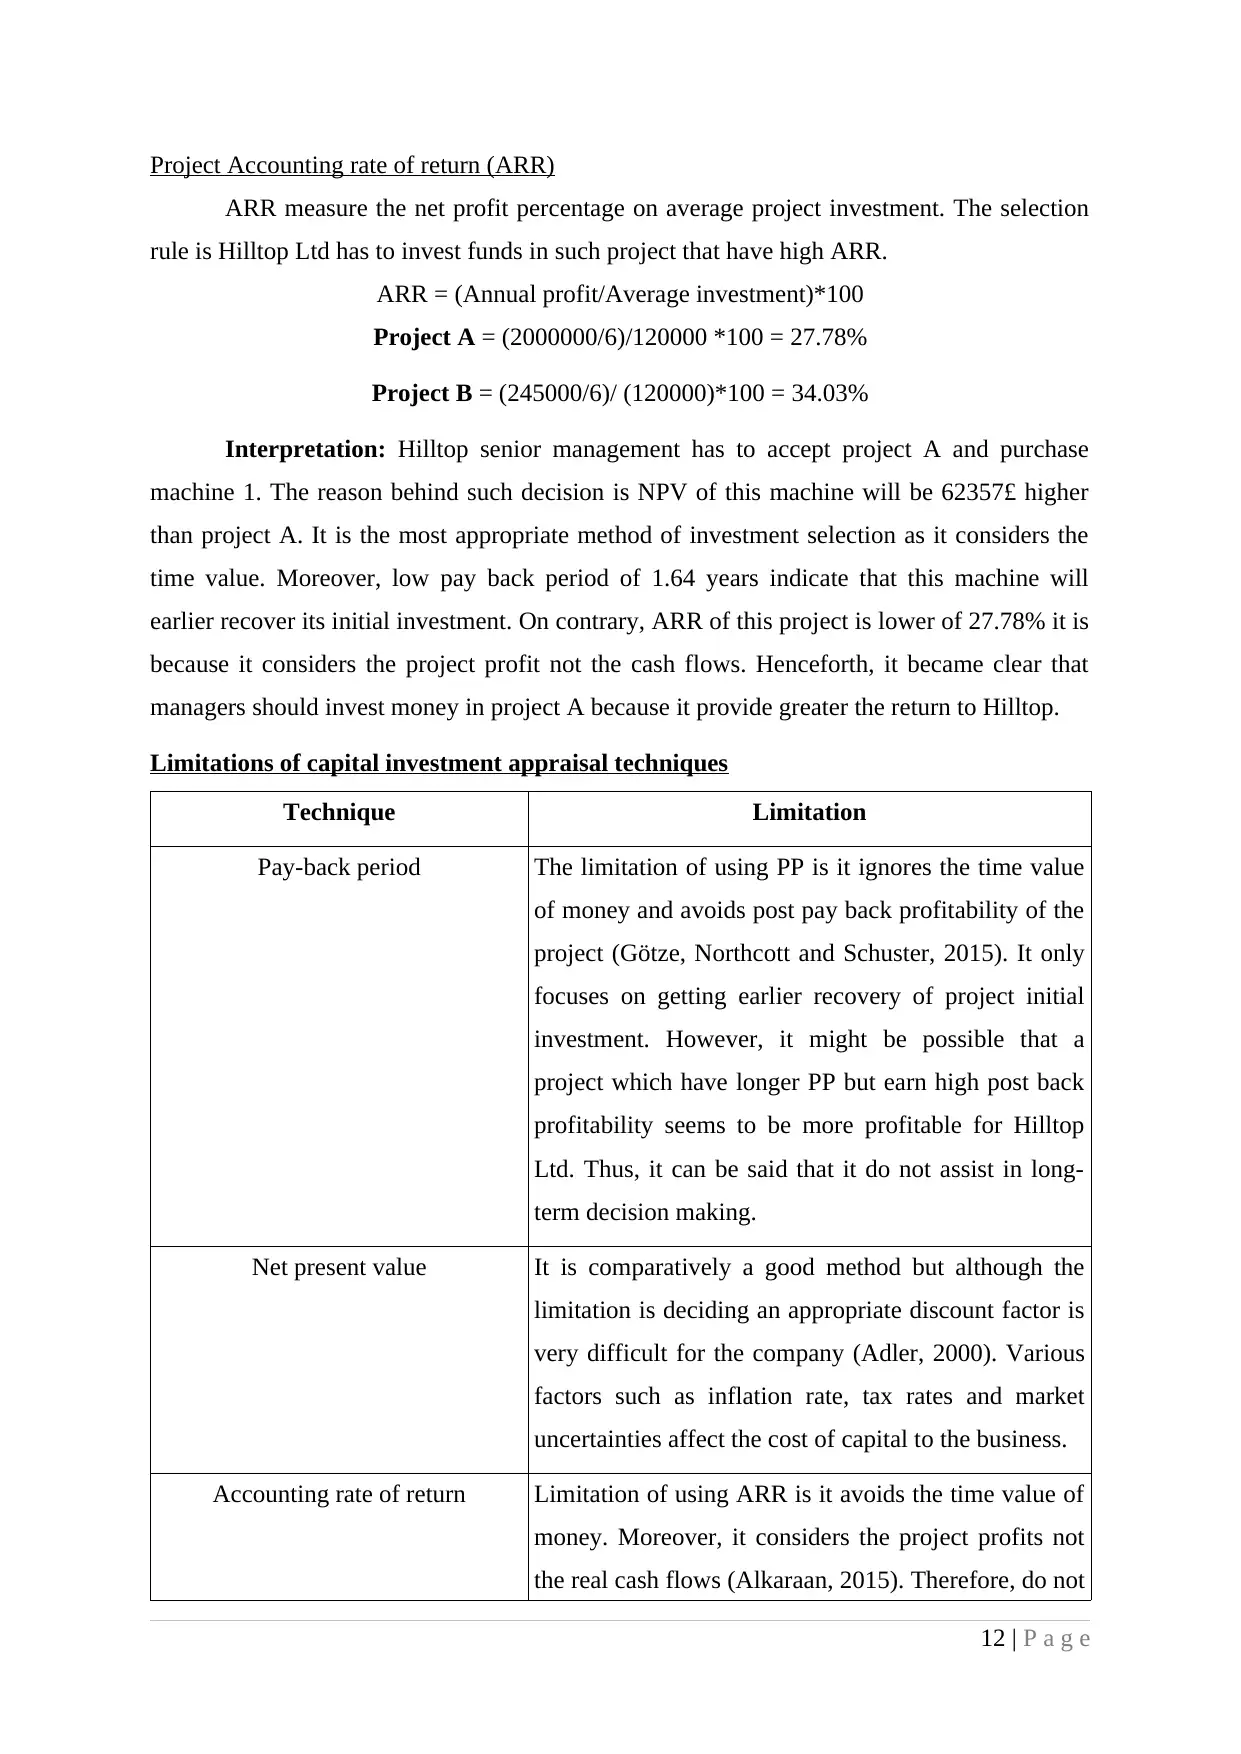
Project Accounting rate of return (ARR)
ARR measure the net profit percentage on average project investment. The selection
rule is Hilltop Ltd has to invest funds in such project that have high ARR.
ARR = (Annual profit/Average investment)*100
Project A = (2000000/6)/120000 *100 = 27.78%
Project B = (245000/6)/ (120000)*100 = 34.03%
Interpretation: Hilltop senior management has to accept project A and purchase
machine 1. The reason behind such decision is NPV of this machine will be 62357£ higher
than project A. It is the most appropriate method of investment selection as it considers the
time value. Moreover, low pay back period of 1.64 years indicate that this machine will
earlier recover its initial investment. On contrary, ARR of this project is lower of 27.78% it is
because it considers the project profit not the cash flows. Henceforth, it became clear that
managers should invest money in project A because it provide greater the return to Hilltop.
Limitations of capital investment appraisal techniques
Technique Limitation
Pay-back period The limitation of using PP is it ignores the time value
of money and avoids post pay back profitability of the
project (Götze, Northcott and Schuster, 2015). It only
focuses on getting earlier recovery of project initial
investment. However, it might be possible that a
project which have longer PP but earn high post back
profitability seems to be more profitable for Hilltop
Ltd. Thus, it can be said that it do not assist in long-
term decision making.
Net present value It is comparatively a good method but although the
limitation is deciding an appropriate discount factor is
very difficult for the company (Adler, 2000). Various
factors such as inflation rate, tax rates and market
uncertainties affect the cost of capital to the business.
Accounting rate of return Limitation of using ARR is it avoids the time value of
money. Moreover, it considers the project profits not
the real cash flows (Alkaraan, 2015). Therefore, do not
12 | P a g e
⊘ This is a preview!⊘
Do you want full access?
Subscribe today to unlock all pages.
Trusted by 1+ million students worldwide
1 out of 13
Related Documents


Your All-in-One AI-Powered Toolkit for Academic Success.
+13062052269
info@desklib.com
Available 24*7 on WhatsApp / Email
![[object Object]](/_next/static/media/star-bottom.7253800d.svg)
Unlock your academic potential
Copyright © 2020–2026 A2Z Services. All Rights Reserved. Developed and managed by ZUCOL.