Five-Year Comparative Financial Performance Analysis Report, Finance
VerifiedAdded on 2021/01/02
|33
|10470
|357
Report
AI Summary
This report presents a comprehensive financial analysis of Petronas Gas Bhd and its competitor, Sapura Energy, focusing on a five-year comparative financial performance analysis. The report begins with an introduction to financial analysis and the business environment of Petronas Gas. It then delves into a detailed examination of various financial ratios, including profitability, liquidity, capital structure, efficiency, and stock market performance ratios, calculated for both companies. The analysis includes a discussion of the ratios' formulas, calculations, and interpretations, along with tables presenting the financial data. Furthermore, the report explores alternative methods of long-term finance, considering external sources of funds, equity, and debt. It also provides recommendations on the most suitable financing method, examines the link between financing and investment decisions, and discusses the impacts of financing on the cost of capital (WACC) and the use of WACC in investment appraisal, including the link between debt finance, WACC, and NPV. The report concludes with a summary of findings, drawing conclusions about the financial strengths and weaknesses of both companies, and offering insights into investment decisions.

Financial Analysis
Management
Management
Paraphrase This Document
Need a fresh take? Get an instant paraphrase of this document with our AI Paraphraser
Table of Contents
ASSIGNMENT 1.............................................................................................................................1
INTRODUCTION...........................................................................................................................1
1. BACKGROUND AND POSITION OF THE COMPANY IN THE INDUSTRY.....................1
2. FIVE YEAR COMPARATIVE FINANCIAL PERFORMANCE ANALYSIS USING
RATIOS...........................................................................................................................................2
3. ANALYSIS OF FINANCIAL STRENGTH OF THE COMPANIES........................................9
4. PROBLEMS OR LIMITATIONS OF RATIO ANALYSIS AND ASSUMPTIONS..............11
CONCLUSION..............................................................................................................................12
ASSIGNMENT 2...........................................................................................................................12
INTRODUCTION.........................................................................................................................12
2.1 REVIEW OF 4 ALTERNATIVE METHODS OF LONG TERM FINANCE.......................13
1. External sources of long term funds......................................................................................13
2. External Equity funds and debt funds...................................................................................13
3 The ways in which an organisation may raise external equity funds.....................................14
4. The ways in which an organisation may raise debt funds.....................................................15
5. External factors to be considered in raising debt or equity funding factors..........................15
2.2 RECOMMENDATION ON WHICH FINANCE METHOD TO USE..................................16
2.3 LINK BETWEEN FINANCING AND INVESTMENT DECISION ....................................18
1. Impacts of financing on cost of capital.................................................................................18
2. Use of WACC in investment appraisal.................................................................................18
3. Link between debt finance, WACC and NPV......................................................................19
4. Recommendation...................................................................................................................19
CONCLUSION..............................................................................................................................19
REFERENCES..............................................................................................................................20
APPENDIX....................................................................................................................................23

⊘ This is a preview!⊘
Do you want full access?
Subscribe today to unlock all pages.
Trusted by 1+ million students worldwide
ASSIGNMENT 1
INTRODUCTION
Financial analysis can be defined as the process of evaluating and assessing different
aspects of a company. These are projects, budgets, financial performance etc. It is mainly used to
figure out that an organisation is in a good condition or not and also guides to evaluate
performance of the business. There are various types of analysis that are used by enterprises
these are vertical, horizontal, growth, leverage, profitability, efficiency etc. Strategic decisions
regarding investment are formed with the help of it (Aba, Badar and Hayden, 2016). Purpose of
this project report is to understand the business environment of Petronas Gas BHD which is also
known as Petroliam nasional Berhad (National Petroleum Limited) and its market position.
Another purpose is to conduct a competitive analysis of financial performance of Petronas Gas
and Sapura Energy. The detailed investigation of both the companies is done to make buying
decision of shares.
In this project report a comparative financial performance analysis is going to be
conducted for two different organisations with the help of different ratios. A summary of this
assessment, justification regarding buying decision, problems or limitations of ratio analysis and
assumptions that are made by a investor to form the decision.
1. BACKGROUND AND POSITION OF THE COMPANY IN THE
INDUSTRY
Petronas Gas Bhd is a Malaysian oil and gas organisation which was founded in year
1974 and owned by the legal authorities of Malaysia. It has ranked among world's top 500 largest
corporations. The company has also ranked as the world's 12th most profitable entity and in Asia
it is on the first number. Its headquarter is in Kuala Lumpur, Malaysia. Currently Petronas is
executing its business all around the world but mainly in its home country. The products and
services that are offered by it are petroleum, natural gas, petrochemicals, filling station and
shipping. Currently more than 51000 employees are working in the enterprise that are providing
services worldwide and strength of workforce within the nation is more than 2100. There are
various subsidiaries of the organisation these are KLCC property holdings, Petronas Gas,
Daganagan, Chemicals, Port, Misc etc. It was incorporated in year 1983 and listed on market of
Bursa Malaysia Securities Berhad in year 1995 (Background of Petronas Gas Bhd, 2019).
1
Paraphrase This Document
Need a fresh take? Get an instant paraphrase of this document with our AI Paraphraser
Position of the company is very good in its industry because it is the most profitable
organisation in whole Asia As compare to its competitor which is Sapura Energy. Petronas Gas
has high sustainability as it focuses on different key aspects such as shareholder's value, national
resources use, climate change, biodiversity, health, safety and environment, product stewardship
and societal needs that helps it to be on the top of its industry. Standard of corporate governance
of the company is also very high because the board members has achieved higher ratings for its
professionalism and business ethics wit the help of its operational activities. According to BMCC
oil and gas sector in Malaysia contributes almost 20% in its GDP and it has been forecasted that
the industry will grow with the rate of 5% annually.
2. FIVE YEAR COMPARATIVE FINANCIAL PERFORMANCE
ANALYSIS USING RATIOS
Ratio analysis: It is a process in which different types of financial information is used to
analyse performance of a company. Overall profitability, liquidity, efficiency etc. can be
determined with the help of ratios. Various types of ratios that are described below are calculated
for Petronas Gas and Sapura Energy to compare financial performance of both the companies.
Profitability ratios: These ratios are calculated to evaluate profitability of an
organisation. It helps to analyse ability of a company to generate income against its expenses and
spendings.
Gross margin ratio: This ratio is mainly used to compare gross profits of the company
with net sales. It shows the percentage of gross margin which is generated form the
revenues in a particular time period (Alviniussen and Jankensgard, 2015).
Net margin ratio: It is calculated to analyse the percentage of net profits which is
generated against the sales of an accounting year. Purpose of calculating this ratio is to
assess profitability of the company.
Return on capital employed ratio: Such type of ratio is used to determine efficiency
and profitability of an organisation against the investments that are made by it in a
particular time period. It is very important for the companies to keep their ROCE high
from the rate at which the entity borrows money.
Liquidity ratios: These ratios are mainly calculated to determine liquidity and financial
status of a company. It guides stakeholders to analyse that organisations are having appropriate
funds to operate business or not.
2
Current ratio: It shows capability of a company to pay out all its short term liabilities
with the help of current assets in one year. If it varies from 1.5 to 2 then it will be
considered as a good ratio.
Quick ratio: It calculated to determine the ability of the company to pay all the short
term liabilities with the help of quick assets in less then one year. Ideal quick ratio is 1 for
all the companies (Arun, Almahrog and Aribi, 2015).
Capital structure or gearing ratios: These ratios are calculated by the organisations in
order to compare equities with different aspects of balance sheet such as debts, total assets etc.
Debt equity ratio: This ratio is used to analyse the proportion of equities and external
debts that are invested in the organisation's operational activities. The ideal debt equity
ratio for gas industry is 1 which means that shareholder's funds and debts are equally
used to execute business.
Equity ratio: It is calculated to determine relationship between total assets and equities
of a company which shows that percentage of equities that are involved in assets.
Efficiency ratios: Such type of ratios are calculated to analyse the way in which a
company uses all its liabilities and assets internally. It helps to determine overall efficiency of the
organisation to enhance sales.
Total asset turnover ratio: It helps to analyse the ability to total assets to increase sales
of the organisation.
Fixed asset turnover ratio: It is used to calculate the percentage of sales which is
generate with the help of fixed assets.
Inventory turnover ratio: This ratio is used to measure the compatibility of a company
to manage all its inventory.
Stock market performance ratios: These ratios are calculated to analyse performance of
the company. All of them guides the investors to forecast the returns that can be provided by the
organisation in future on their investment (Blum and Dacorogna, 2014).
Price earning ratio: It shows the relation between share prices and earning per share of a
company. It helps the investors to estimate the rate of return that can be acquired by them
in future. It is forecasted with the help of previous year data. For gas industry the ideal
ratio is 25.4.
3
⊘ This is a preview!⊘
Do you want full access?
Subscribe today to unlock all pages.
Trusted by 1+ million students worldwide
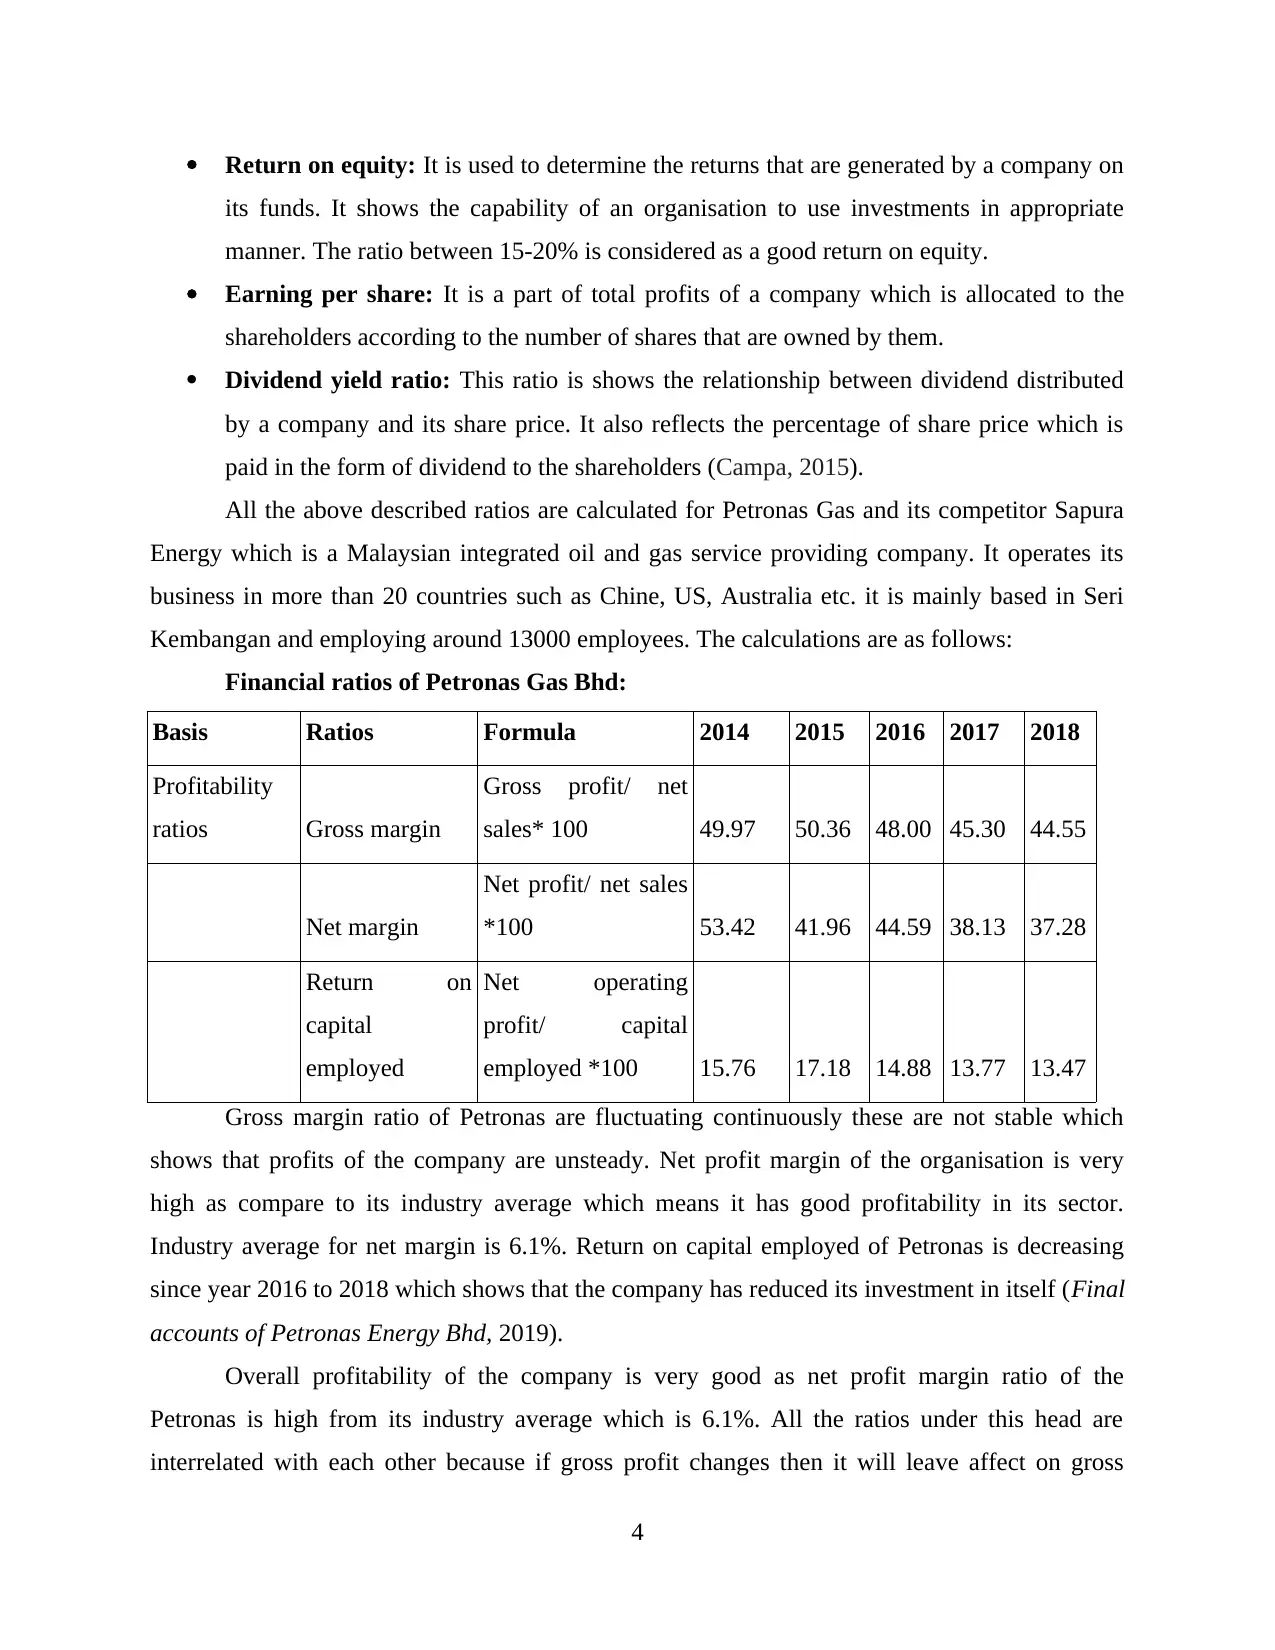
Return on equity: It is used to determine the returns that are generated by a company on
its funds. It shows the capability of an organisation to use investments in appropriate
manner. The ratio between 15-20% is considered as a good return on equity.
Earning per share: It is a part of total profits of a company which is allocated to the
shareholders according to the number of shares that are owned by them.
Dividend yield ratio: This ratio is shows the relationship between dividend distributed
by a company and its share price. It also reflects the percentage of share price which is
paid in the form of dividend to the shareholders (Campa, 2015).
All the above described ratios are calculated for Petronas Gas and its competitor Sapura
Energy which is a Malaysian integrated oil and gas service providing company. It operates its
business in more than 20 countries such as Chine, US, Australia etc. it is mainly based in Seri
Kembangan and employing around 13000 employees. The calculations are as follows:
Financial ratios of Petronas Gas Bhd:
Basis Ratios Formula 2014 2015 2016 2017 2018
Profitability
ratios Gross margin
Gross profit/ net
sales* 100 49.97 50.36 48.00 45.30 44.55
Net margin
Net profit/ net sales
*100 53.42 41.96 44.59 38.13 37.28
Return on
capital
employed
Net operating
profit/ capital
employed *100 15.76 17.18 14.88 13.77 13.47
Gross margin ratio of Petronas are fluctuating continuously these are not stable which
shows that profits of the company are unsteady. Net profit margin of the organisation is very
high as compare to its industry average which means it has good profitability in its sector.
Industry average for net margin is 6.1%. Return on capital employed of Petronas is decreasing
since year 2016 to 2018 which shows that the company has reduced its investment in itself (Final
accounts of Petronas Energy Bhd, 2019).
Overall profitability of the company is very good as net profit margin ratio of the
Petronas is high from its industry average which is 6.1%. All the ratios under this head are
interrelated with each other because if gross profit changes then it will leave affect on gross
4
Paraphrase This Document
Need a fresh take? Get an instant paraphrase of this document with our AI Paraphraser
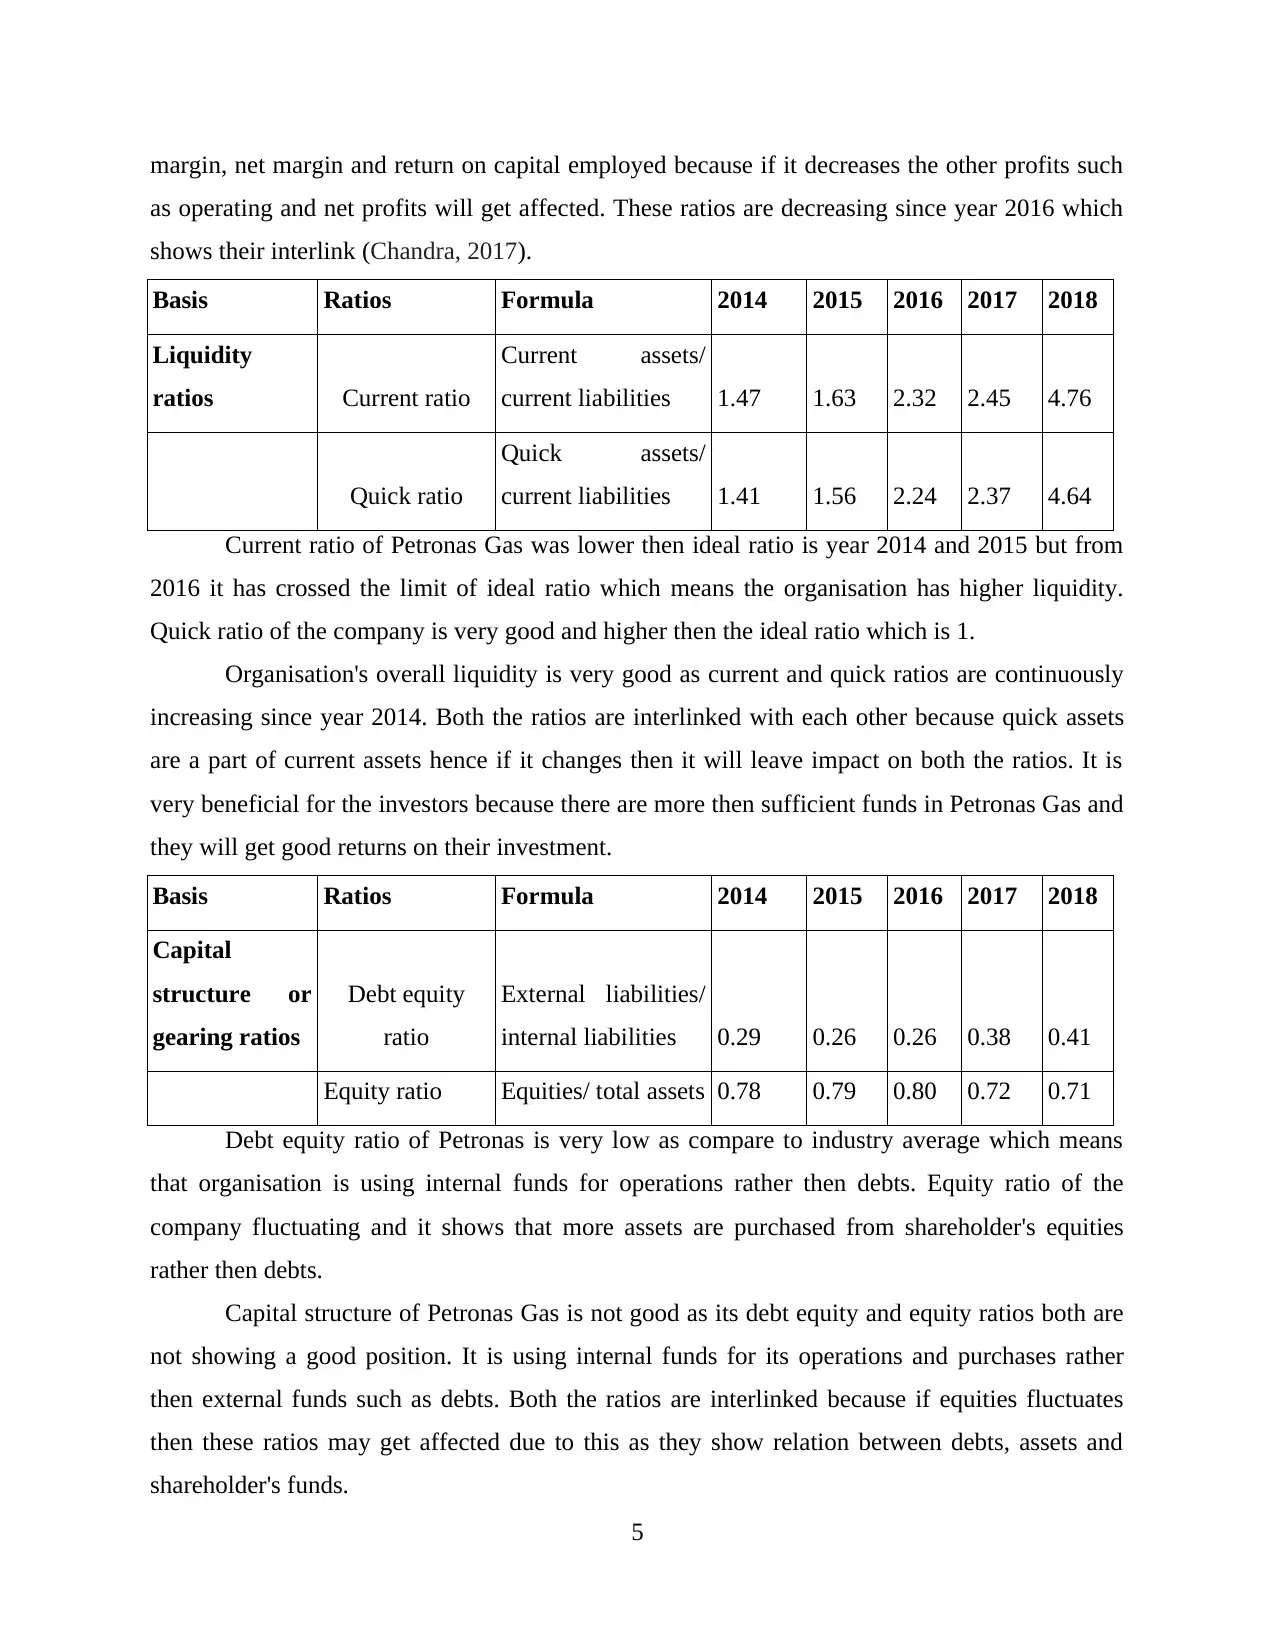
margin, net margin and return on capital employed because if it decreases the other profits such
as operating and net profits will get affected. These ratios are decreasing since year 2016 which
shows their interlink (Chandra, 2017).
Basis Ratios Formula 2014 2015 2016 2017 2018
Liquidity
ratios Current ratio
Current assets/
current liabilities 1.47 1.63 2.32 2.45 4.76
Quick ratio
Quick assets/
current liabilities 1.41 1.56 2.24 2.37 4.64
Current ratio of Petronas Gas was lower then ideal ratio is year 2014 and 2015 but from
2016 it has crossed the limit of ideal ratio which means the organisation has higher liquidity.
Quick ratio of the company is very good and higher then the ideal ratio which is 1.
Organisation's overall liquidity is very good as current and quick ratios are continuously
increasing since year 2014. Both the ratios are interlinked with each other because quick assets
are a part of current assets hence if it changes then it will leave impact on both the ratios. It is
very beneficial for the investors because there are more then sufficient funds in Petronas Gas and
they will get good returns on their investment.
Basis Ratios Formula 2014 2015 2016 2017 2018
Capital
structure or
gearing ratios
Debt equity
ratio
External liabilities/
internal liabilities 0.29 0.26 0.26 0.38 0.41
Equity ratio Equities/ total assets 0.78 0.79 0.80 0.72 0.71
Debt equity ratio of Petronas is very low as compare to industry average which means
that organisation is using internal funds for operations rather then debts. Equity ratio of the
company fluctuating and it shows that more assets are purchased from shareholder's equities
rather then debts.
Capital structure of Petronas Gas is not good as its debt equity and equity ratios both are
not showing a good position. It is using internal funds for its operations and purchases rather
then external funds such as debts. Both the ratios are interlinked because if equities fluctuates
then these ratios may get affected due to this as they show relation between debts, assets and
shareholder's funds.
5
Basis Ratios Formula 2014 2015 2016 2017 2018
Efficiency
ratios
Total asset
turnover Sales/ total assets 0.29 0.33 0.31 0.28 0.27
Fixed asset
turnover Sales/ fixed assets 0.34 0.37 0.36 0.33 0.34
Inventory
turnover ratio Sales/ Inventory 99.79 102.14 96.87 67.07 71.79
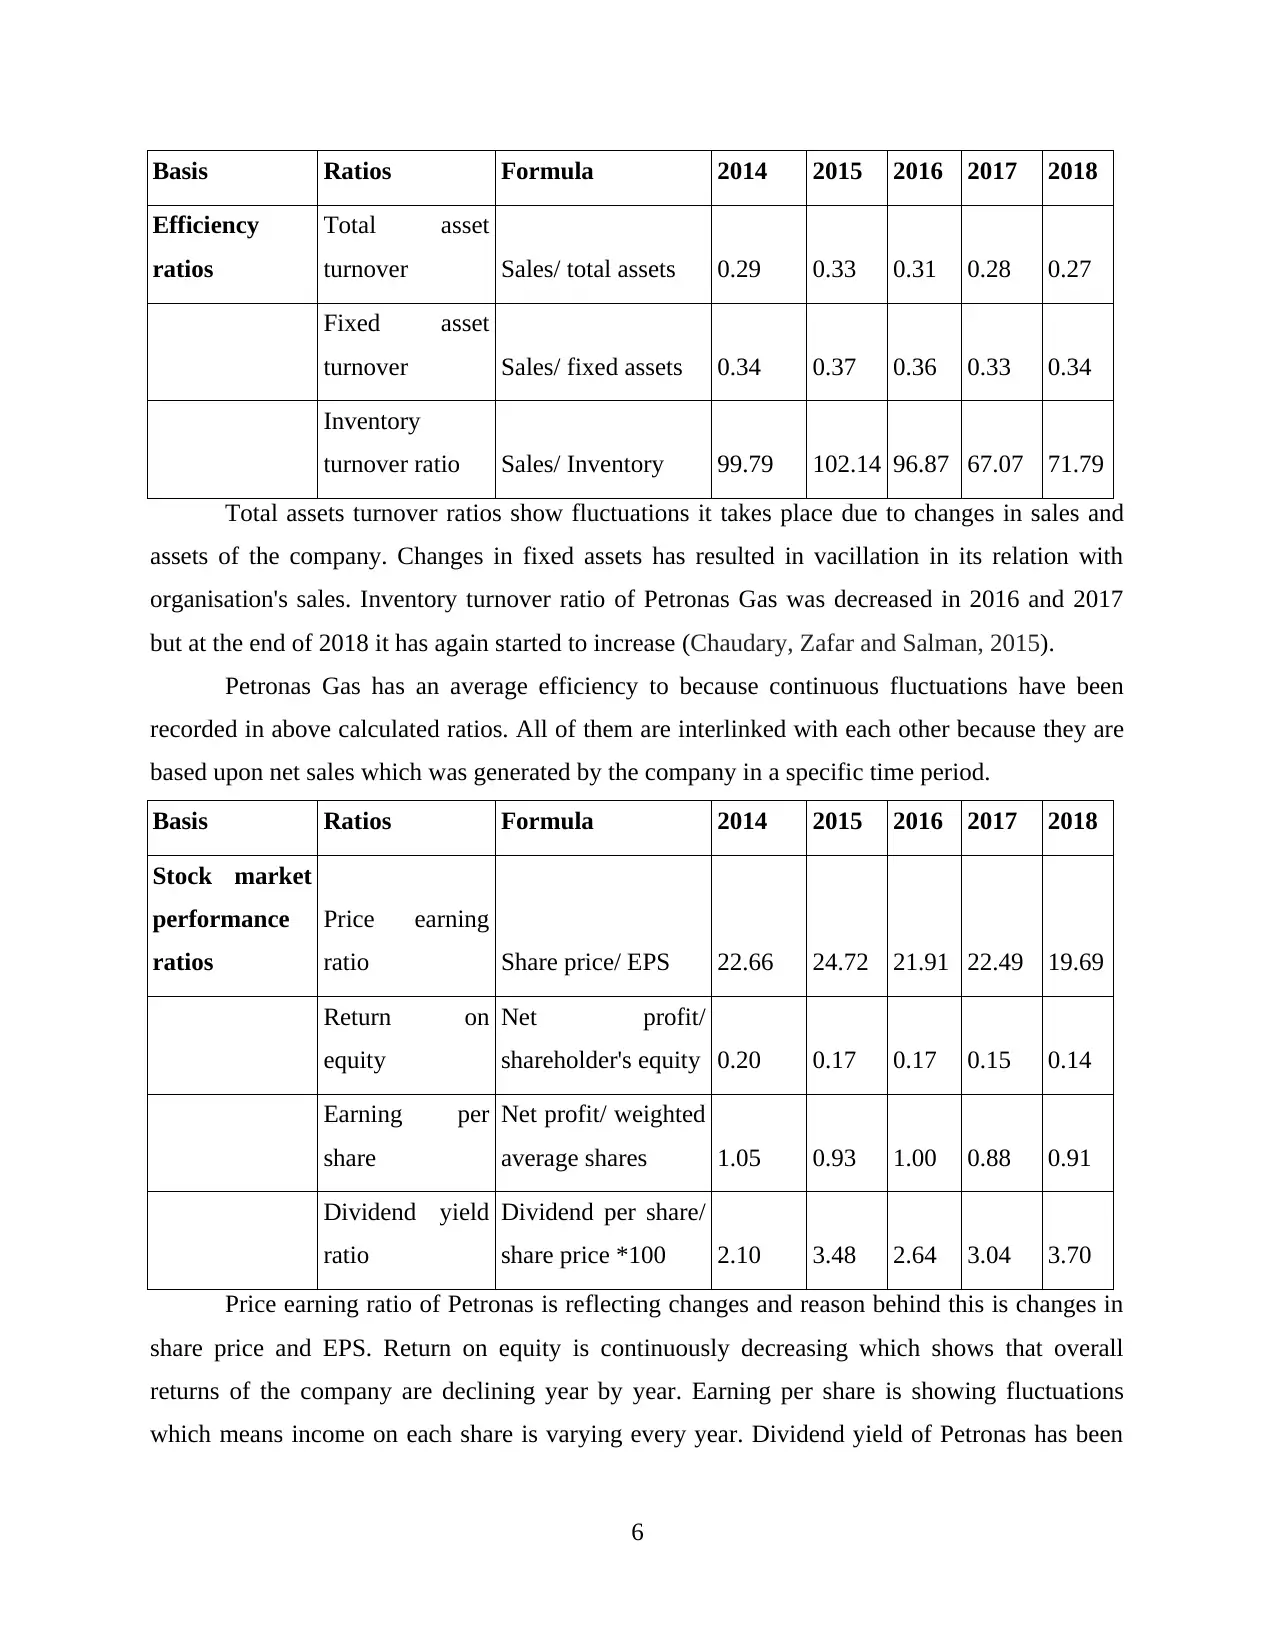
Total assets turnover ratios show fluctuations it takes place due to changes in sales and
assets of the company. Changes in fixed assets has resulted in vacillation in its relation with
organisation's sales. Inventory turnover ratio of Petronas Gas was decreased in 2016 and 2017
but at the end of 2018 it has again started to increase (Chaudary, Zafar and Salman, 2015).
Petronas Gas has an average efficiency to because continuous fluctuations have been
recorded in above calculated ratios. All of them are interlinked with each other because they are
based upon net sales which was generated by the company in a specific time period.
Basis Ratios Formula 2014 2015 2016 2017 2018
Stock market
performance
ratios
Price earning
ratio Share price/ EPS 22.66 24.72 21.91 22.49 19.69
Return on
equity
Net profit/
shareholder's equity 0.20 0.17 0.17 0.15 0.14
Earning per
share
Net profit/ weighted
average shares 1.05 0.93 1.00 0.88 0.91
Dividend yield
ratio
Dividend per share/
share price *100 2.10 3.48 2.64 3.04 3.70
Price earning ratio of Petronas is reflecting changes and reason behind this is changes in
share price and EPS. Return on equity is continuously decreasing which shows that overall
returns of the company are declining year by year. Earning per share is showing fluctuations
which means income on each share is varying every year. Dividend yield of Petronas has been
6
Efficiency
ratios
Total asset
turnover Sales/ total assets 0.29 0.33 0.31 0.28 0.27
Fixed asset
turnover Sales/ fixed assets 0.34 0.37 0.36 0.33 0.34
Inventory
turnover ratio Sales/ Inventory 99.79 102.14 96.87 67.07 71.79
Total assets turnover ratios show fluctuations it takes place due to changes in sales and
assets of the company. Changes in fixed assets has resulted in vacillation in its relation with
organisation's sales. Inventory turnover ratio of Petronas Gas was decreased in 2016 and 2017
but at the end of 2018 it has again started to increase (Chaudary, Zafar and Salman, 2015).
Petronas Gas has an average efficiency to because continuous fluctuations have been
recorded in above calculated ratios. All of them are interlinked with each other because they are
based upon net sales which was generated by the company in a specific time period.
Basis Ratios Formula 2014 2015 2016 2017 2018
Stock market
performance
ratios
Price earning
ratio Share price/ EPS 22.66 24.72 21.91 22.49 19.69
Return on
equity
Net profit/
shareholder's equity 0.20 0.17 0.17 0.15 0.14
Earning per
share
Net profit/ weighted
average shares 1.05 0.93 1.00 0.88 0.91
Dividend yield
ratio
Dividend per share/
share price *100 2.10 3.48 2.64 3.04 3.70
Price earning ratio of Petronas is reflecting changes and reason behind this is changes in
share price and EPS. Return on equity is continuously decreasing which shows that overall
returns of the company are declining year by year. Earning per share is showing fluctuations
which means income on each share is varying every year. Dividend yield of Petronas has been
6
⊘ This is a preview!⊘
Do you want full access?
Subscribe today to unlock all pages.
Trusted by 1+ million students worldwide
increased in 2017 and 2018 which means in this period higher incomes are received by the
external parties of the company as compare to previous years.
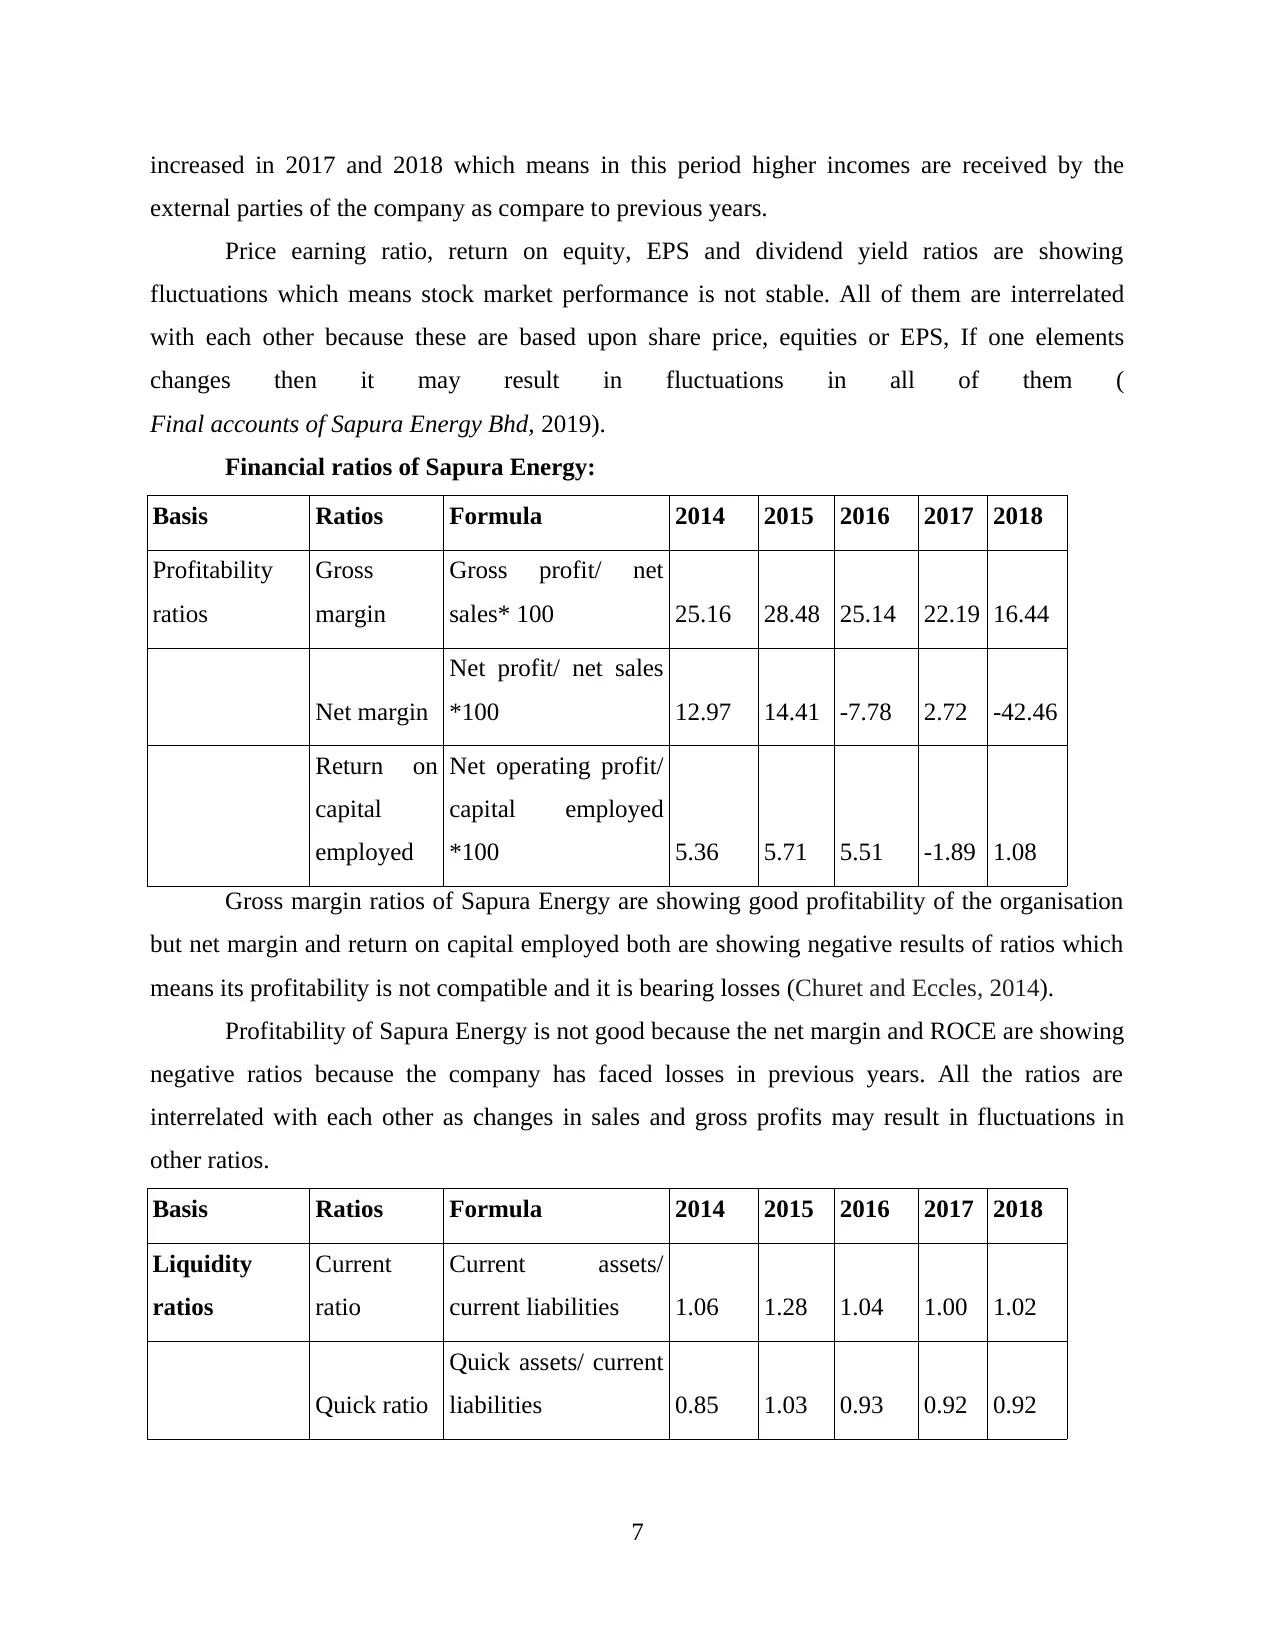
Price earning ratio, return on equity, EPS and dividend yield ratios are showing
fluctuations which means stock market performance is not stable. All of them are interrelated
with each other because these are based upon share price, equities or EPS, If one elements
changes then it may result in fluctuations in all of them (
Final accounts of Sapura Energy Bhd, 2019).
Financial ratios of Sapura Energy:
Basis Ratios Formula 2014 2015 2016 2017 2018
Profitability
ratios
Gross
margin
Gross profit/ net
sales* 100 25.16 28.48 25.14 22.19 16.44
Net margin
Net profit/ net sales
*100 12.97 14.41 -7.78 2.72 -42.46
Return on
capital
employed
Net operating profit/
capital employed
*100 5.36 5.71 5.51 -1.89 1.08
Gross margin ratios of Sapura Energy are showing good profitability of the organisation
but net margin and return on capital employed both are showing negative results of ratios which
means its profitability is not compatible and it is bearing losses (Churet and Eccles, 2014).
Profitability of Sapura Energy is not good because the net margin and ROCE are showing
negative ratios because the company has faced losses in previous years. All the ratios are
interrelated with each other as changes in sales and gross profits may result in fluctuations in
other ratios.
Basis Ratios Formula 2014 2015 2016 2017 2018
Liquidity
ratios
Current
ratio
Current assets/
current liabilities 1.06 1.28 1.04 1.00 1.02
Quick ratio
Quick assets/ current
liabilities 0.85 1.03 0.93 0.92 0.92
7
external parties of the company as compare to previous years.
Price earning ratio, return on equity, EPS and dividend yield ratios are showing
fluctuations which means stock market performance is not stable. All of them are interrelated
with each other because these are based upon share price, equities or EPS, If one elements
changes then it may result in fluctuations in all of them (
Final accounts of Sapura Energy Bhd, 2019).
Financial ratios of Sapura Energy:
Basis Ratios Formula 2014 2015 2016 2017 2018
Profitability
ratios
Gross
margin
Gross profit/ net
sales* 100 25.16 28.48 25.14 22.19 16.44
Net margin
Net profit/ net sales
*100 12.97 14.41 -7.78 2.72 -42.46
Return on
capital
employed
Net operating profit/
capital employed
*100 5.36 5.71 5.51 -1.89 1.08
Gross margin ratios of Sapura Energy are showing good profitability of the organisation
but net margin and return on capital employed both are showing negative results of ratios which
means its profitability is not compatible and it is bearing losses (Churet and Eccles, 2014).
Profitability of Sapura Energy is not good because the net margin and ROCE are showing
negative ratios because the company has faced losses in previous years. All the ratios are
interrelated with each other as changes in sales and gross profits may result in fluctuations in
other ratios.
Basis Ratios Formula 2014 2015 2016 2017 2018
Liquidity
ratios
Current
ratio
Current assets/
current liabilities 1.06 1.28 1.04 1.00 1.02
Quick ratio
Quick assets/ current
liabilities 0.85 1.03 0.93 0.92 0.92
7
Paraphrase This Document
Need a fresh take? Get an instant paraphrase of this document with our AI Paraphraser
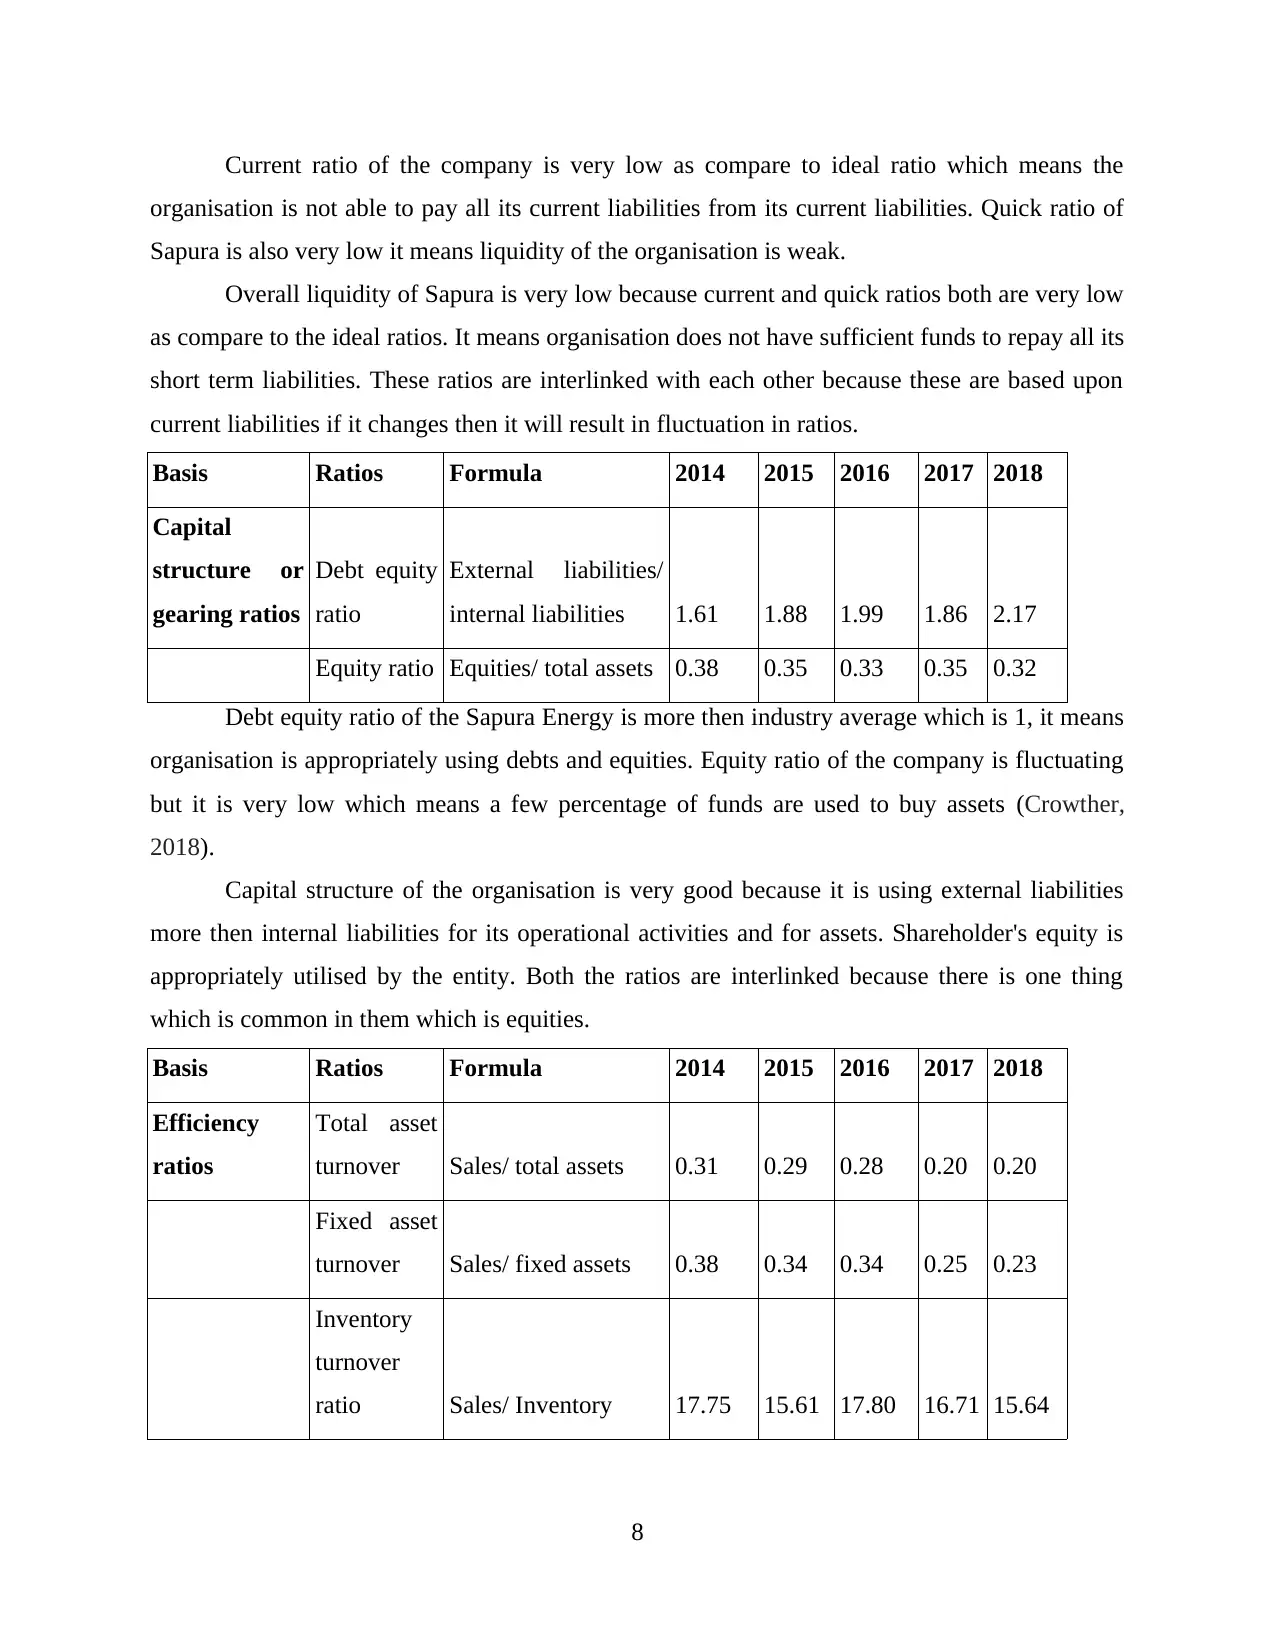
Current ratio of the company is very low as compare to ideal ratio which means the
organisation is not able to pay all its current liabilities from its current liabilities. Quick ratio of
Sapura is also very low it means liquidity of the organisation is weak.
Overall liquidity of Sapura is very low because current and quick ratios both are very low
as compare to the ideal ratios. It means organisation does not have sufficient funds to repay all its
short term liabilities. These ratios are interlinked with each other because these are based upon
current liabilities if it changes then it will result in fluctuation in ratios.
Basis Ratios Formula 2014 2015 2016 2017 2018
Capital
structure or
gearing ratios
Debt equity
ratio
External liabilities/
internal liabilities 1.61 1.88 1.99 1.86 2.17
Equity ratio Equities/ total assets 0.38 0.35 0.33 0.35 0.32
Debt equity ratio of the Sapura Energy is more then industry average which is 1, it means
organisation is appropriately using debts and equities. Equity ratio of the company is fluctuating
but it is very low which means a few percentage of funds are used to buy assets (Crowther,
2018).
Capital structure of the organisation is very good because it is using external liabilities
more then internal liabilities for its operational activities and for assets. Shareholder's equity is
appropriately utilised by the entity. Both the ratios are interlinked because there is one thing
which is common in them which is equities.
Basis Ratios Formula 2014 2015 2016 2017 2018
Efficiency
ratios
Total asset
turnover Sales/ total assets 0.31 0.29 0.28 0.20 0.20
Fixed asset
turnover Sales/ fixed assets 0.38 0.34 0.34 0.25 0.23
Inventory
turnover
ratio Sales/ Inventory 17.75 15.61 17.80 16.71 15.64
8
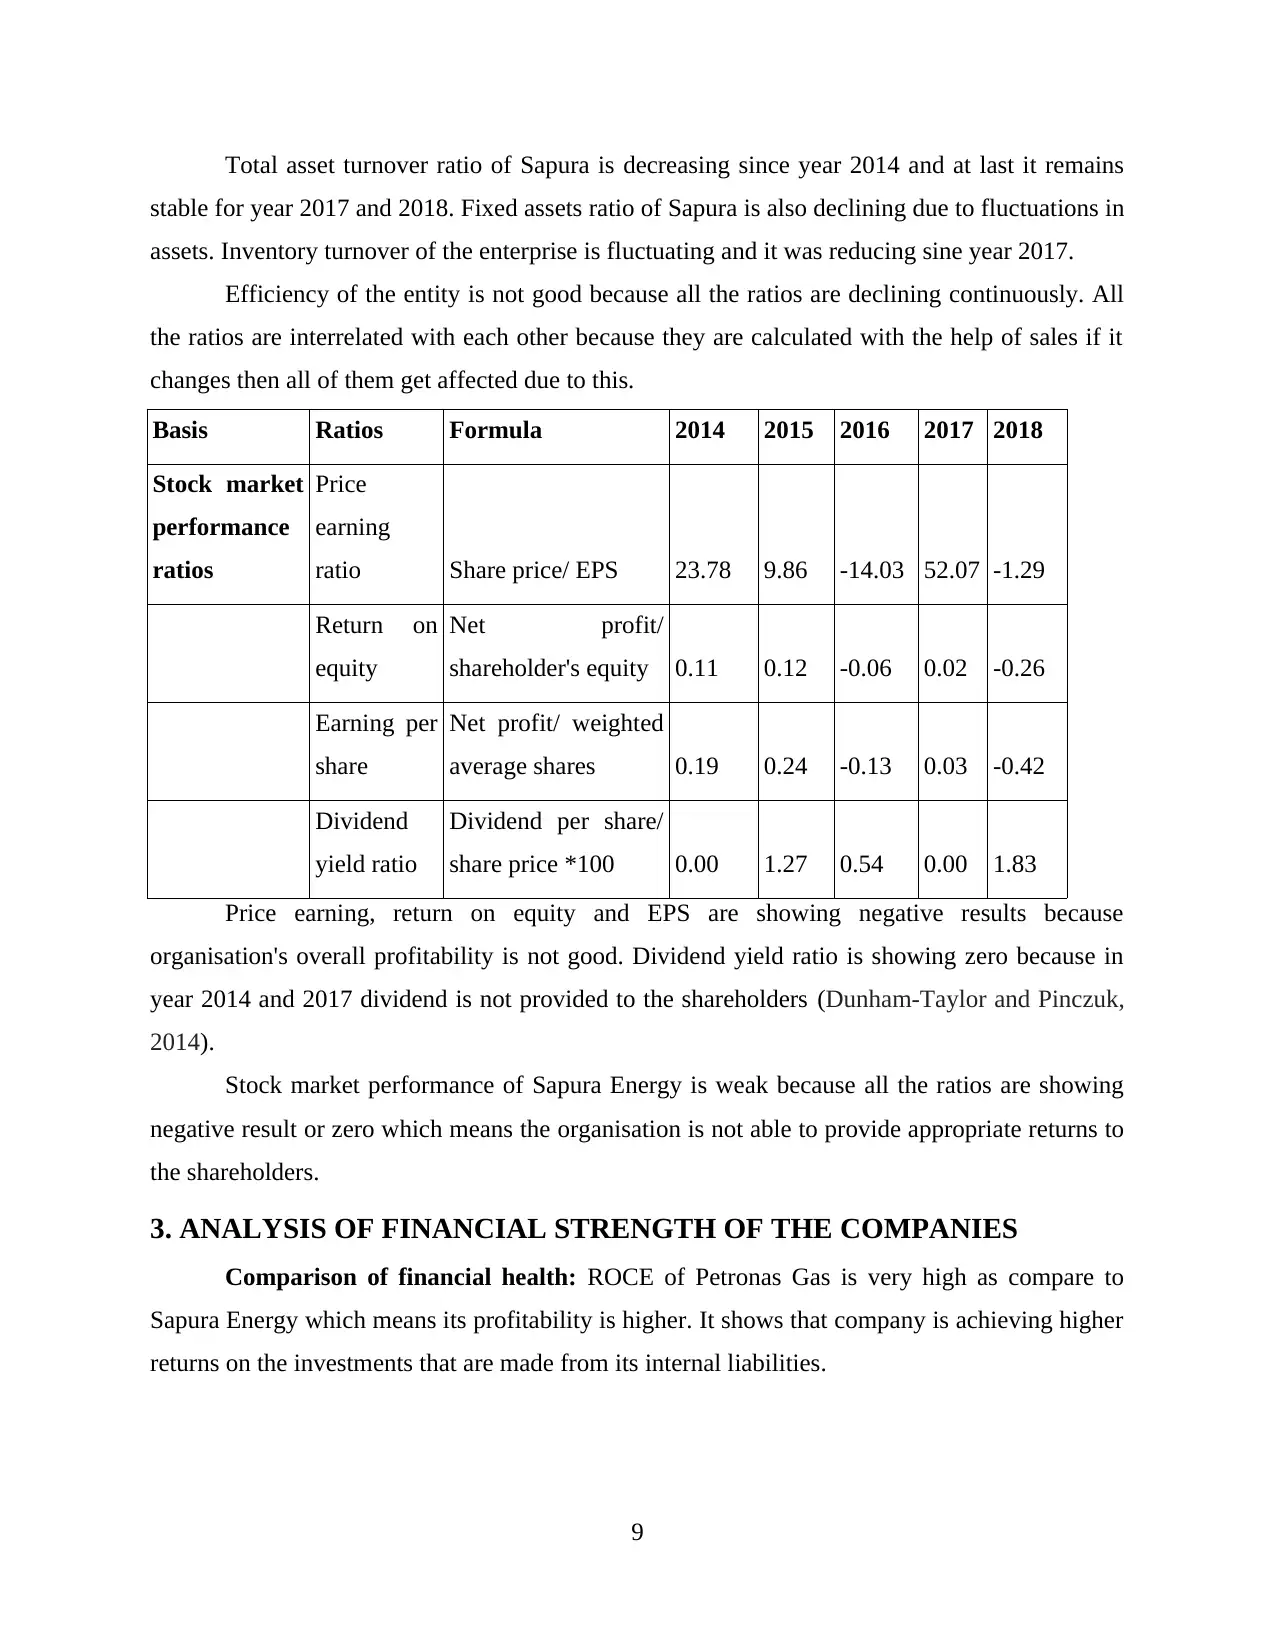
Total asset turnover ratio of Sapura is decreasing since year 2014 and at last it remains
stable for year 2017 and 2018. Fixed assets ratio of Sapura is also declining due to fluctuations in
assets. Inventory turnover of the enterprise is fluctuating and it was reducing sine year 2017.
Efficiency of the entity is not good because all the ratios are declining continuously. All
the ratios are interrelated with each other because they are calculated with the help of sales if it
changes then all of them get affected due to this.
Basis Ratios Formula 2014 2015 2016 2017 2018
Stock market
performance
ratios
Price
earning
ratio Share price/ EPS 23.78 9.86 -14.03 52.07 -1.29
Return on
equity
Net profit/
shareholder's equity 0.11 0.12 -0.06 0.02 -0.26
Earning per
share
Net profit/ weighted
average shares 0.19 0.24 -0.13 0.03 -0.42
Dividend
yield ratio
Dividend per share/
share price *100 0.00 1.27 0.54 0.00 1.83
Price earning, return on equity and EPS are showing negative results because
organisation's overall profitability is not good. Dividend yield ratio is showing zero because in
year 2014 and 2017 dividend is not provided to the shareholders (Dunham-Taylor and Pinczuk,
2014).
Stock market performance of Sapura Energy is weak because all the ratios are showing
negative result or zero which means the organisation is not able to provide appropriate returns to
the shareholders.
3. ANALYSIS OF FINANCIAL STRENGTH OF THE COMPANIES
Comparison of financial health: ROCE of Petronas Gas is very high as compare to
Sapura Energy which means its profitability is higher. It shows that company is achieving higher
returns on the investments that are made from its internal liabilities.
9
⊘ This is a preview!⊘
Do you want full access?
Subscribe today to unlock all pages.
Trusted by 1+ million students worldwide
1 out of 33
Related Documents


Your All-in-One AI-Powered Toolkit for Academic Success.
+13062052269
info@desklib.com
Available 24*7 on WhatsApp / Email
![[object Object]](/_next/static/media/star-bottom.7253800d.svg)
Unlock your academic potential
Copyright © 2020–2026 A2Z Services. All Rights Reserved. Developed and managed by ZUCOL.