PAA209 Financial Reporting: Ryanair and Easyjet Comparison
VerifiedAdded on 2019/12/17
|17
|3238
|316
Report
AI Summary
This financial report provides a detailed analysis of Ryanair and Easyjet, two major low-cost carriers in the UK and Europe. The report begins with an introduction to investment analysis and then delves into the profitability of both airlines, examining gross profit, net profit, and operating profit ratios from 2012 to 2015. The analysis includes visual representations such as figures and tables to illustrate the trends. The report then shifts to investor performance indicators, including debt-equity ratio, earnings per share (EPS), and price-earnings ratio (P/E ratio) for both companies, providing interpretations of each ratio's significance. A comparison and contrast of profitability between the two companies is presented, along with comparative charts. The report concludes with a summary of findings, recommendations for investment decisions, and a list of references.
FINANCIAL REPORTING
Paraphrase This Document
Need a fresh take? Get an instant paraphrase of this document with our AI Paraphraser
TABLE OF CONTENTS
INTRODUCTION...........................................................................................................................3
Profitability analysis of Ryan air and Easy jet.............................................................................3
Investor performance indicator for Ryanair and Easyjet.............................................................8
Comparison and contrast of profitability between two companies...........................................12
Compare and contrast investor performnace ratio of Ryanair and Easyjet...............................14
CONCLUSION..............................................................................................................................16
Recommendation...........................................................................................................................16
REFERNECES..............................................................................................................................17
Figure 1Gross profit ratio of Ryanair..............................................................................................4
Figure 2 Net profit ratio of Ryanair.................................................................................................4
Figure 3Operating ratio of Ryanair..................................................................................................5
Figure 4Gross profit ratio of Easyjet...............................................................................................6
Figure 5 Net profit ratio of Easyjet..................................................................................................7
Figure 6 Operating profit ratio of Easyjet........................................................................................7
Figure 7Debt equity ratio of Ryanair...............................................................................................9
Figure 8 EPS of Ryanair..................................................................................................................9
Figure 9 Price earnings ratio of Ryanair........................................................................................10
Figure 10Debt equity ratio of Easyjet............................................................................................11
Figure 11Price earnings ratio of Easyjet........................................................................................12
Figure 12Comparison of Ryanair and Easyjet...............................................................................12
Figure 13 Comparison of net profit of Ryanair and Easyjet..........................................................13
Figure 14Comparison chart of debt equity ratio for both firms.....................................................14
Figure 15Comparison chart on EPS..............................................................................................14
Figure 16Comparison chart on PE ratio of firms...........................................................................15
Table 1Profitability of Ryanair........................................................................................................4
Table 2 Profitability analysis of Easyjet..........................................................................................6
Table 3Investor performance indicator for Ryanair........................................................................9
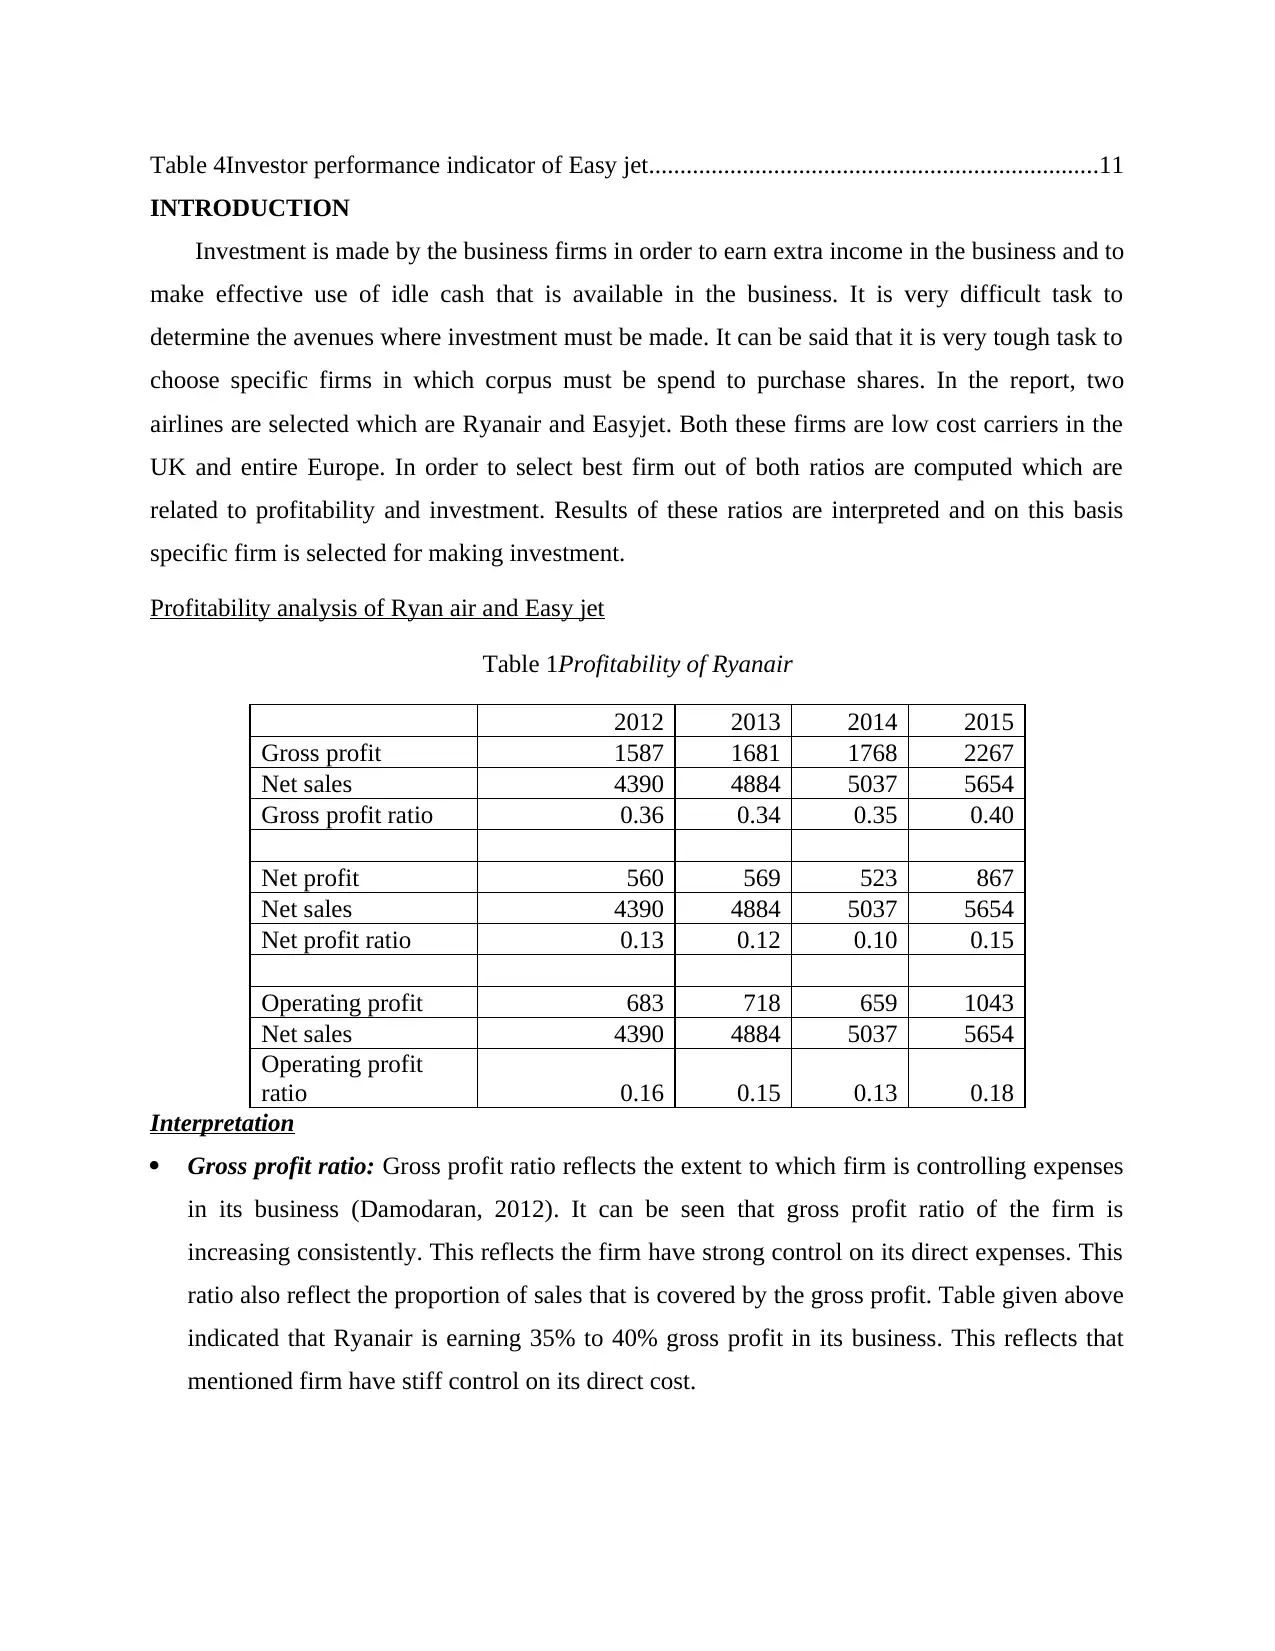
Table 4Investor performance indicator of Easy jet........................................................................11
INTRODUCTION
Investment is made by the business firms in order to earn extra income in the business and to
make effective use of idle cash that is available in the business. It is very difficult task to
determine the avenues where investment must be made. It can be said that it is very tough task to
choose specific firms in which corpus must be spend to purchase shares. In the report, two
airlines are selected which are Ryanair and Easyjet. Both these firms are low cost carriers in the
UK and entire Europe. In order to select best firm out of both ratios are computed which are
related to profitability and investment. Results of these ratios are interpreted and on this basis
specific firm is selected for making investment.
Profitability analysis of Ryan air and Easy jet
Table 1Profitability of Ryanair
2012 2013 2014 2015
Gross profit 1587 1681 1768 2267
Net sales 4390 4884 5037 5654
Gross profit ratio 0.36 0.34 0.35 0.40
Net profit 560 569 523 867
Net sales 4390 4884 5037 5654
Net profit ratio 0.13 0.12 0.10 0.15
Operating profit 683 718 659 1043
Net sales 4390 4884 5037 5654
Operating profit
ratio 0.16 0.15 0.13 0.18
Interpretation
Gross profit ratio: Gross profit ratio reflects the extent to which firm is controlling expenses
in its business (Damodaran, 2012). It can be seen that gross profit ratio of the firm is
increasing consistently. This reflects the firm have strong control on its direct expenses. This
ratio also reflect the proportion of sales that is covered by the gross profit. Table given above
indicated that Ryanair is earning 35% to 40% gross profit in its business. This reflects that
mentioned firm have stiff control on its direct cost.
⊘ This is a preview!⊘
Do you want full access?
Subscribe today to unlock all pages.
Trusted by 1+ million students worldwide
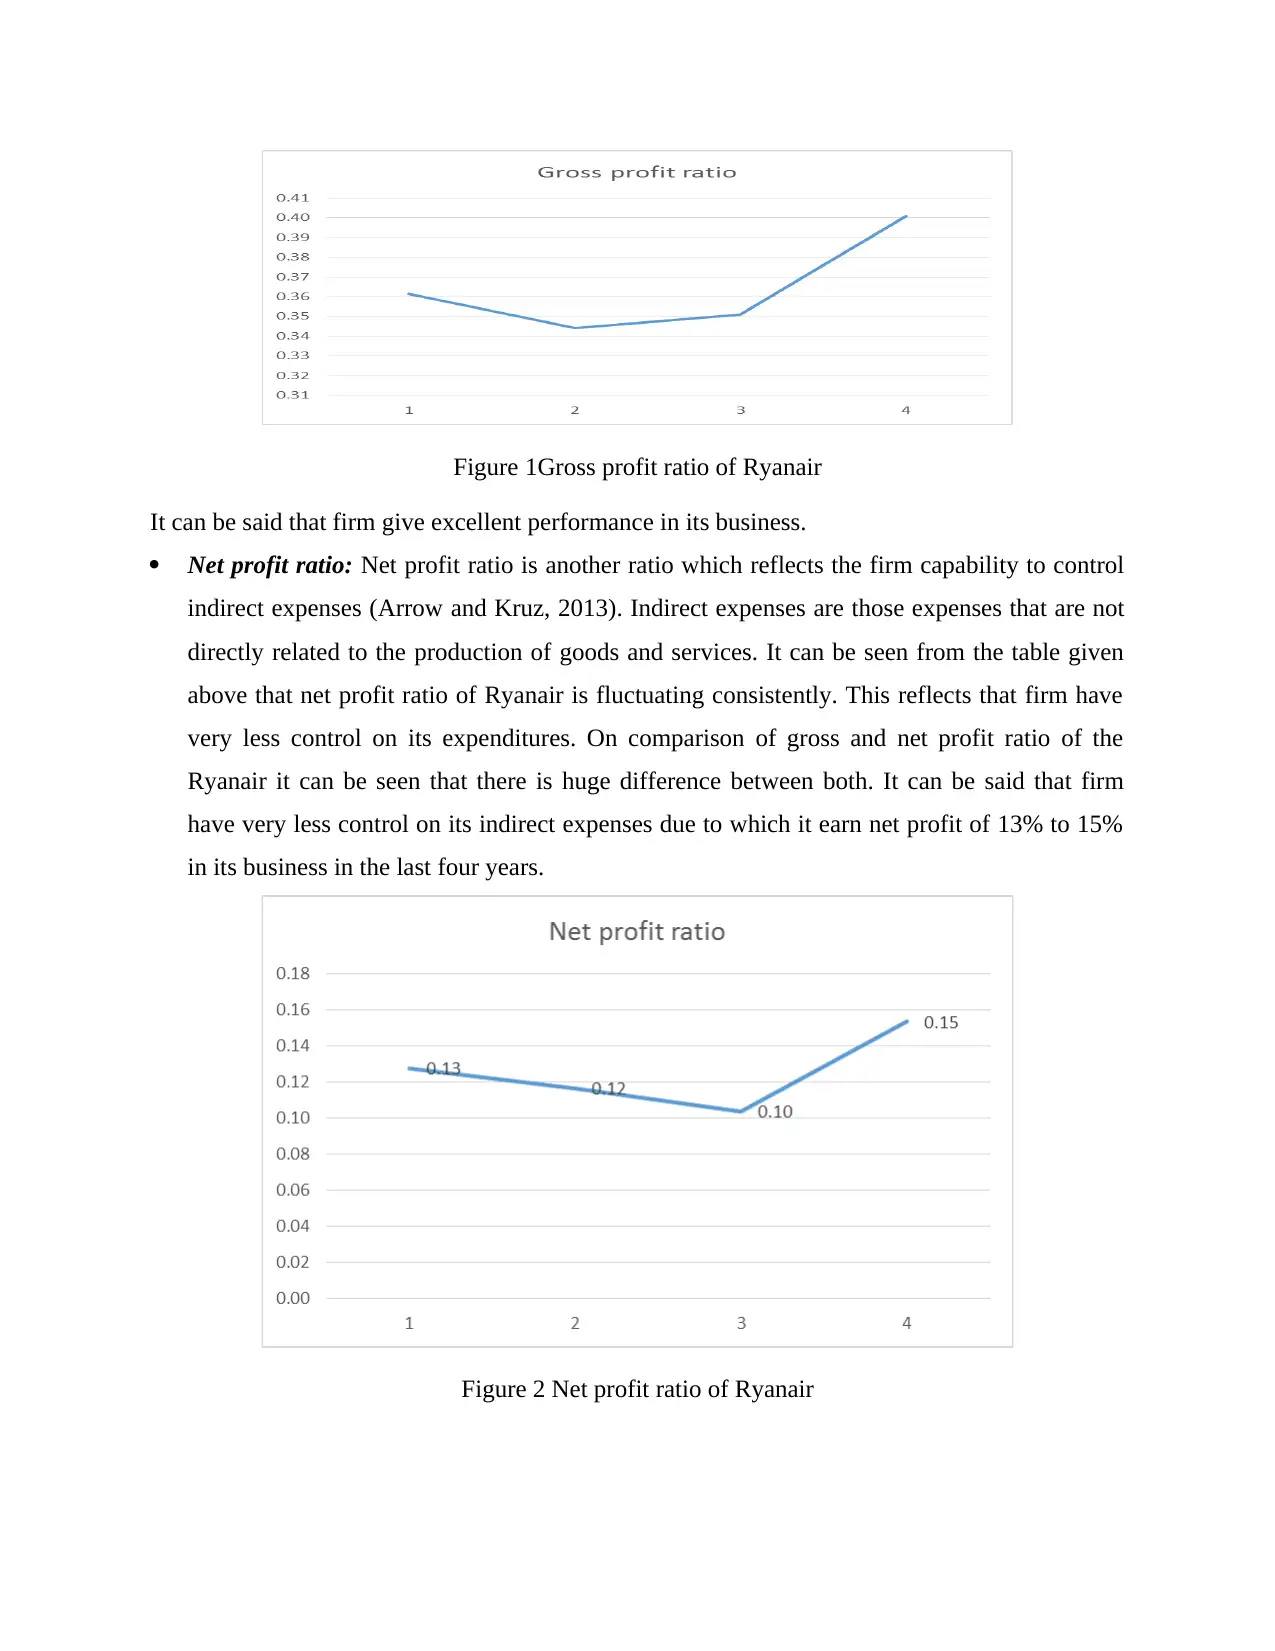
Figure 1Gross profit ratio of Ryanair
It can be said that firm give excellent performance in its business.
Net profit ratio: Net profit ratio is another ratio which reflects the firm capability to control
indirect expenses (Arrow and Kruz, 2013). Indirect expenses are those expenses that are not
directly related to the production of goods and services. It can be seen from the table given
above that net profit ratio of Ryanair is fluctuating consistently. This reflects that firm have
very less control on its expenditures. On comparison of gross and net profit ratio of the
Ryanair it can be seen that there is huge difference between both. It can be said that firm
have very less control on its indirect expenses due to which it earn net profit of 13% to 15%
in its business in the last four years.
Figure 2 Net profit ratio of Ryanair
Paraphrase This Document
Need a fresh take? Get an instant paraphrase of this document with our AI Paraphraser
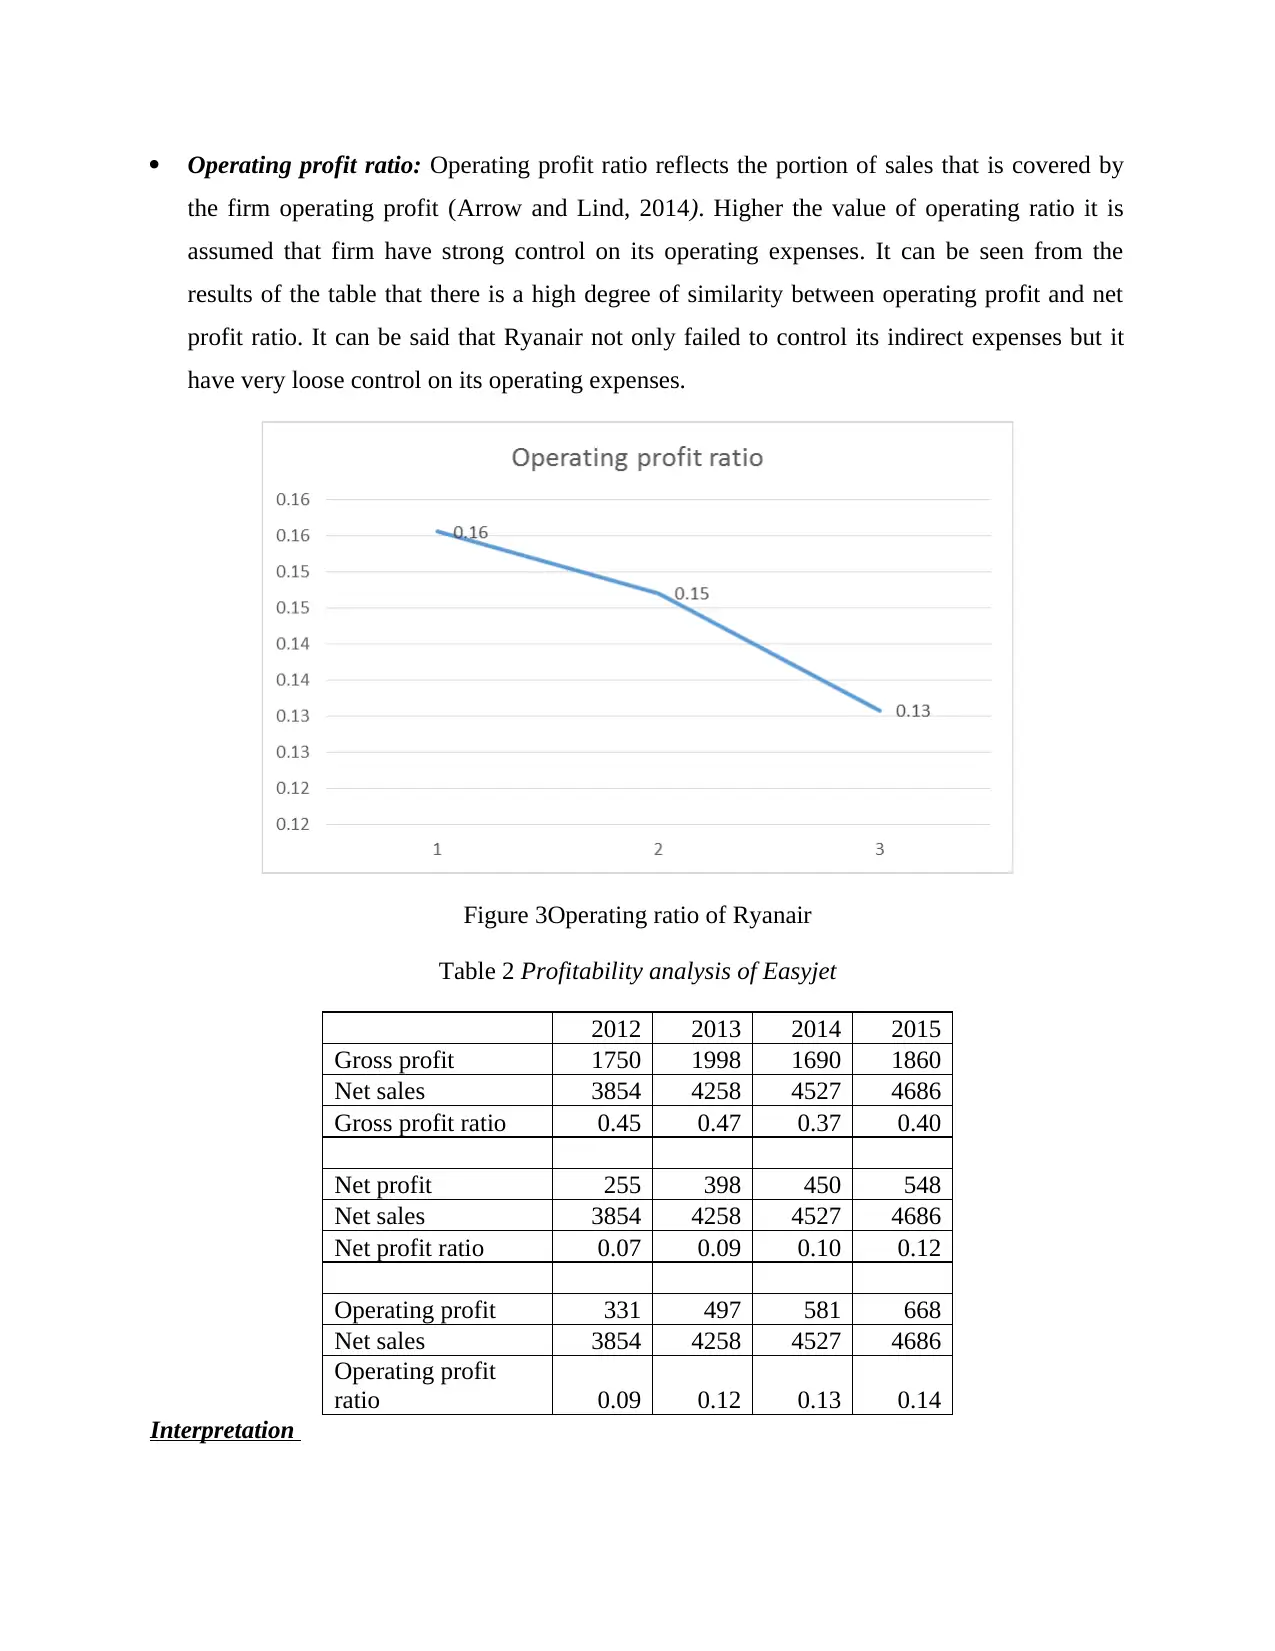
Operating profit ratio: Operating profit ratio reflects the portion of sales that is covered by
the firm operating profit (Arrow and Lind, 2014). Higher the value of operating ratio it is
assumed that firm have strong control on its operating expenses. It can be seen from the
results of the table that there is a high degree of similarity between operating profit and net
profit ratio. It can be said that Ryanair not only failed to control its indirect expenses but it
have very loose control on its operating expenses.
Figure 3Operating ratio of Ryanair
Table 2 Profitability analysis of Easyjet
2012 2013 2014 2015
Gross profit 1750 1998 1690 1860
Net sales 3854 4258 4527 4686
Gross profit ratio 0.45 0.47 0.37 0.40
Net profit 255 398 450 548
Net sales 3854 4258 4527 4686
Net profit ratio 0.07 0.09 0.10 0.12
Operating profit 331 497 581 668
Net sales 3854 4258 4527 4686
Operating profit
ratio 0.09 0.12 0.13 0.14
Interpretation
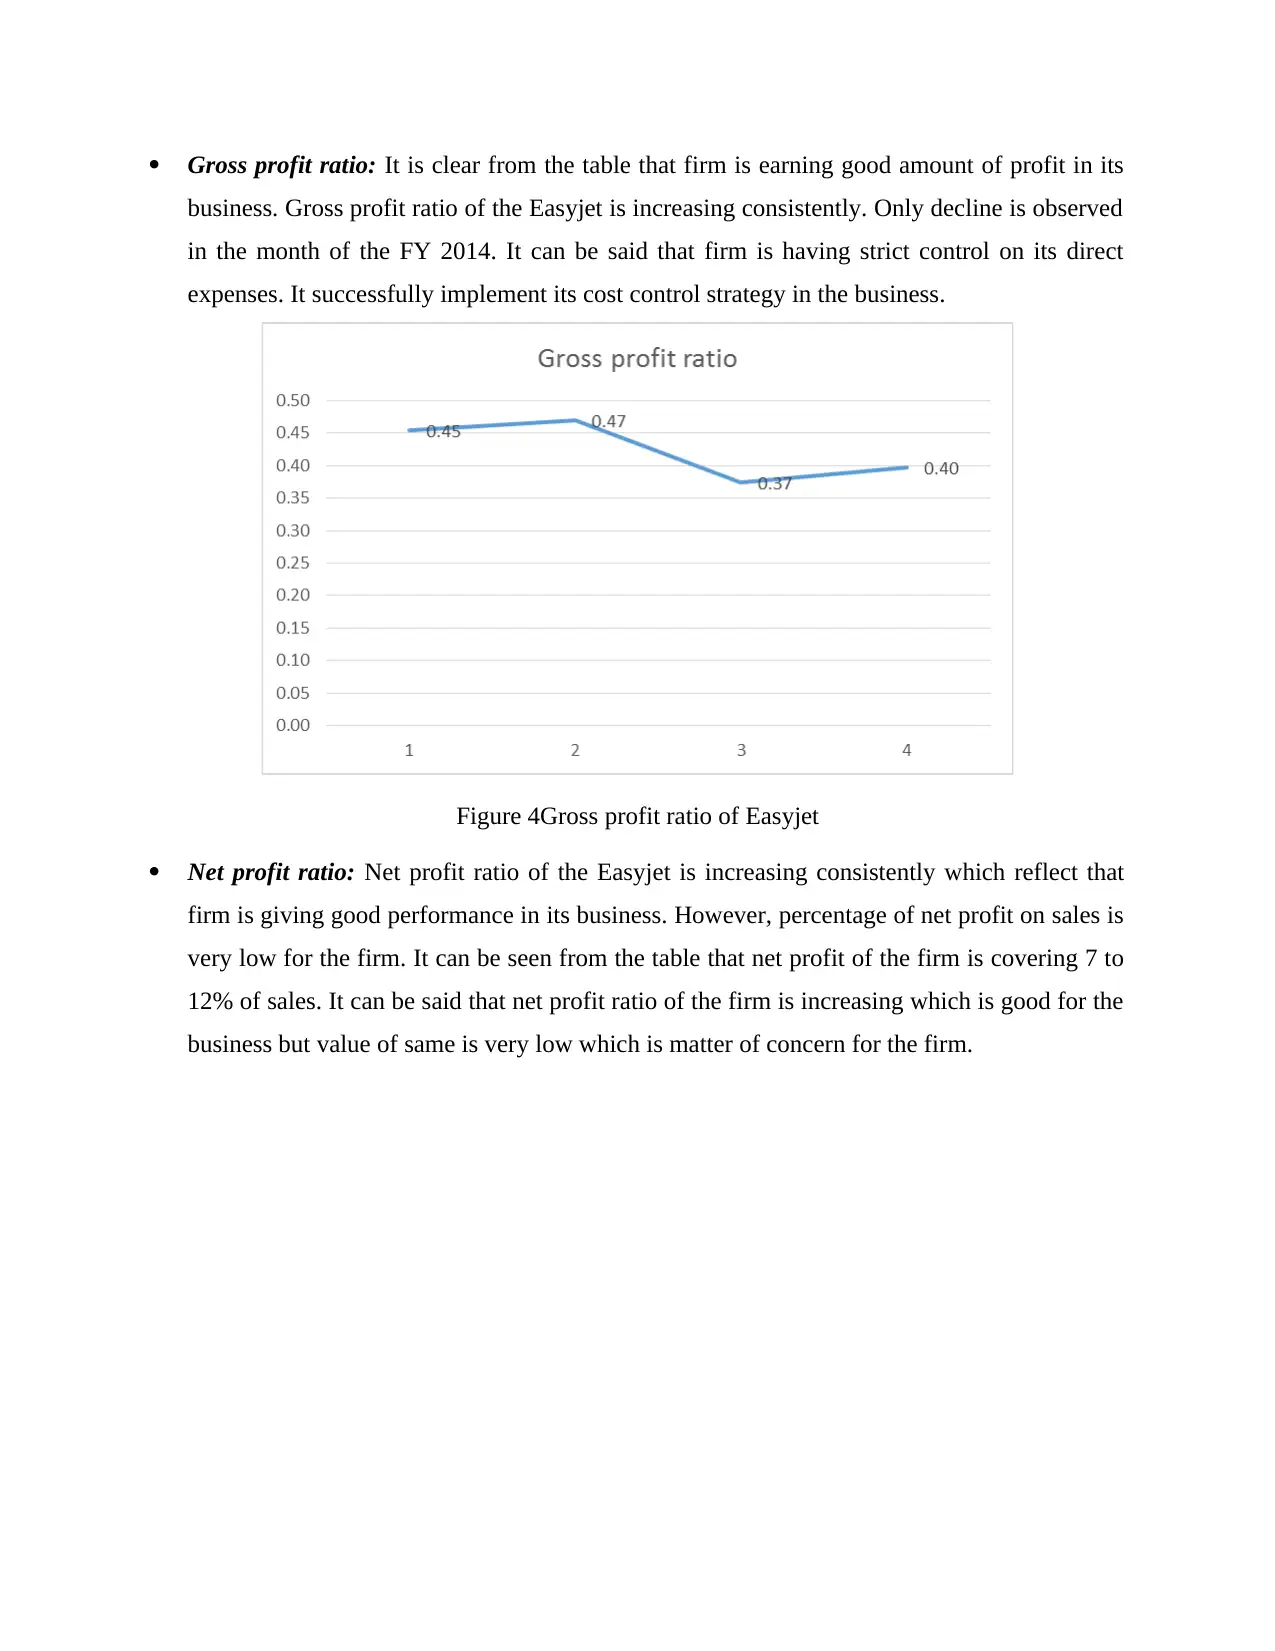
Gross profit ratio: It is clear from the table that firm is earning good amount of profit in its
business. Gross profit ratio of the Easyjet is increasing consistently. Only decline is observed
in the month of the FY 2014. It can be said that firm is having strict control on its direct
expenses. It successfully implement its cost control strategy in the business.
Figure 4Gross profit ratio of Easyjet
Net profit ratio: Net profit ratio of the Easyjet is increasing consistently which reflect that
firm is giving good performance in its business. However, percentage of net profit on sales is
very low for the firm. It can be seen from the table that net profit of the firm is covering 7 to
12% of sales. It can be said that net profit ratio of the firm is increasing which is good for the
business but value of same is very low which is matter of concern for the firm.
⊘ This is a preview!⊘
Do you want full access?
Subscribe today to unlock all pages.
Trusted by 1+ million students worldwide
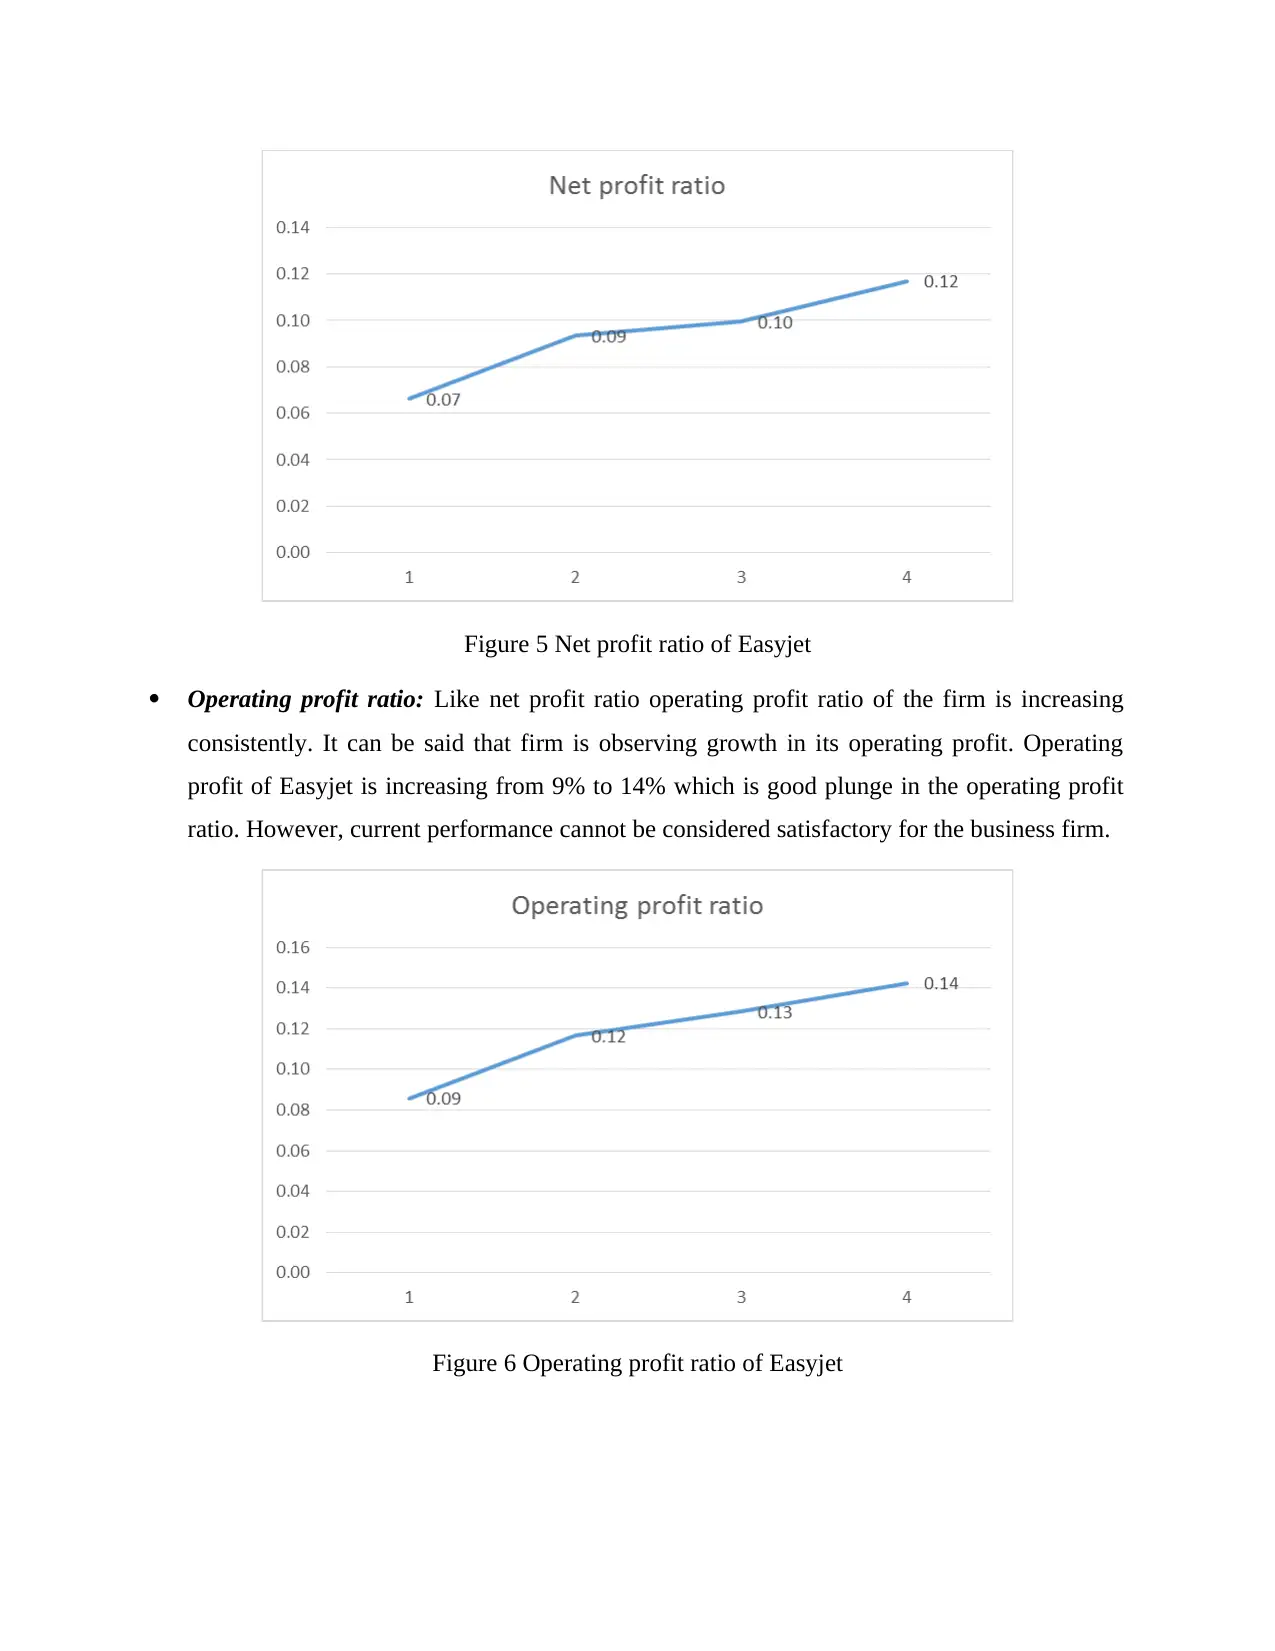
Figure 5 Net profit ratio of Easyjet
Operating profit ratio: Like net profit ratio operating profit ratio of the firm is increasing
consistently. It can be said that firm is observing growth in its operating profit. Operating
profit of Easyjet is increasing from 9% to 14% which is good plunge in the operating profit
ratio. However, current performance cannot be considered satisfactory for the business firm.
Figure 6 Operating profit ratio of Easyjet
Paraphrase This Document
Need a fresh take? Get an instant paraphrase of this document with our AI Paraphraser
Investor performance indicator for Ryanair and Easyjet
Table 3Investor performance indicator for Ryanair
Debt 3403 3226 2706 4088
Equity 3307 3273 3286 4035
Debt equity ratio 1.03 0.99 0.82 1.01
Earning 560 569 523 867
Shares outstanding 288 282 284 278
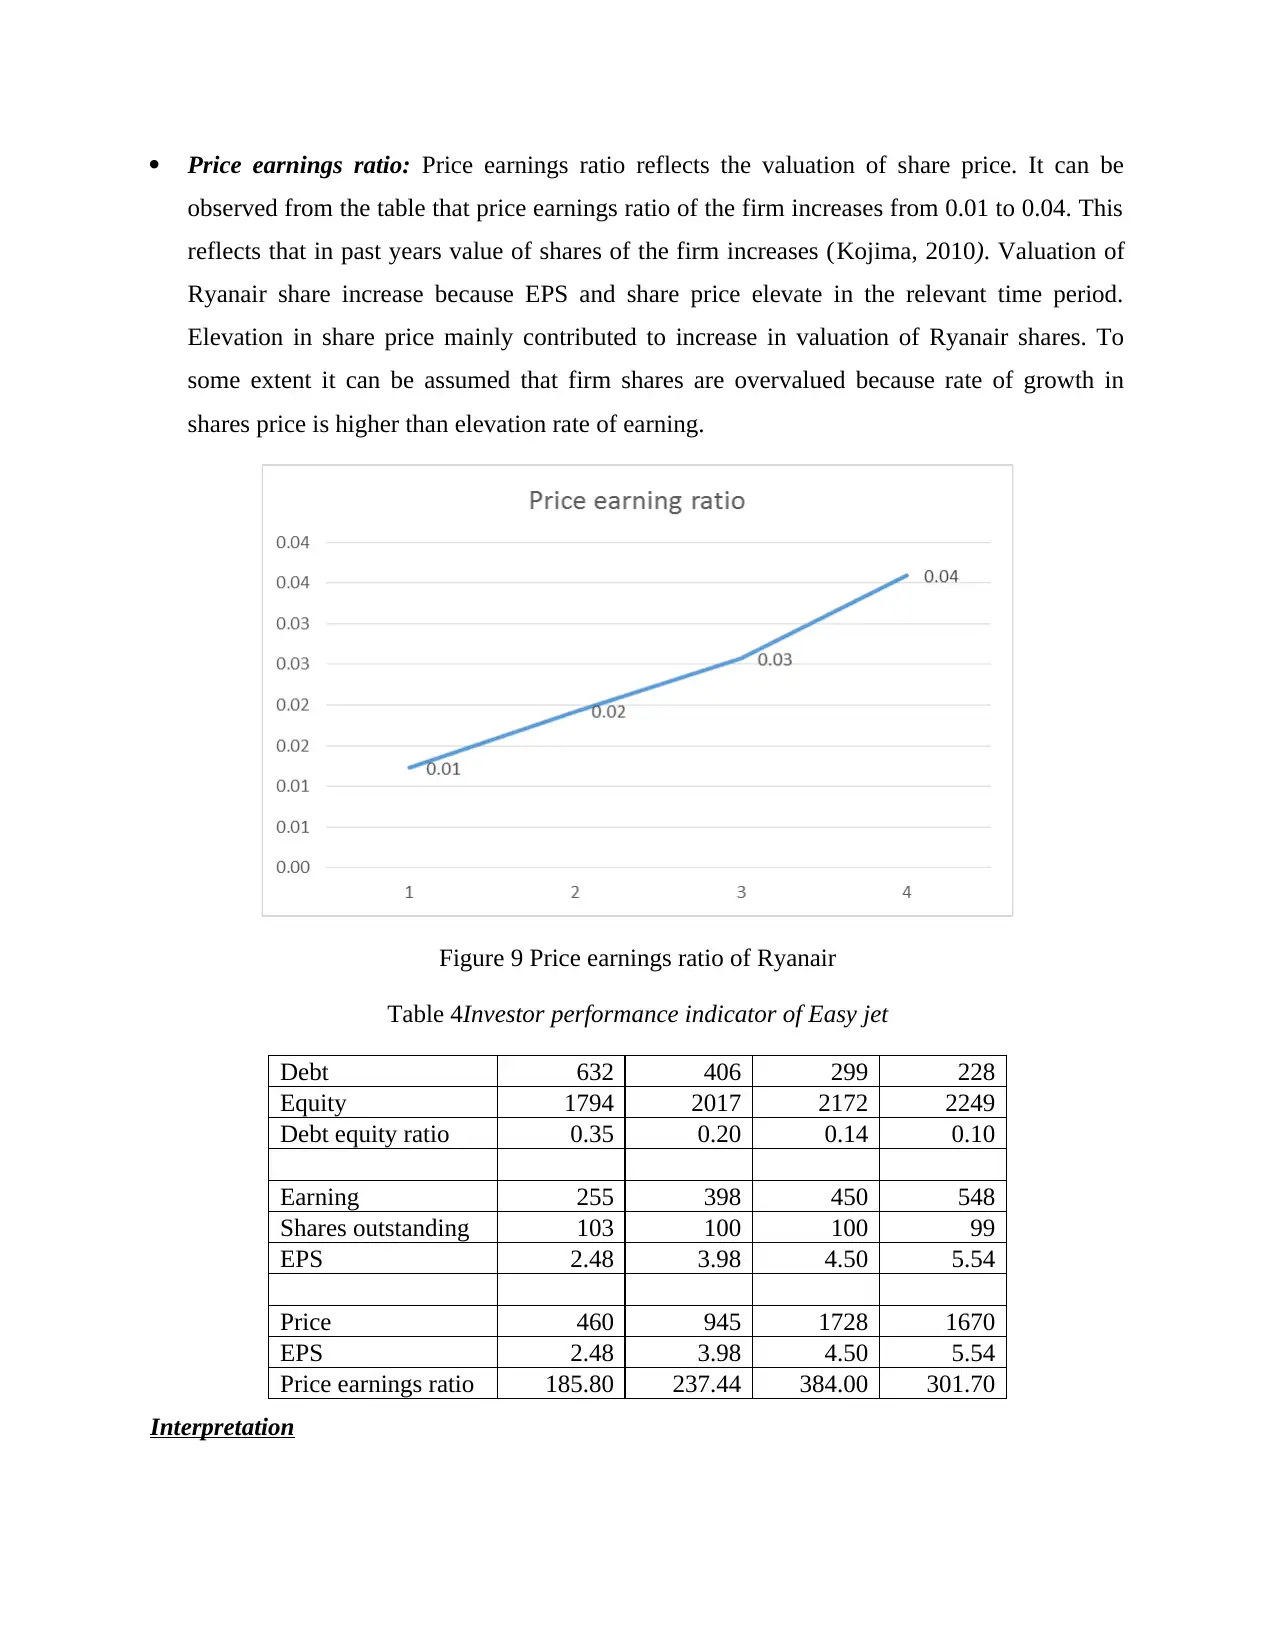
EPS 1.94 2.02 1.84 3.12
Price 3.54 5.42 7.29 10
EPS 288 282 284 278
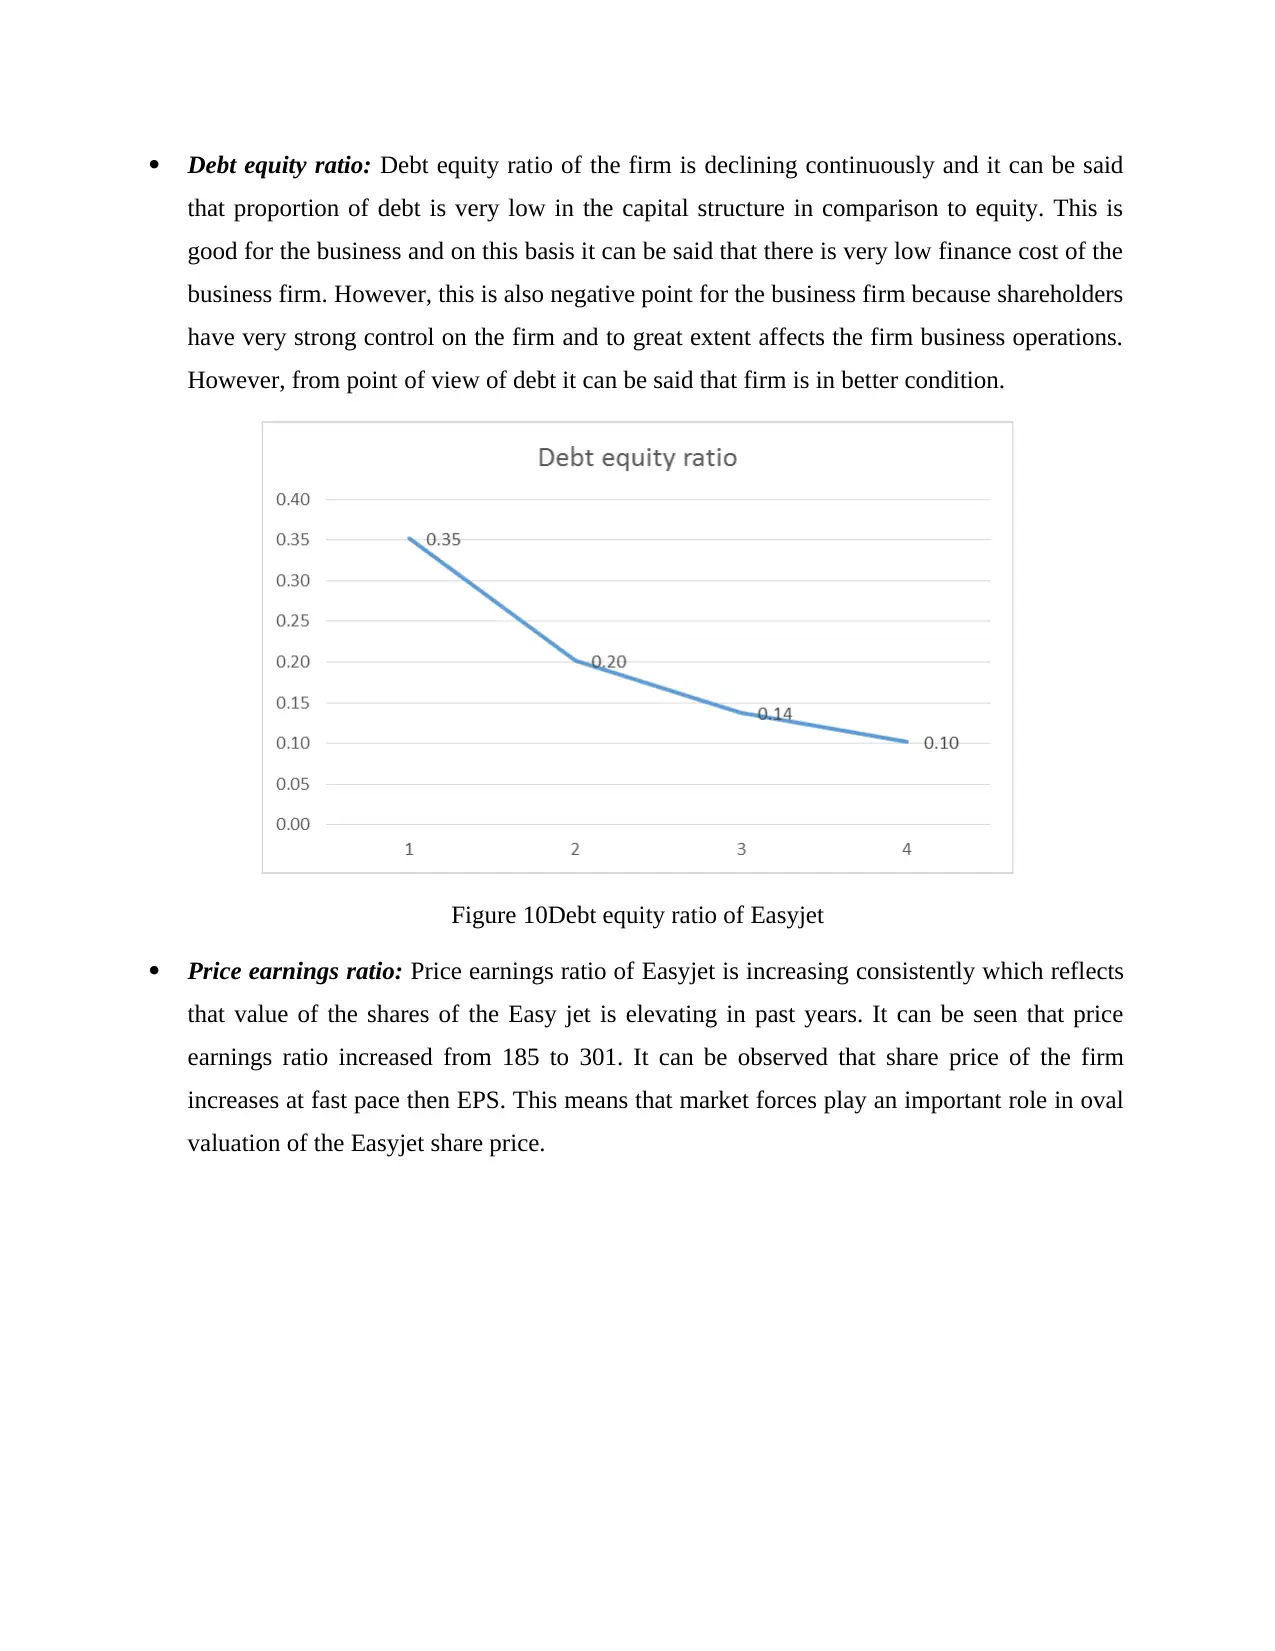
Price earnings ratio 0.01 0.02 0.03 0.04
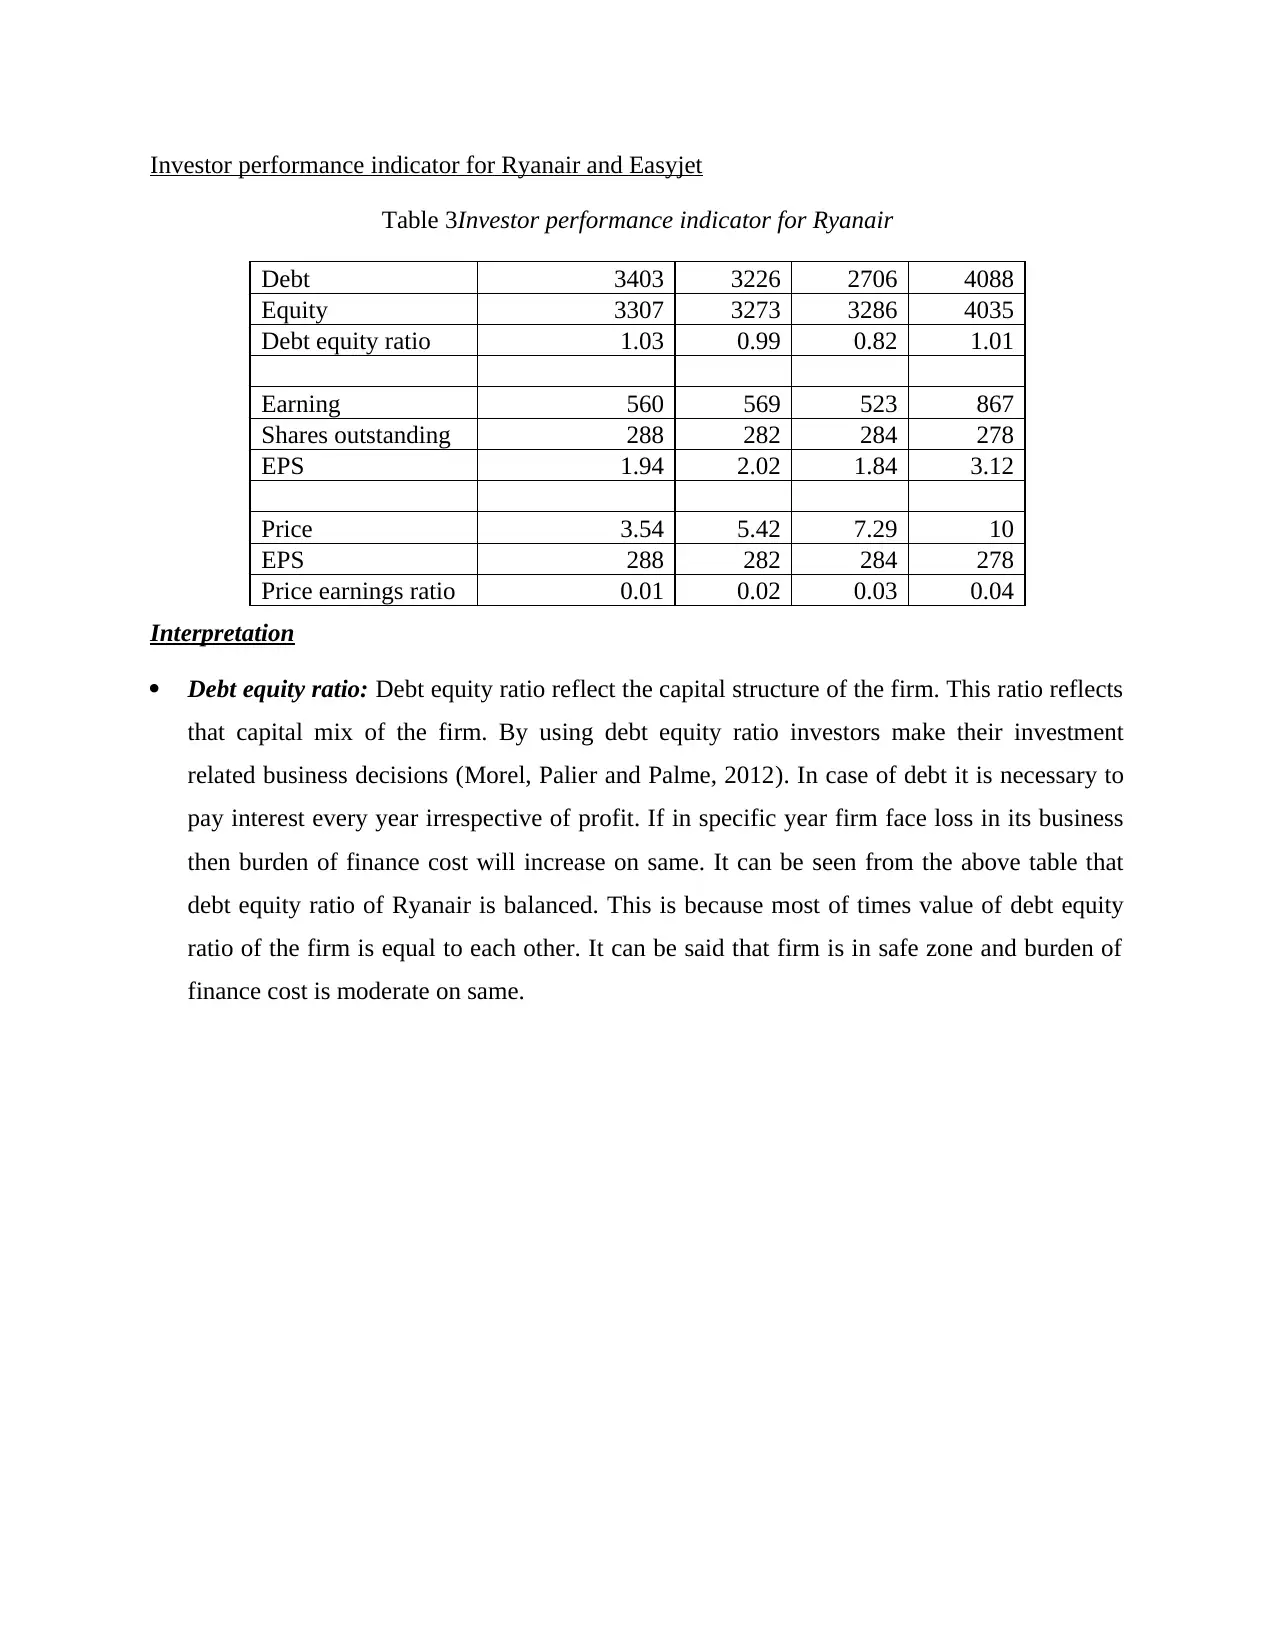
Interpretation
Debt equity ratio: Debt equity ratio reflect the capital structure of the firm. This ratio reflects
that capital mix of the firm. By using debt equity ratio investors make their investment
related business decisions (Morel, Palier and Palme, 2012). In case of debt it is necessary to
pay interest every year irrespective of profit. If in specific year firm face loss in its business
then burden of finance cost will increase on same. It can be seen from the above table that
debt equity ratio of Ryanair is balanced. This is because most of times value of debt equity
ratio of the firm is equal to each other. It can be said that firm is in safe zone and burden of
finance cost is moderate on same.
Table 3Investor performance indicator for Ryanair
Debt 3403 3226 2706 4088
Equity 3307 3273 3286 4035
Debt equity ratio 1.03 0.99 0.82 1.01
Earning 560 569 523 867
Shares outstanding 288 282 284 278
EPS 1.94 2.02 1.84 3.12
Price 3.54 5.42 7.29 10
EPS 288 282 284 278
Price earnings ratio 0.01 0.02 0.03 0.04
Interpretation
Debt equity ratio: Debt equity ratio reflect the capital structure of the firm. This ratio reflects
that capital mix of the firm. By using debt equity ratio investors make their investment
related business decisions (Morel, Palier and Palme, 2012). In case of debt it is necessary to
pay interest every year irrespective of profit. If in specific year firm face loss in its business
then burden of finance cost will increase on same. It can be seen from the above table that
debt equity ratio of Ryanair is balanced. This is because most of times value of debt equity
ratio of the firm is equal to each other. It can be said that firm is in safe zone and burden of
finance cost is moderate on same.
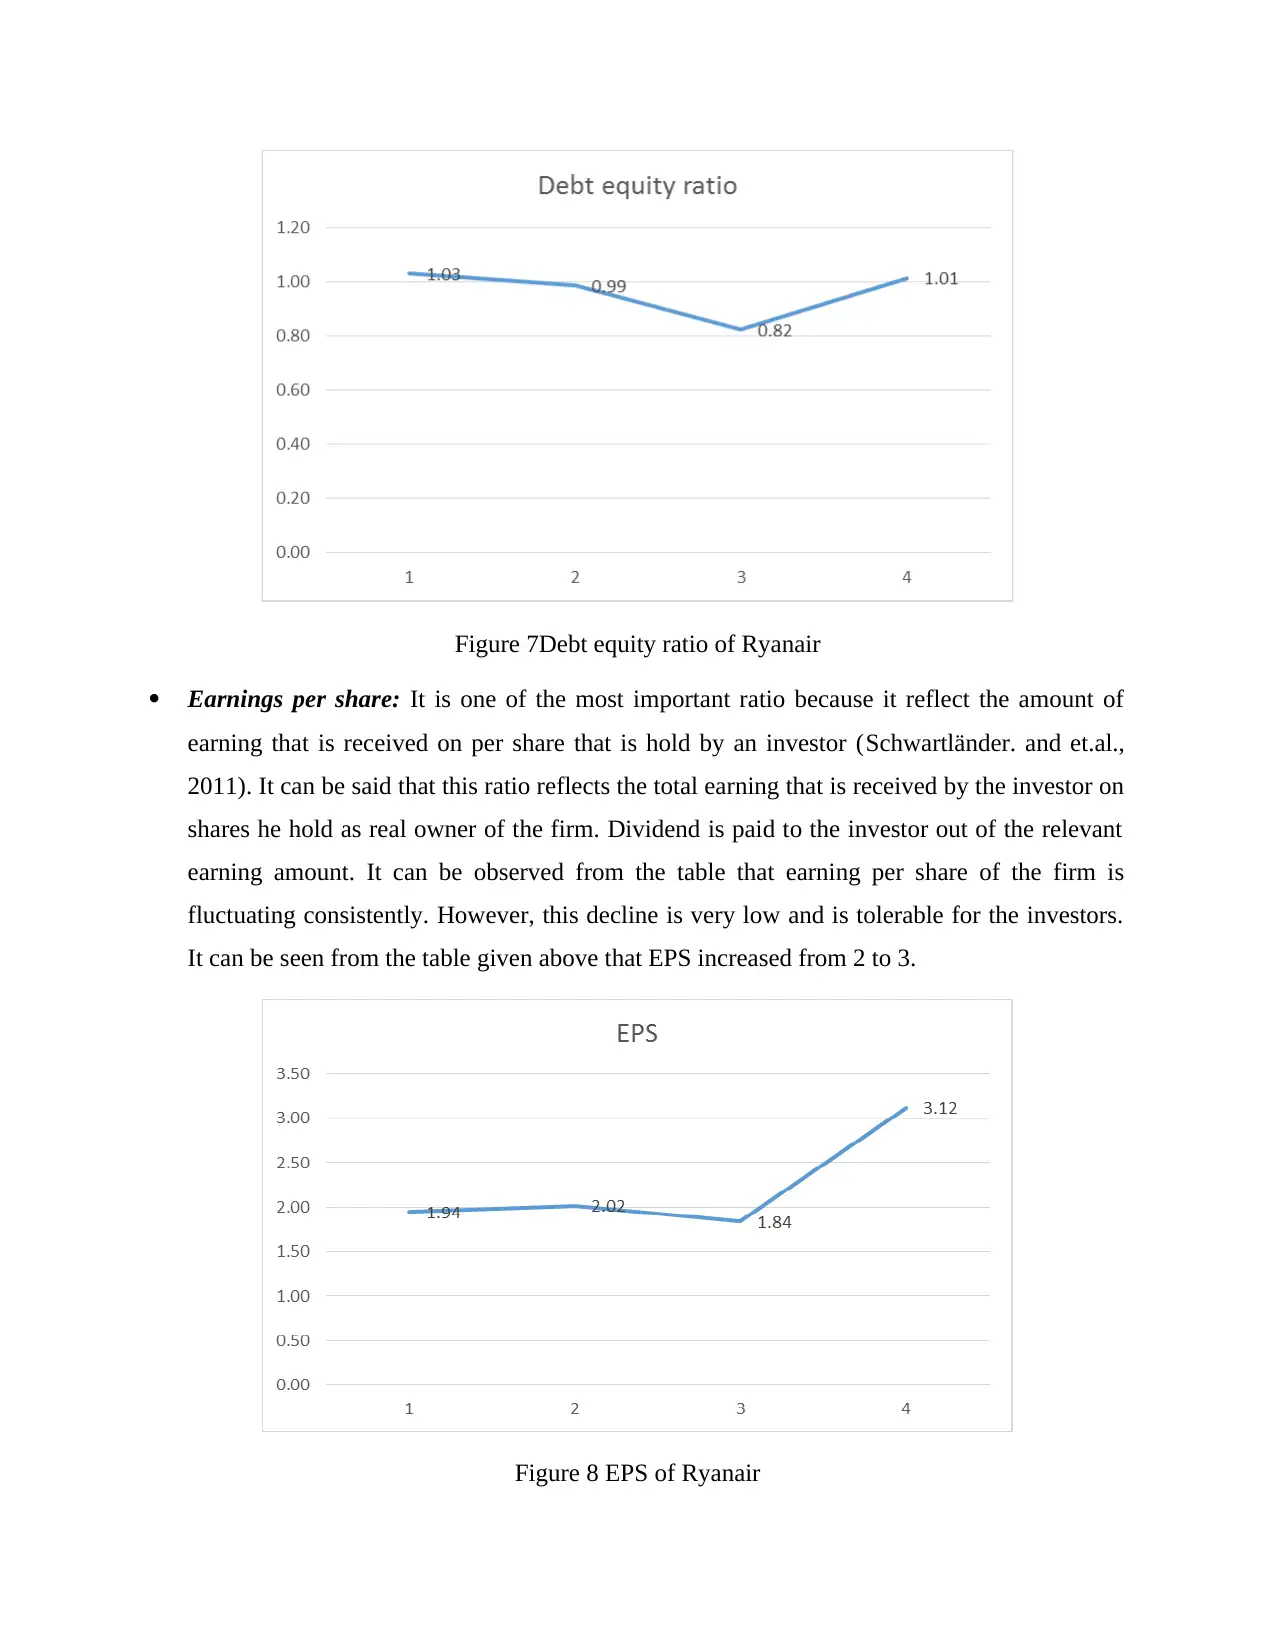
Figure 7Debt equity ratio of Ryanair
Earnings per share: It is one of the most important ratio because it reflect the amount of
earning that is received on per share that is hold by an investor (Schwartländer. and et.al.,
2011). It can be said that this ratio reflects the total earning that is received by the investor on
shares he hold as real owner of the firm. Dividend is paid to the investor out of the relevant
earning amount. It can be observed from the table that earning per share of the firm is
fluctuating consistently. However, this decline is very low and is tolerable for the investors.
It can be seen from the table given above that EPS increased from 2 to 3.
Figure 8 EPS of Ryanair
⊘ This is a preview!⊘
Do you want full access?
Subscribe today to unlock all pages.
Trusted by 1+ million students worldwide
Price earnings ratio: Price earnings ratio reflects the valuation of share price. It can be
observed from the table that price earnings ratio of the firm increases from 0.01 to 0.04. This
reflects that in past years value of shares of the firm increases (Kojima, 2010). Valuation of
Ryanair share increase because EPS and share price elevate in the relevant time period.
Elevation in share price mainly contributed to increase in valuation of Ryanair shares. To
some extent it can be assumed that firm shares are overvalued because rate of growth in
shares price is higher than elevation rate of earning.
Figure 9 Price earnings ratio of Ryanair
Table 4Investor performance indicator of Easy jet
Debt 632 406 299 228
Equity 1794 2017 2172 2249
Debt equity ratio 0.35 0.20 0.14 0.10
Earning 255 398 450 548
Shares outstanding 103 100 100 99
EPS 2.48 3.98 4.50 5.54
Price 460 945 1728 1670
EPS 2.48 3.98 4.50 5.54
Price earnings ratio 185.80 237.44 384.00 301.70
Interpretation
Paraphrase This Document
Need a fresh take? Get an instant paraphrase of this document with our AI Paraphraser
Debt equity ratio: Debt equity ratio of the firm is declining continuously and it can be said
that proportion of debt is very low in the capital structure in comparison to equity. This is
good for the business and on this basis it can be said that there is very low finance cost of the
business firm. However, this is also negative point for the business firm because shareholders
have very strong control on the firm and to great extent affects the firm business operations.
However, from point of view of debt it can be said that firm is in better condition.
Figure 10Debt equity ratio of Easyjet
Price earnings ratio: Price earnings ratio of Easyjet is increasing consistently which reflects
that value of the shares of the Easy jet is elevating in past years. It can be seen that price
earnings ratio increased from 185 to 301. It can be observed that share price of the firm
increases at fast pace then EPS. This means that market forces play an important role in oval
valuation of the Easyjet share price.
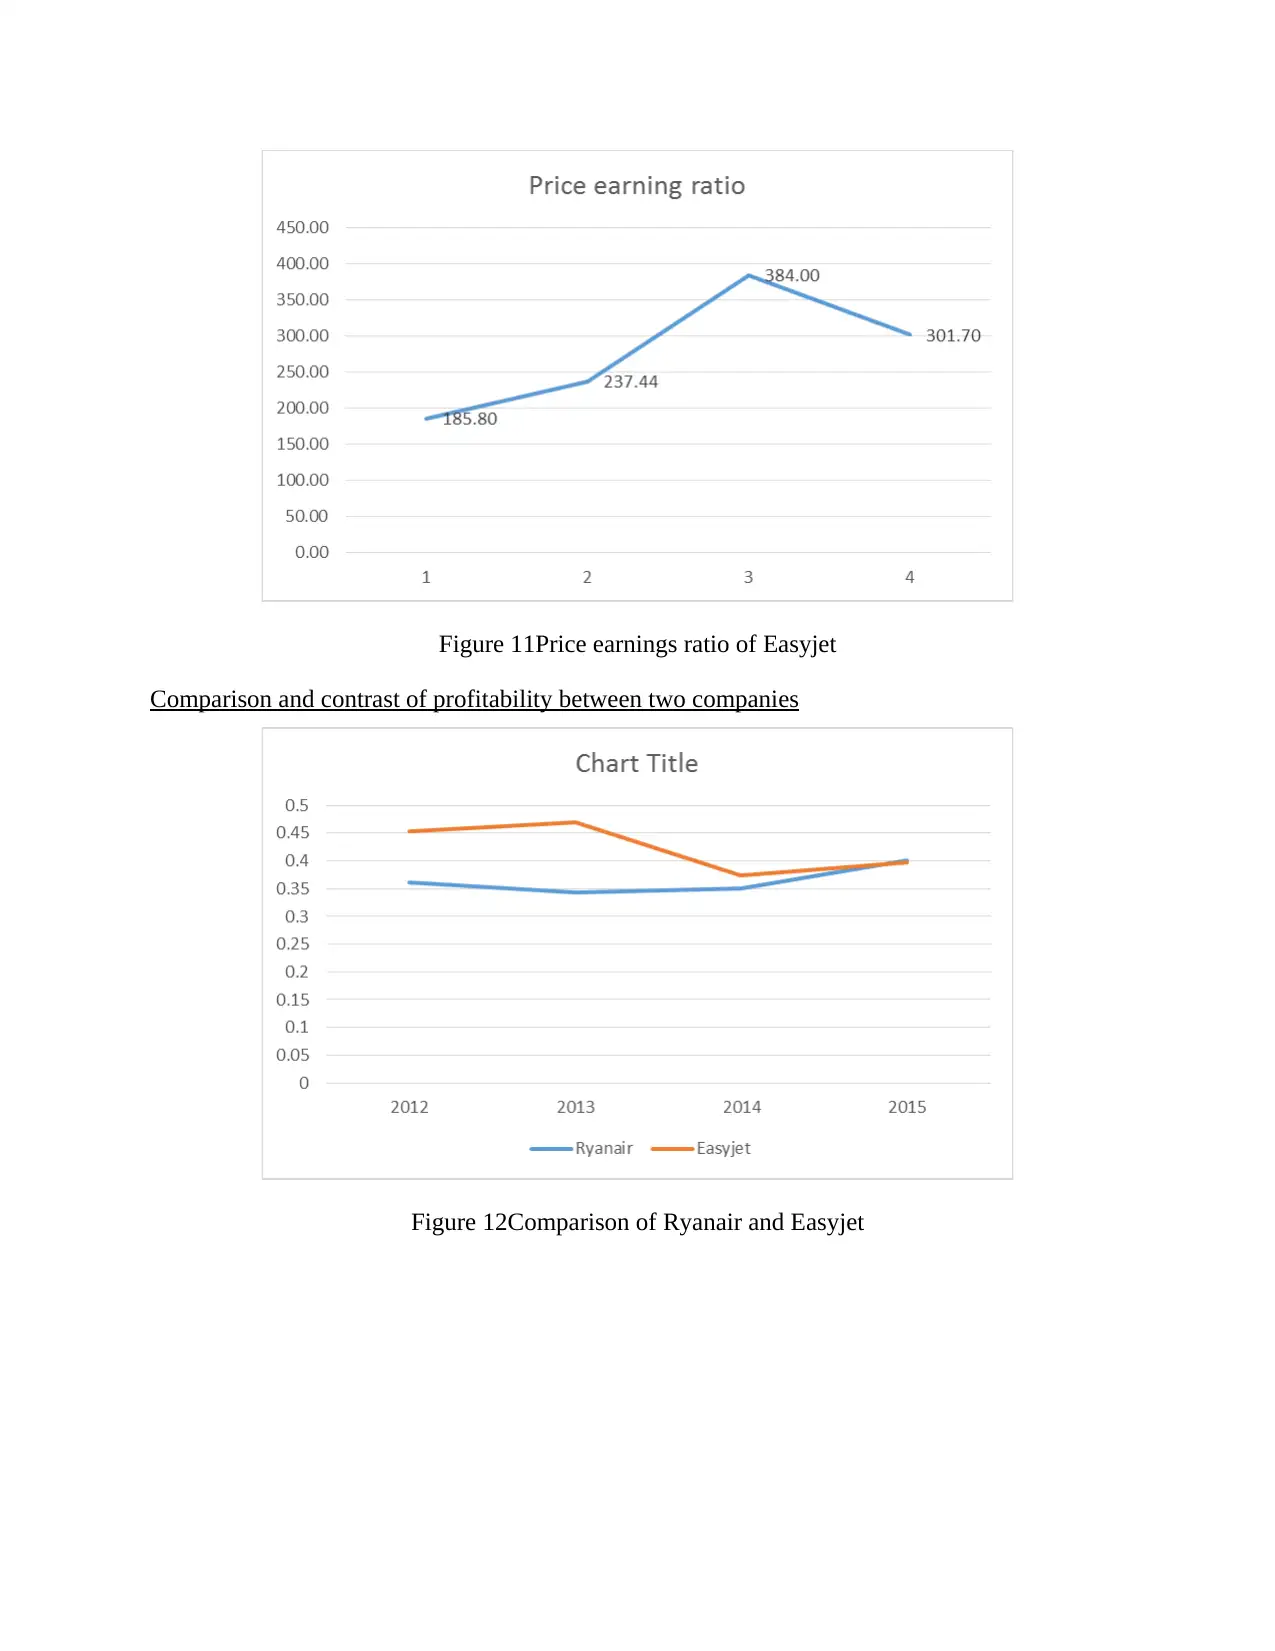
Figure 11Price earnings ratio of Easyjet
Comparison and contrast of profitability between two companies
Figure 12Comparison of Ryanair and Easyjet
Comparison and contrast of profitability between two companies
Figure 12Comparison of Ryanair and Easyjet
⊘ This is a preview!⊘
Do you want full access?
Subscribe today to unlock all pages.
Trusted by 1+ million students worldwide
1 out of 17
Related Documents


Your All-in-One AI-Powered Toolkit for Academic Success.
+13062052269
info@desklib.com
Available 24*7 on WhatsApp / Email
![[object Object]](/_next/static/media/star-bottom.7253800d.svg)
Unlock your academic potential
Copyright © 2020–2026 A2Z Services. All Rights Reserved. Developed and managed by ZUCOL.