Financial Performance Analysis Report - Finance for Business
VerifiedAdded on 2021/01/02
|18
|3859
|263
Report
AI Summary
This report provides a comprehensive financial analysis of Ellex Medical Lasers Limited and GICS industry group. It includes a detailed description of their operations and comparative advantages, followed by a calculation and comparison of key performance ratios, such as liquidity, profitability, and capital structure ratios. The report also analyzes monthly share price movements, identifies significant factors influencing share prices, and calculates Beta values and expected rates of return using the CAPM method. Furthermore, it examines dividend policies and concludes with a recommendation letter for future investment. The analysis is based on financial statements and market data, offering a thorough evaluation of the financial health and investment potential of both organizations.
FINANCE FOR BUSINESS
Paraphrase This Document
Need a fresh take? Get an instant paraphrase of this document with our AI Paraphraser
Table of Contents
INTRODUCTION...........................................................................................................................1
MAIN BODY...................................................................................................................................1
1. Description of operation and comparative advantages of the organisation............................1
2. Calculation and comparison of performance ratios................................................................3
3. Analysis of monthly share price movements..........................................................................9
4. Significant factors affect and influence the share price........................................................11
5. Calculation of Beta values and expected rates of return using CAPM.................................13
6. Dividend policies..................................................................................................................14
7. Recommendation letter.........................................................................................................14
CONCLUSION..............................................................................................................................14
REFERENCES..............................................................................................................................16
INTRODUCTION
Finance is the primary source of business for smooth functioning and operation. It is very
important for organisation to analyse the financial requirement and find out appropriate resources
to fulfil the requirement of business (Li, 2005). This report is prepared analyse the financial task.
Description of operations and comparative advantages of the two organisation as ELLEX
MEDICAL LASERS LIMITED and GICS industry group. Calculations and comparison of
performance ratios of both the organisations are done to evaluate the financial performance of
organisation. Analysis of monthly share prices movements by using three years investing plans
and ordinaries index. Share price influencing factors are also discussed in this report and internet
or financial business publications are undertaken. Beta value analysis and expected rates of
returns by using CAPM method are analysed in this context. Dividend policy of organisation in
terms of managing the operations and management are considered in this report.
Recommendations are made subject to analyse the appropriate organisation for future
investment.
MAIN BODY
1. Description of operation and comparative advantages of the organisation
Ellex Medical Lasers Limited
It is a medical technology organisation that build and develops services, manufactures
products and sells comprehensive ranges of medical equipments for use in ophthalmic
procedures (Ben-David, Grahamand Harvey. 2013). Organisational values ad services as
distribution mainly assist the organisation in terms of incorporating the changes and dealing with
financial challenges.
1
⊘ This is a preview!⊘
Do you want full access?
Subscribe today to unlock all pages.
Trusted by 1+ million students worldwide
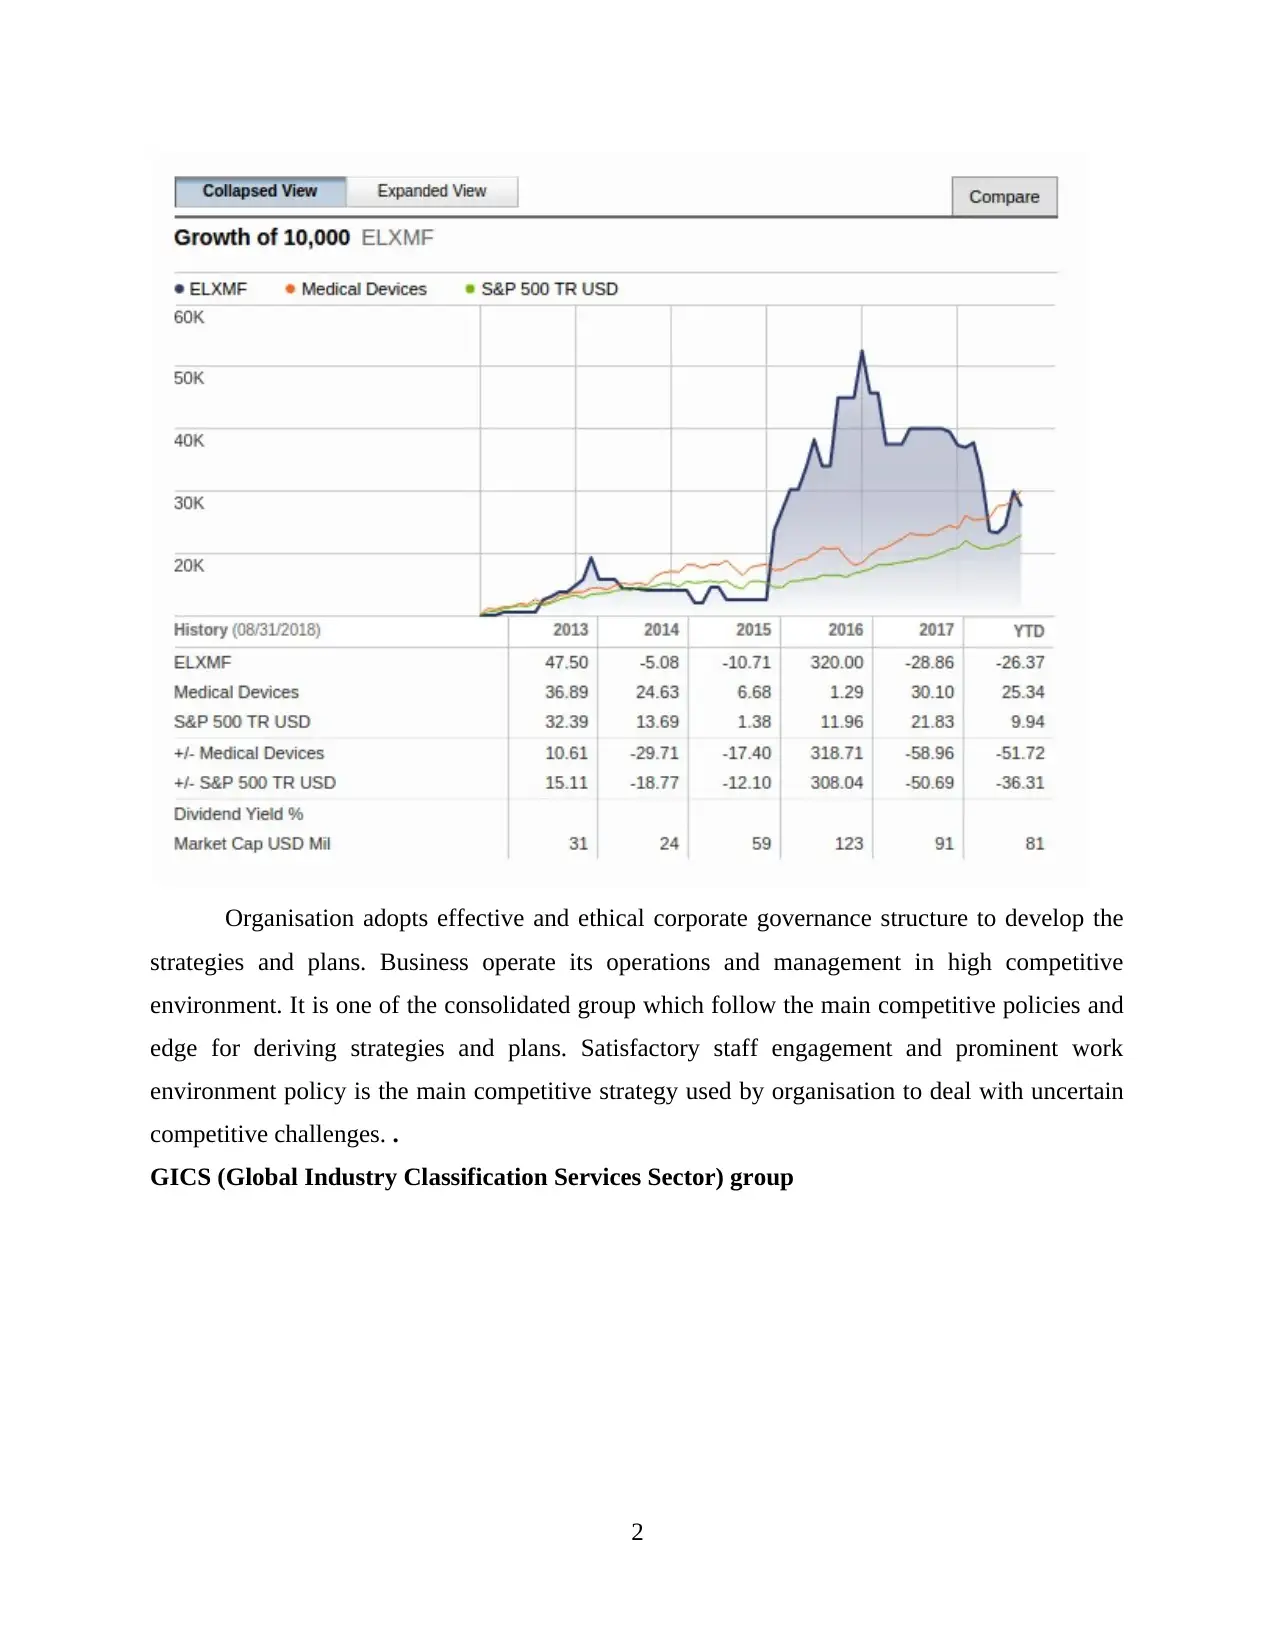
Organisation adopts effective and ethical corporate governance structure to develop the
strategies and plans. Business operate its operations and management in high competitive
environment. It is one of the consolidated group which follow the main competitive policies and
edge for deriving strategies and plans. Satisfactory staff engagement and prominent work
environment policy is the main competitive strategy used by organisation to deal with uncertain
competitive challenges. .
GICS (Global Industry Classification Services Sector) group
2
Paraphrase This Document
Need a fresh take? Get an instant paraphrase of this document with our AI Paraphraser
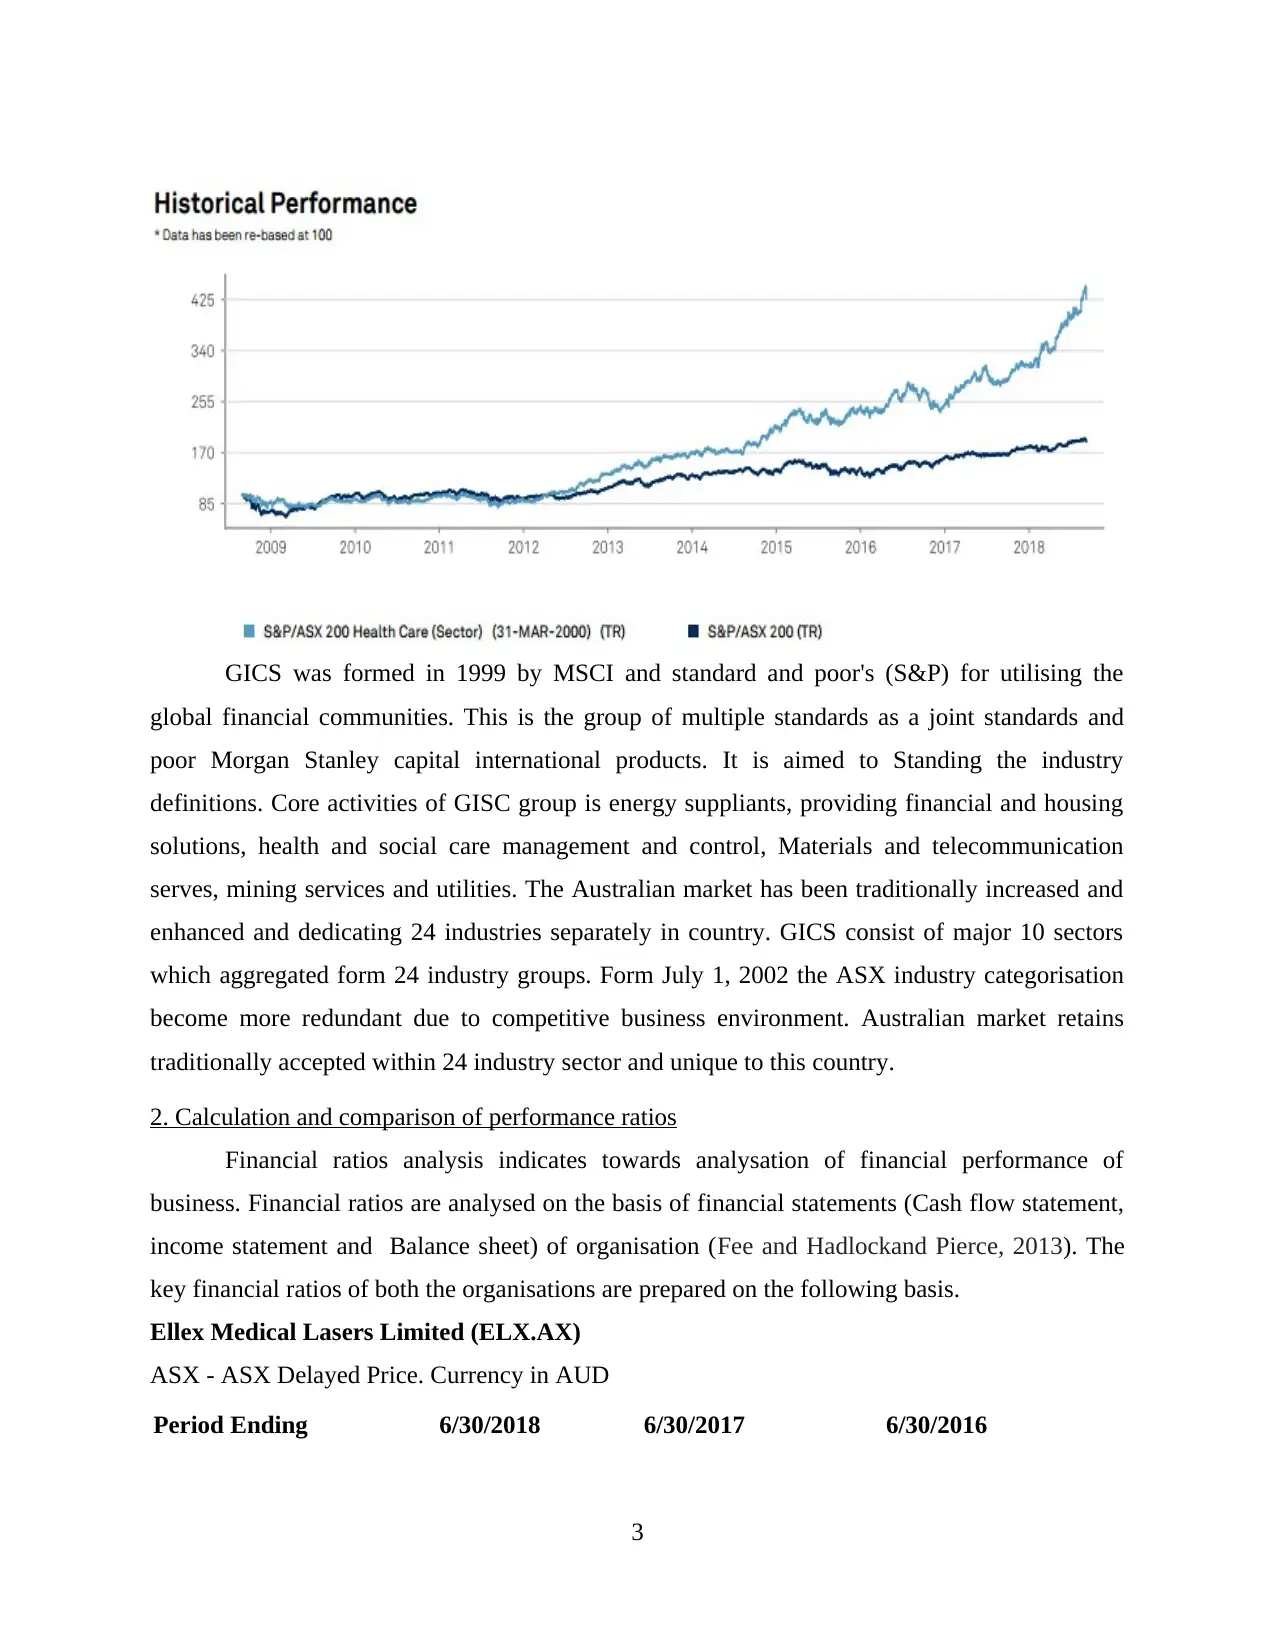
GICS was formed in 1999 by MSCI and standard and poor's (S&P) for utilising the
global financial communities. This is the group of multiple standards as a joint standards and
poor Morgan Stanley capital international products. It is aimed to Standing the industry
definitions. Core activities of GISC group is energy suppliants, providing financial and housing
solutions, health and social care management and control, Materials and telecommunication
serves, mining services and utilities. The Australian market has been traditionally increased and
enhanced and dedicating 24 industries separately in country. GICS consist of major 10 sectors
which aggregated form 24 industry groups. Form July 1, 2002 the ASX industry categorisation
become more redundant due to competitive business environment. Australian market retains
traditionally accepted within 24 industry sector and unique to this country.
2. Calculation and comparison of performance ratios
Financial ratios analysis indicates towards analysation of financial performance of
business. Financial ratios are analysed on the basis of financial statements (Cash flow statement,
income statement and Balance sheet) of organisation (Fee and Hadlockand Pierce, 2013). The
key financial ratios of both the organisations are prepared on the following basis.
Ellex Medical Lasers Limited (ELX.AX)
ASX - ASX Delayed Price. Currency in AUD
Period Ending 6/30/2018 6/30/2017 6/30/2016
3
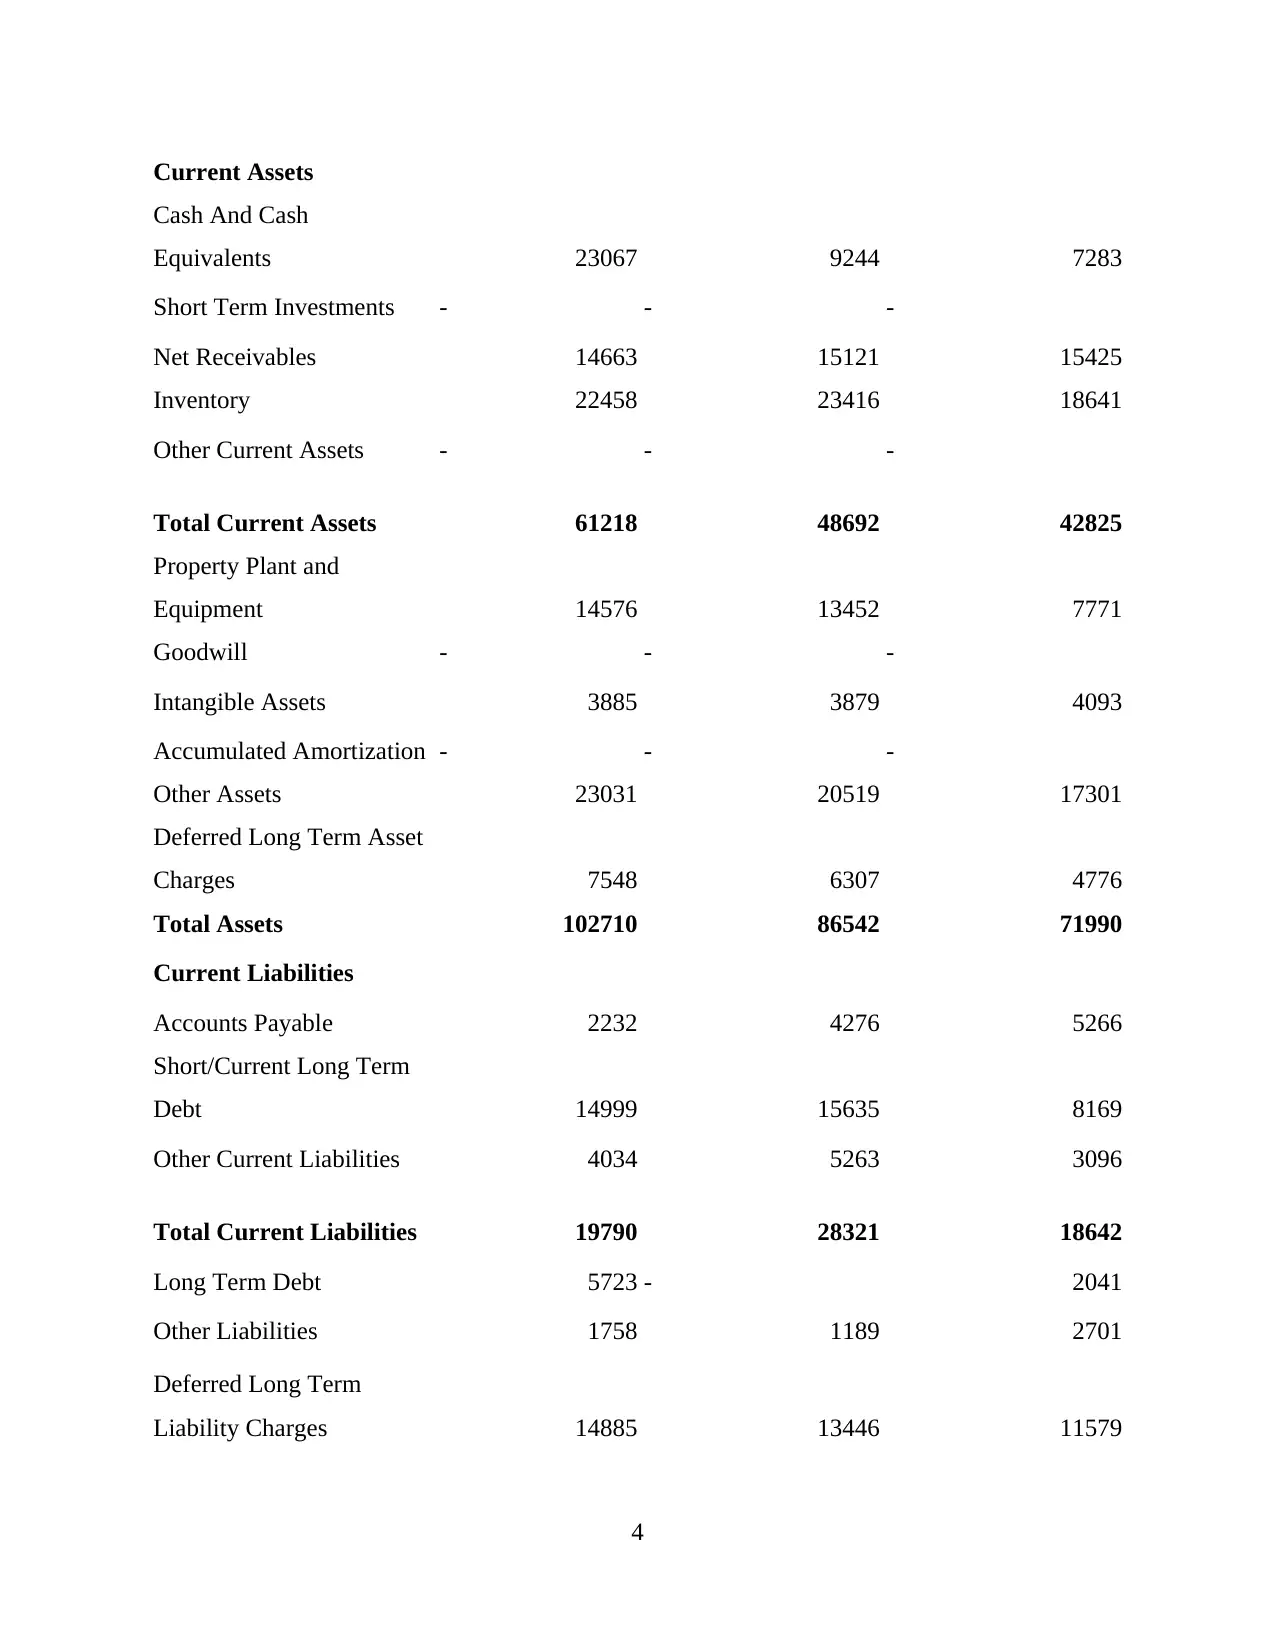
Current Assets
Cash And Cash
Equivalents 23067 9244 7283
Short Term Investments - - -
Net Receivables 14663 15121 15425
Inventory 22458 23416 18641
Other Current Assets - - -
Total Current Assets 61218 48692 42825
Property Plant and
Equipment 14576 13452 7771
Goodwill - - -
Intangible Assets 3885 3879 4093
Accumulated Amortization - - -
Other Assets 23031 20519 17301
Deferred Long Term Asset
Charges 7548 6307 4776
Total Assets 102710 86542 71990
Current Liabilities
Accounts Payable 2232 4276 5266
Short/Current Long Term
Debt 14999 15635 8169
Other Current Liabilities 4034 5263 3096
Total Current Liabilities 19790 28321 18642
Long Term Debt 5723 - 2041
Other Liabilities 1758 1189 2701
Deferred Long Term
Liability Charges 14885 13446 11579
4
⊘ This is a preview!⊘
Do you want full access?
Subscribe today to unlock all pages.
Trusted by 1+ million students worldwide
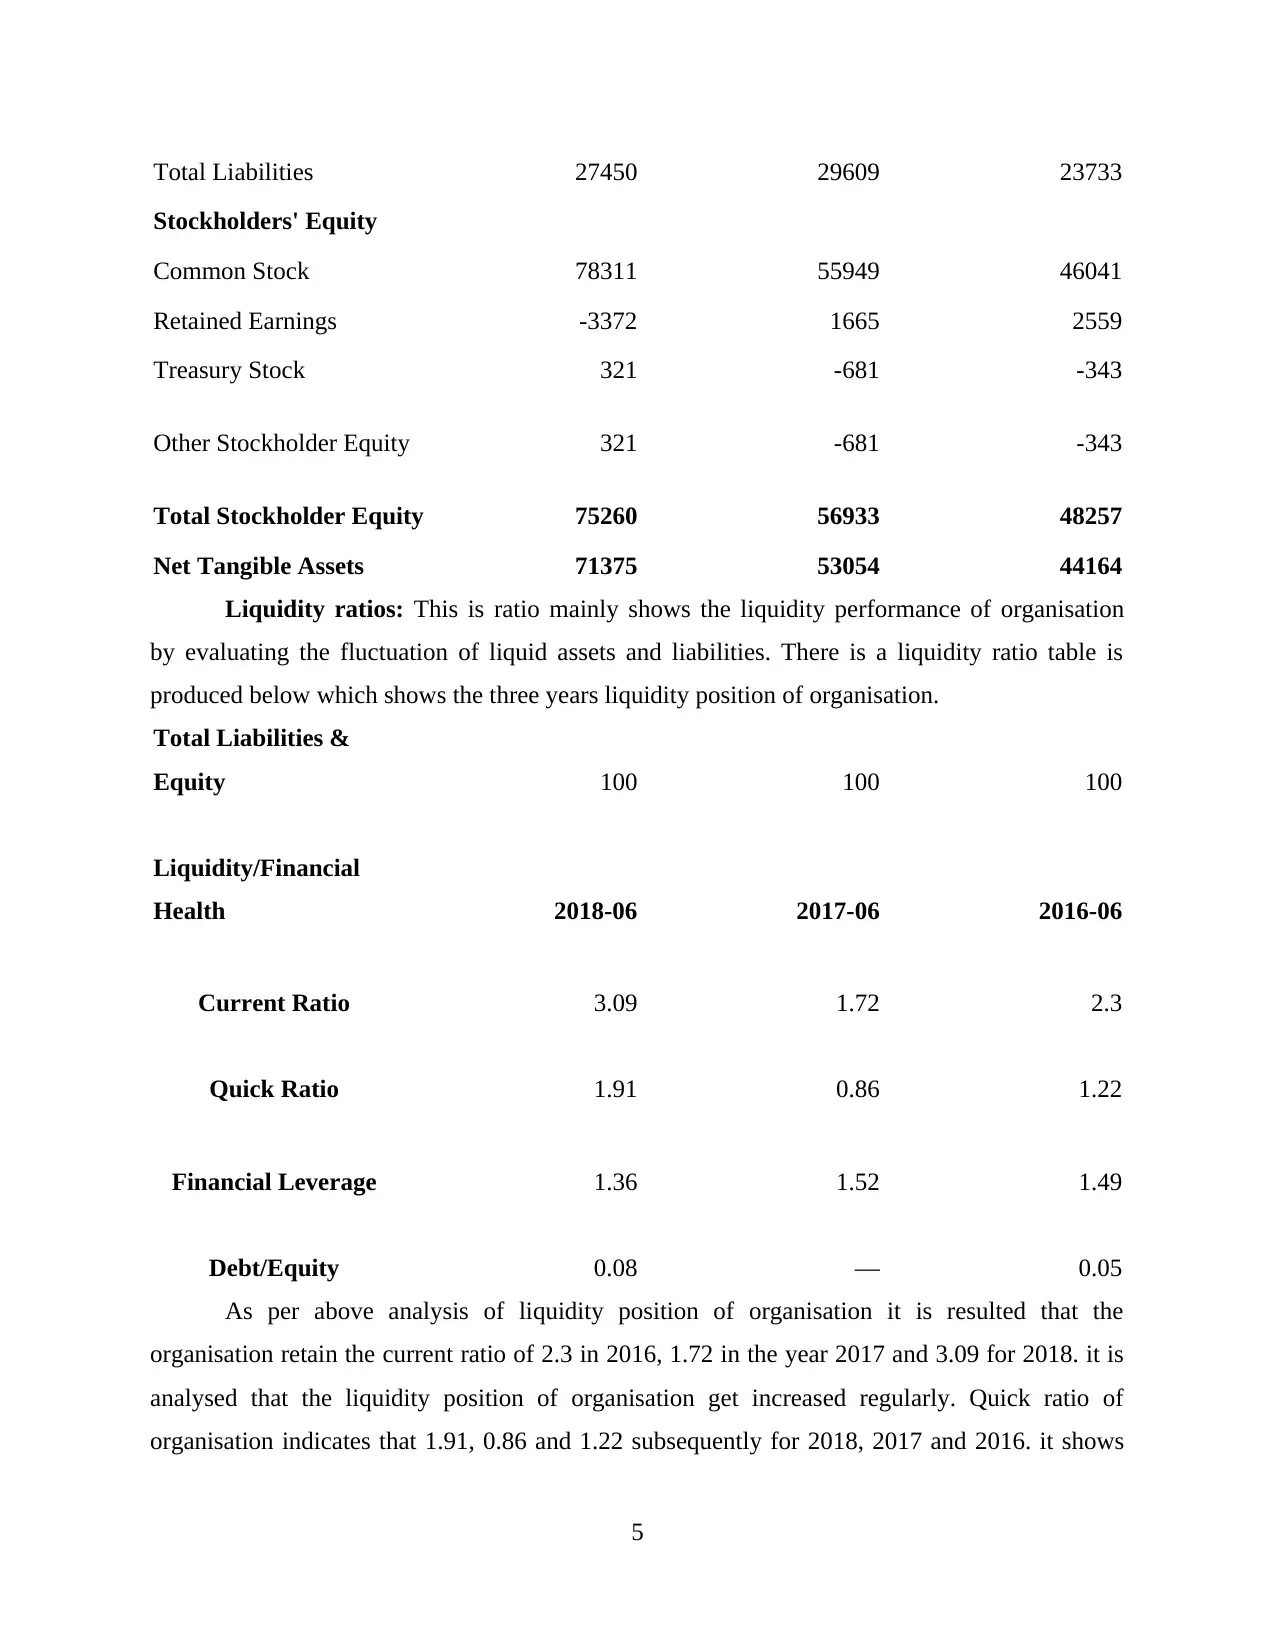
Total Liabilities 27450 29609 23733
Stockholders' Equity
Common Stock 78311 55949 46041
Retained Earnings -3372 1665 2559
Treasury Stock 321 -681 -343
Other Stockholder Equity 321 -681 -343
Total Stockholder Equity 75260 56933 48257
Net Tangible Assets 71375 53054 44164
Liquidity ratios: This is ratio mainly shows the liquidity performance of organisation
by evaluating the fluctuation of liquid assets and liabilities. There is a liquidity ratio table is
produced below which shows the three years liquidity position of organisation.
Total Liabilities &
Equity 100 100 100
Liquidity/Financial
Health 2018-06 2017-06 2016-06
Current Ratio 3.09 1.72 2.3
Quick Ratio 1.91 0.86 1.22
Financial Leverage 1.36 1.52 1.49
Debt/Equity 0.08 — 0.05
As per above analysis of liquidity position of organisation it is resulted that the
organisation retain the current ratio of 2.3 in 2016, 1.72 in the year 2017 and 3.09 for 2018. it is
analysed that the liquidity position of organisation get increased regularly. Quick ratio of
organisation indicates that 1.91, 0.86 and 1.22 subsequently for 2018, 2017 and 2016. it shows
5
Paraphrase This Document
Need a fresh take? Get an instant paraphrase of this document with our AI Paraphraser
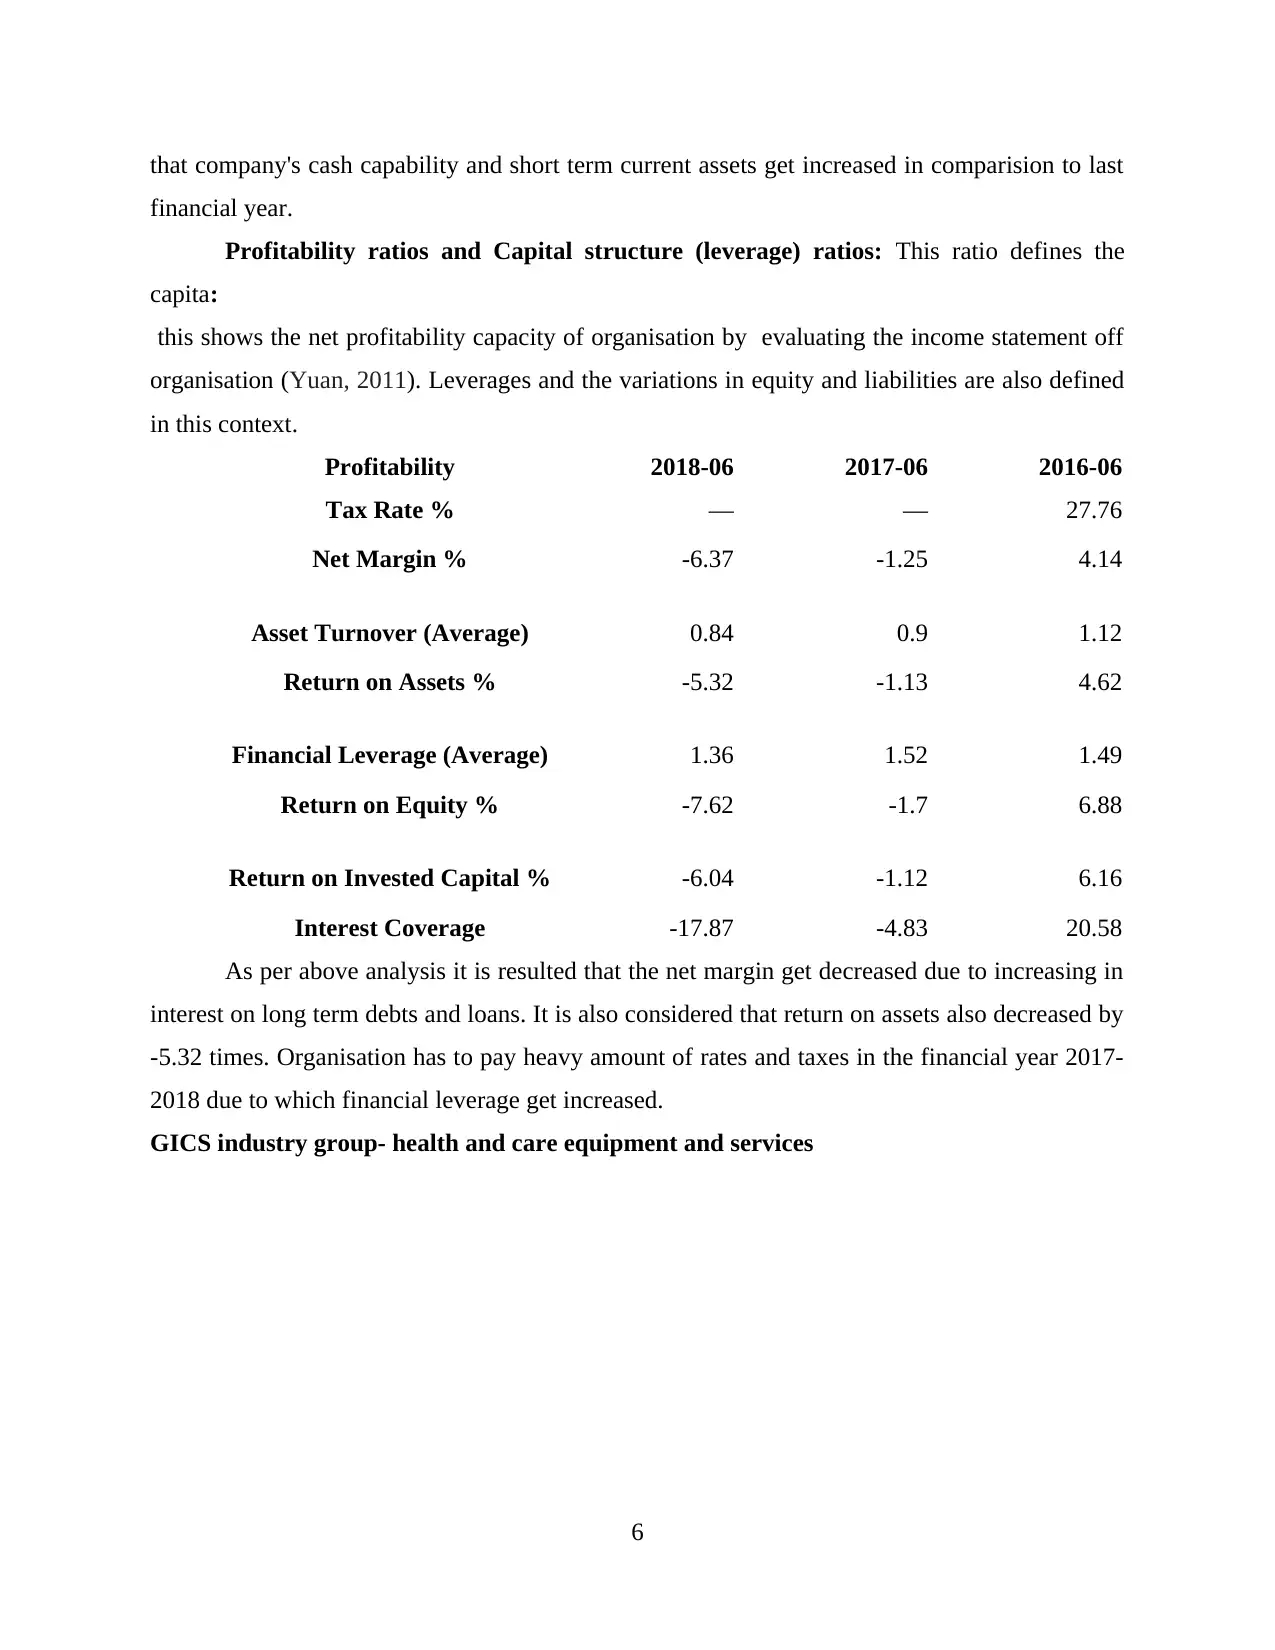
that company's cash capability and short term current assets get increased in comparision to last
financial year.
Profitability ratios and Capital structure (leverage) ratios: This ratio defines the
capita:
this shows the net profitability capacity of organisation by evaluating the income statement off
organisation (Yuan, 2011). Leverages and the variations in equity and liabilities are also defined
in this context.
Profitability 2018-06 2017-06 2016-06
Tax Rate % — — 27.76
Net Margin % -6.37 -1.25 4.14
Asset Turnover (Average) 0.84 0.9 1.12
Return on Assets % -5.32 -1.13 4.62
Financial Leverage (Average) 1.36 1.52 1.49
Return on Equity % -7.62 -1.7 6.88
Return on Invested Capital % -6.04 -1.12 6.16
Interest Coverage -17.87 -4.83 20.58
As per above analysis it is resulted that the net margin get decreased due to increasing in
interest on long term debts and loans. It is also considered that return on assets also decreased by
-5.32 times. Organisation has to pay heavy amount of rates and taxes in the financial year 2017-
2018 due to which financial leverage get increased.
GICS industry group- health and care equipment and services
6
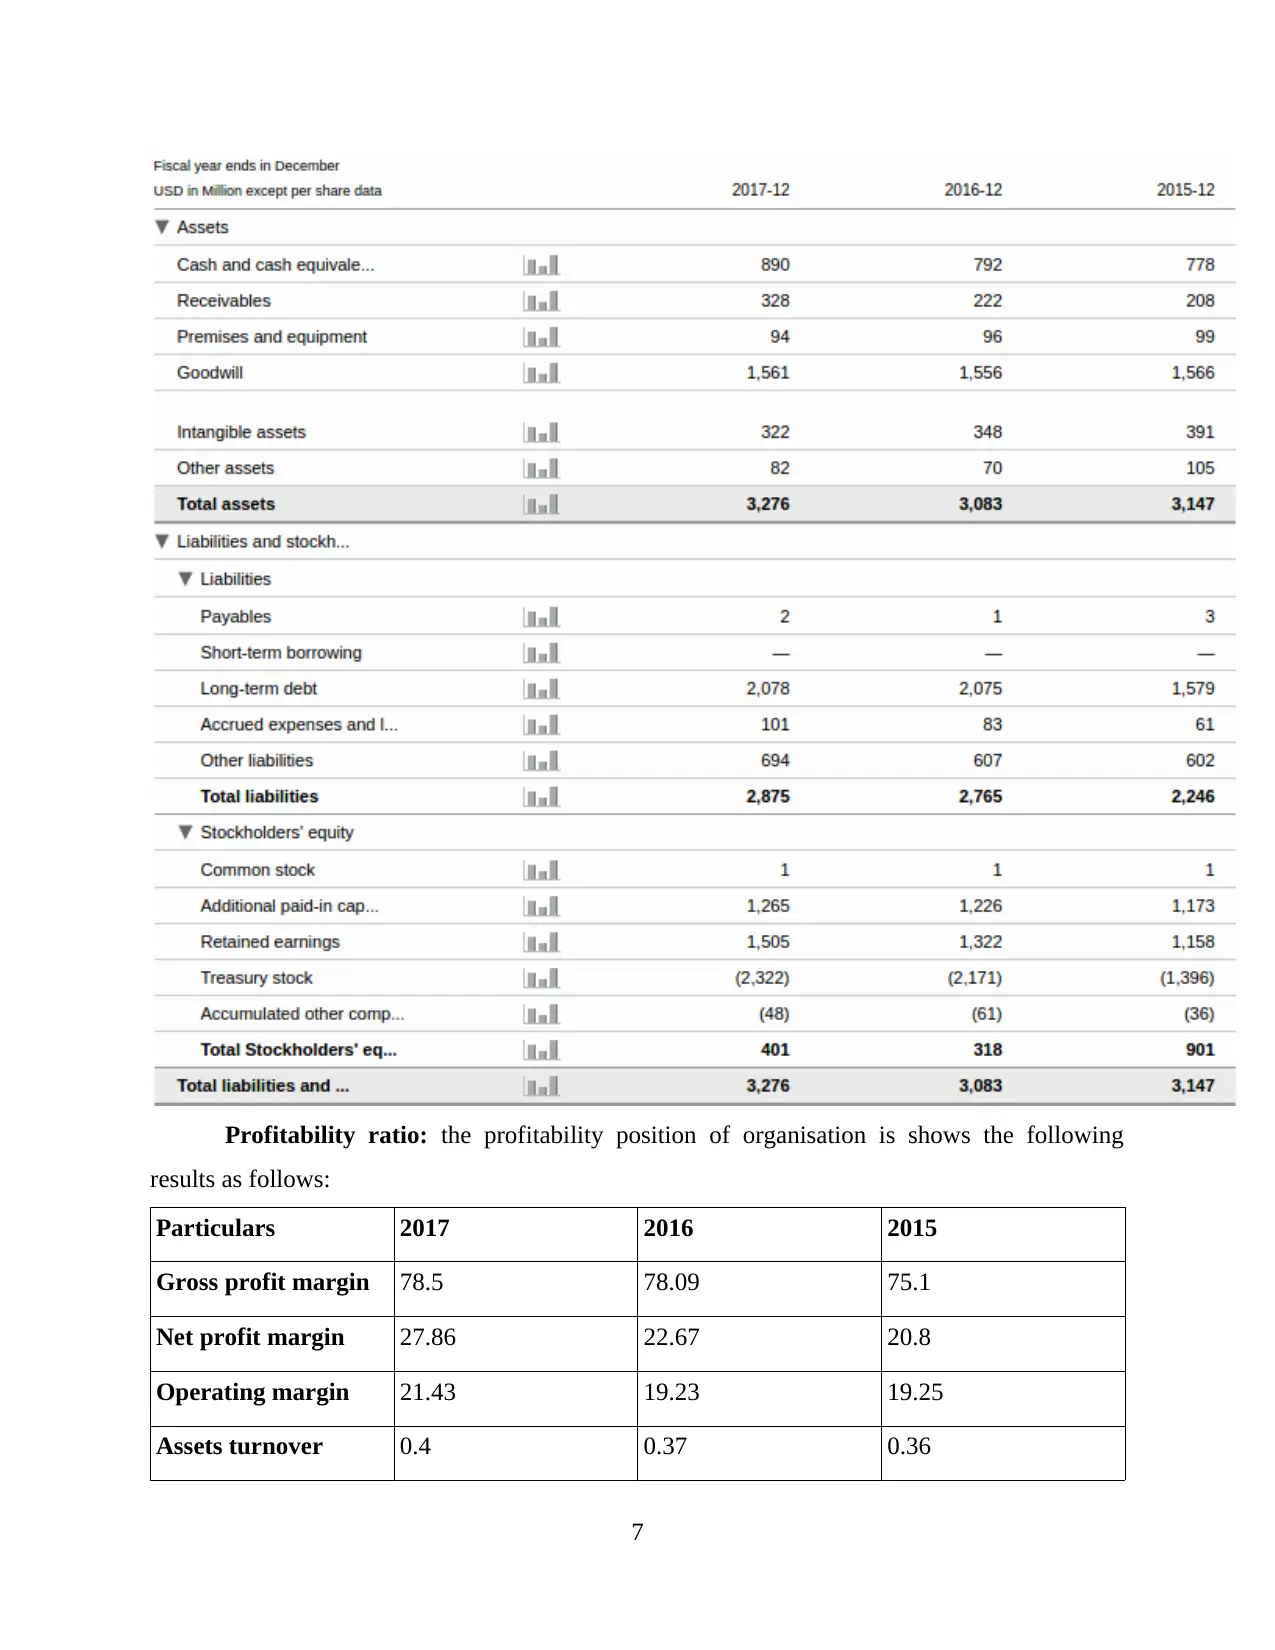
Profitability ratio: the profitability position of organisation is shows the following
results as follows:
Particulars 2017 2016 2015
Gross profit margin 78.5 78.09 75.1
Net profit margin 27.86 22.67 20.8
Operating margin 21.43 19.23 19.25
Assets turnover 0.4 0.37 0.36
7
results as follows:
Particulars 2017 2016 2015
Gross profit margin 78.5 78.09 75.1
Net profit margin 27.86 22.67 20.8
Operating margin 21.43 19.23 19.25
Assets turnover 0.4 0.37 0.36
7
⊘ This is a preview!⊘
Do you want full access?
Subscribe today to unlock all pages.
Trusted by 1+ million students worldwide
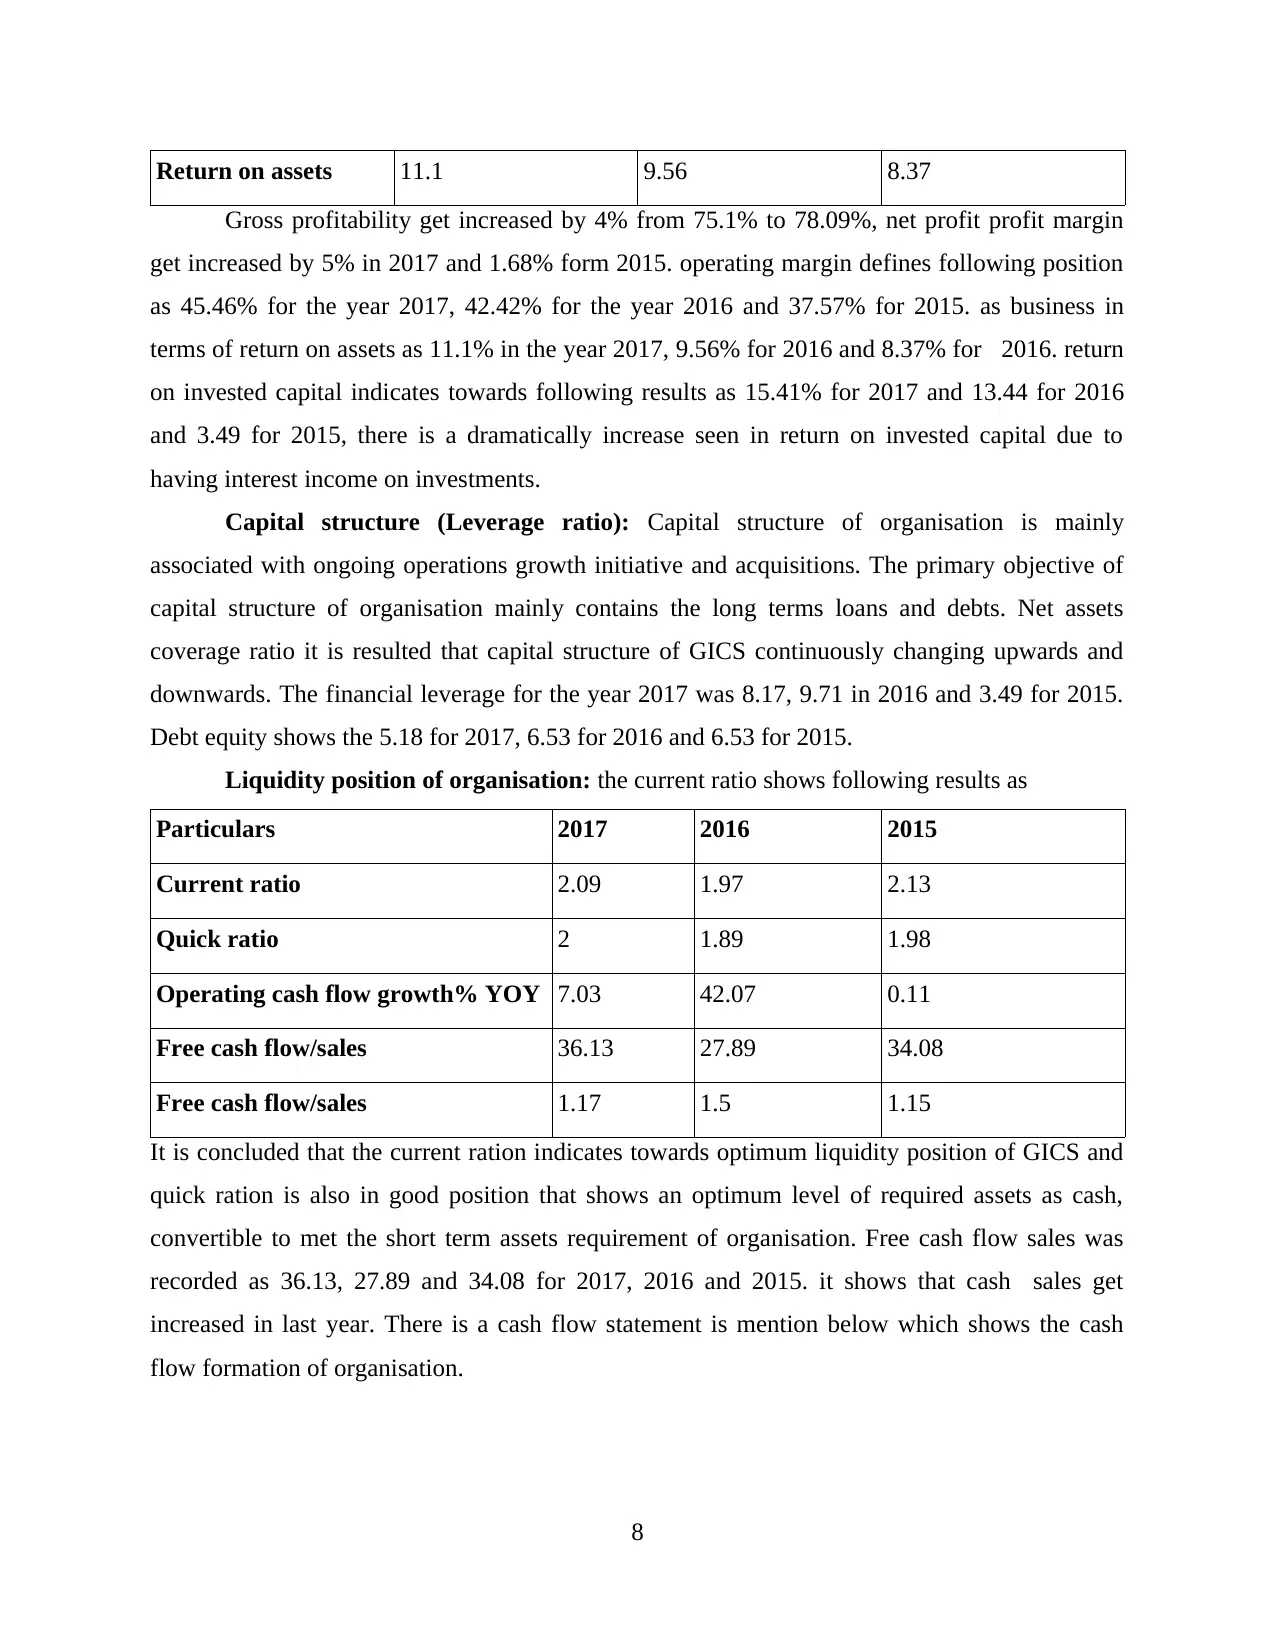
Return on assets 11.1 9.56 8.37
Gross profitability get increased by 4% from 75.1% to 78.09%, net profit profit margin
get increased by 5% in 2017 and 1.68% form 2015. operating margin defines following position
as 45.46% for the year 2017, 42.42% for the year 2016 and 37.57% for 2015. as business in
terms of return on assets as 11.1% in the year 2017, 9.56% for 2016 and 8.37% for 2016. return
on invested capital indicates towards following results as 15.41% for 2017 and 13.44 for 2016
and 3.49 for 2015, there is a dramatically increase seen in return on invested capital due to
having interest income on investments.
Capital structure (Leverage ratio): Capital structure of organisation is mainly
associated with ongoing operations growth initiative and acquisitions. The primary objective of
capital structure of organisation mainly contains the long terms loans and debts. Net assets
coverage ratio it is resulted that capital structure of GICS continuously changing upwards and
downwards. The financial leverage for the year 2017 was 8.17, 9.71 in 2016 and 3.49 for 2015.
Debt equity shows the 5.18 for 2017, 6.53 for 2016 and 6.53 for 2015.
Liquidity position of organisation: the current ratio shows following results as
Particulars 2017 2016 2015
Current ratio 2.09 1.97 2.13
Quick ratio 2 1.89 1.98
Operating cash flow growth% YOY 7.03 42.07 0.11
Free cash flow/sales 36.13 27.89 34.08
Free cash flow/sales 1.17 1.5 1.15
It is concluded that the current ration indicates towards optimum liquidity position of GICS and
quick ration is also in good position that shows an optimum level of required assets as cash,
convertible to met the short term assets requirement of organisation. Free cash flow sales was
recorded as 36.13, 27.89 and 34.08 for 2017, 2016 and 2015. it shows that cash sales get
increased in last year. There is a cash flow statement is mention below which shows the cash
flow formation of organisation.
8
Paraphrase This Document
Need a fresh take? Get an instant paraphrase of this document with our AI Paraphraser
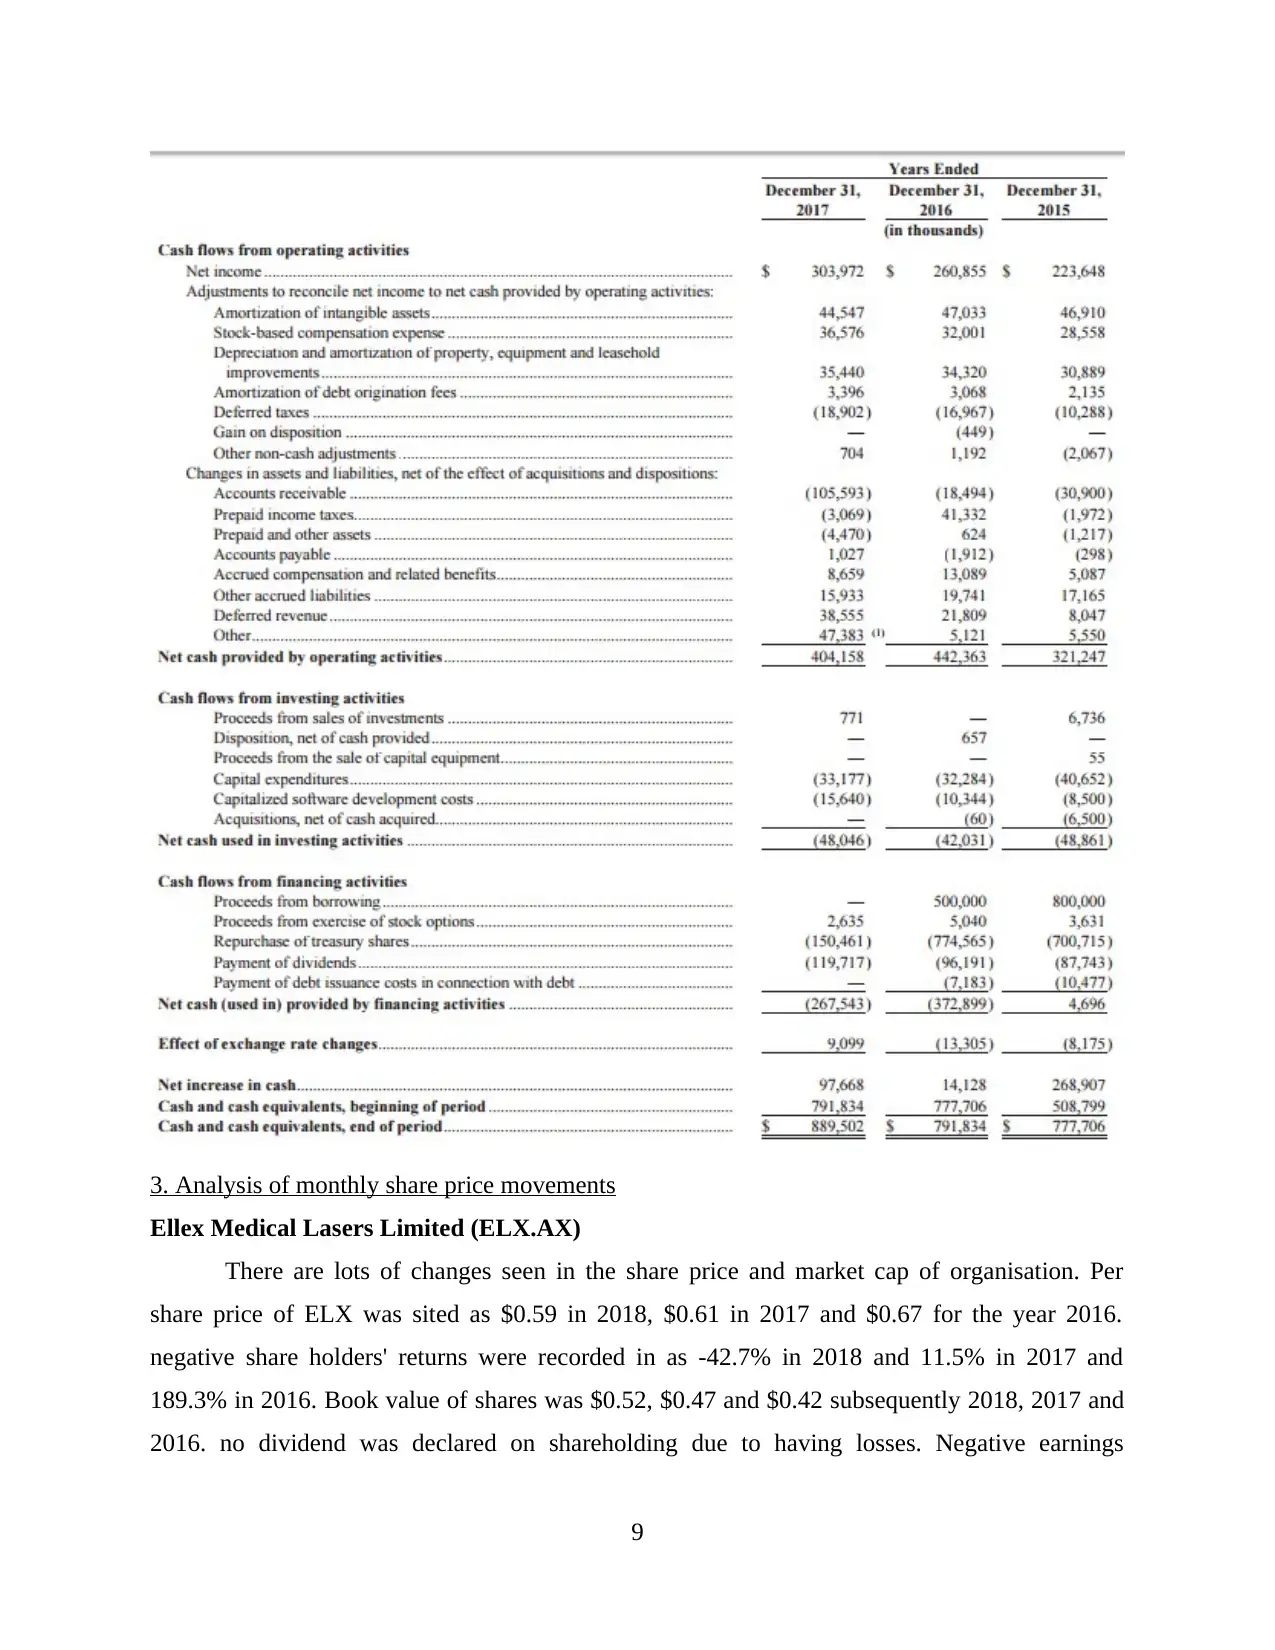
3. Analysis of monthly share price movements
Ellex Medical Lasers Limited (ELX.AX)
There are lots of changes seen in the share price and market cap of organisation. Per
share price of ELX was sited as $0.59 in 2018, $0.61 in 2017 and $0.67 for the year 2016.
negative share holders' returns were recorded in as -42.7% in 2018 and 11.5% in 2017 and
189.3% in 2016. Book value of shares was $0.52, $0.47 and $0.42 subsequently 2018, 2017 and
2016. no dividend was declared on shareholding due to having losses. Negative earnings
9
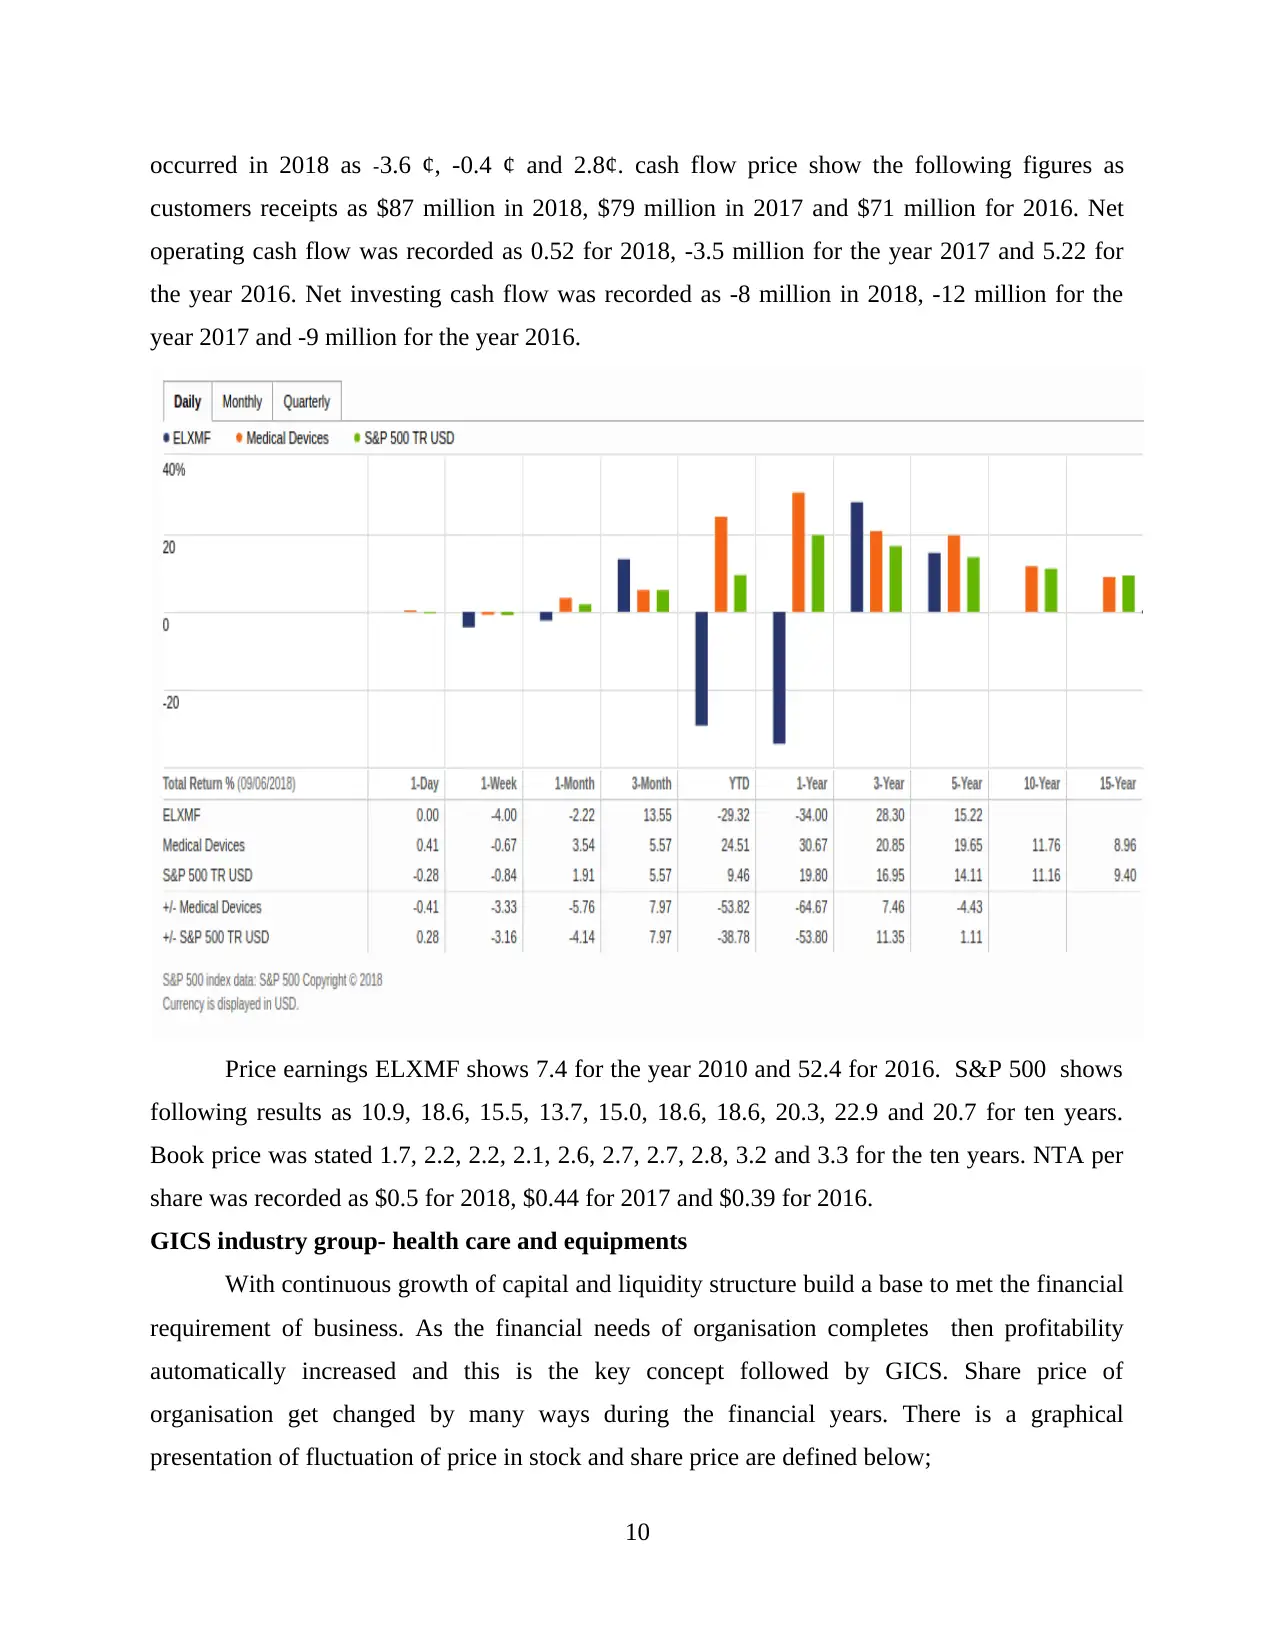
occurred in 2018 as -3.6 ¢, -0.4 ¢ and 2.8¢. cash flow price show the following figures as
customers receipts as $87 million in 2018, $79 million in 2017 and $71 million for 2016. Net
operating cash flow was recorded as 0.52 for 2018, -3.5 million for the year 2017 and 5.22 for
the year 2016. Net investing cash flow was recorded as -8 million in 2018, -12 million for the
year 2017 and -9 million for the year 2016.
Price earnings ELXMF shows 7.4 for the year 2010 and 52.4 for 2016. S&P 500 shows
following results as 10.9, 18.6, 15.5, 13.7, 15.0, 18.6, 18.6, 20.3, 22.9 and 20.7 for ten years.
Book price was stated 1.7, 2.2, 2.2, 2.1, 2.6, 2.7, 2.7, 2.8, 3.2 and 3.3 for the ten years. NTA per
share was recorded as $0.5 for 2018, $0.44 for 2017 and $0.39 for 2016.
GICS industry group- health care and equipments
With continuous growth of capital and liquidity structure build a base to met the financial
requirement of business. As the financial needs of organisation completes then profitability
automatically increased and this is the key concept followed by GICS. Share price of
organisation get changed by many ways during the financial years. There is a graphical
presentation of fluctuation of price in stock and share price are defined below;
10
⊘ This is a preview!⊘
Do you want full access?
Subscribe today to unlock all pages.
Trusted by 1+ million students worldwide
1 out of 18
Related Documents


Your All-in-One AI-Powered Toolkit for Academic Success.
+13062052269
info@desklib.com
Available 24*7 on WhatsApp / Email
![[object Object]](/_next/static/media/star-bottom.7253800d.svg)
Unlock your academic potential
Copyright © 2020–2026 A2Z Services. All Rights Reserved. Developed and managed by ZUCOL.