Comprehensive Financial Statement Analysis Report - University

Verified

Added on  2019/12/04

|8
|2125
|313
Report
AI Summary
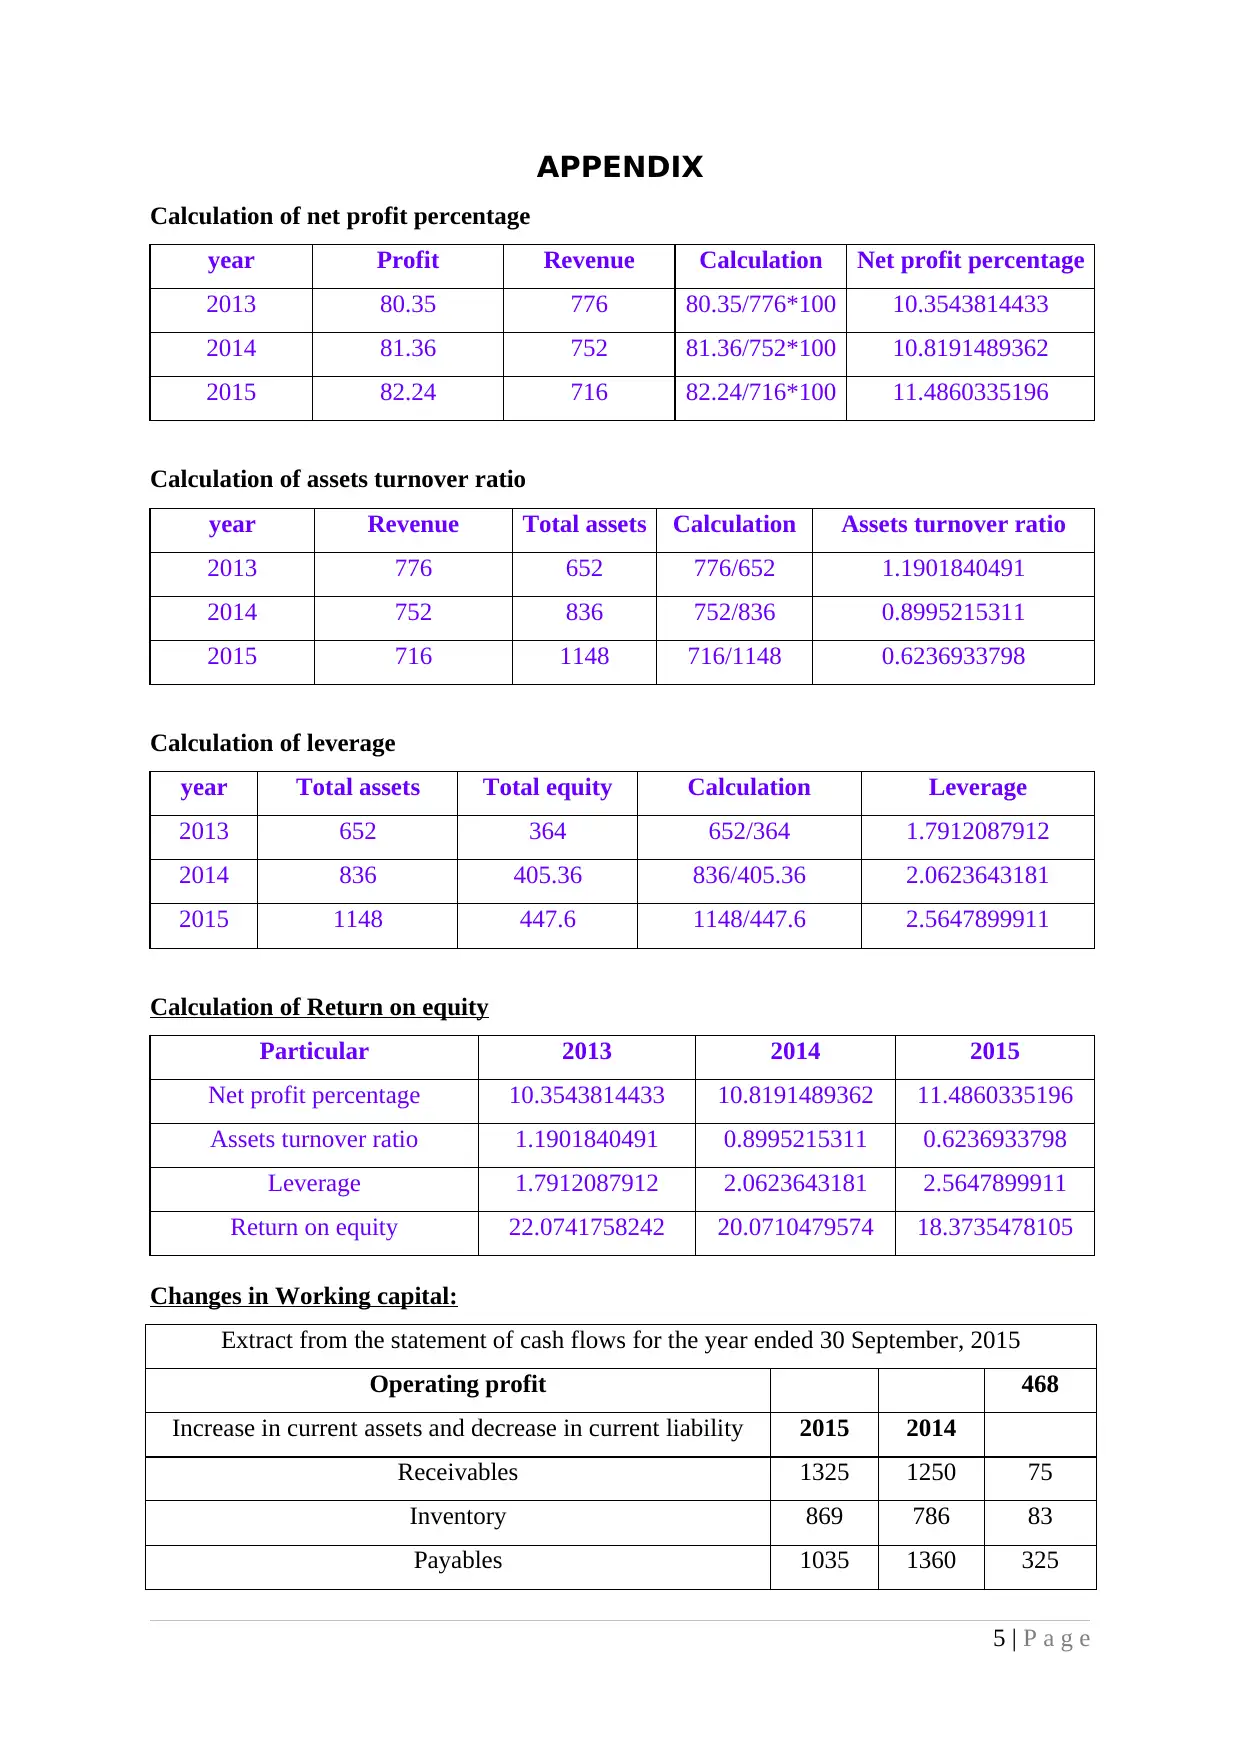
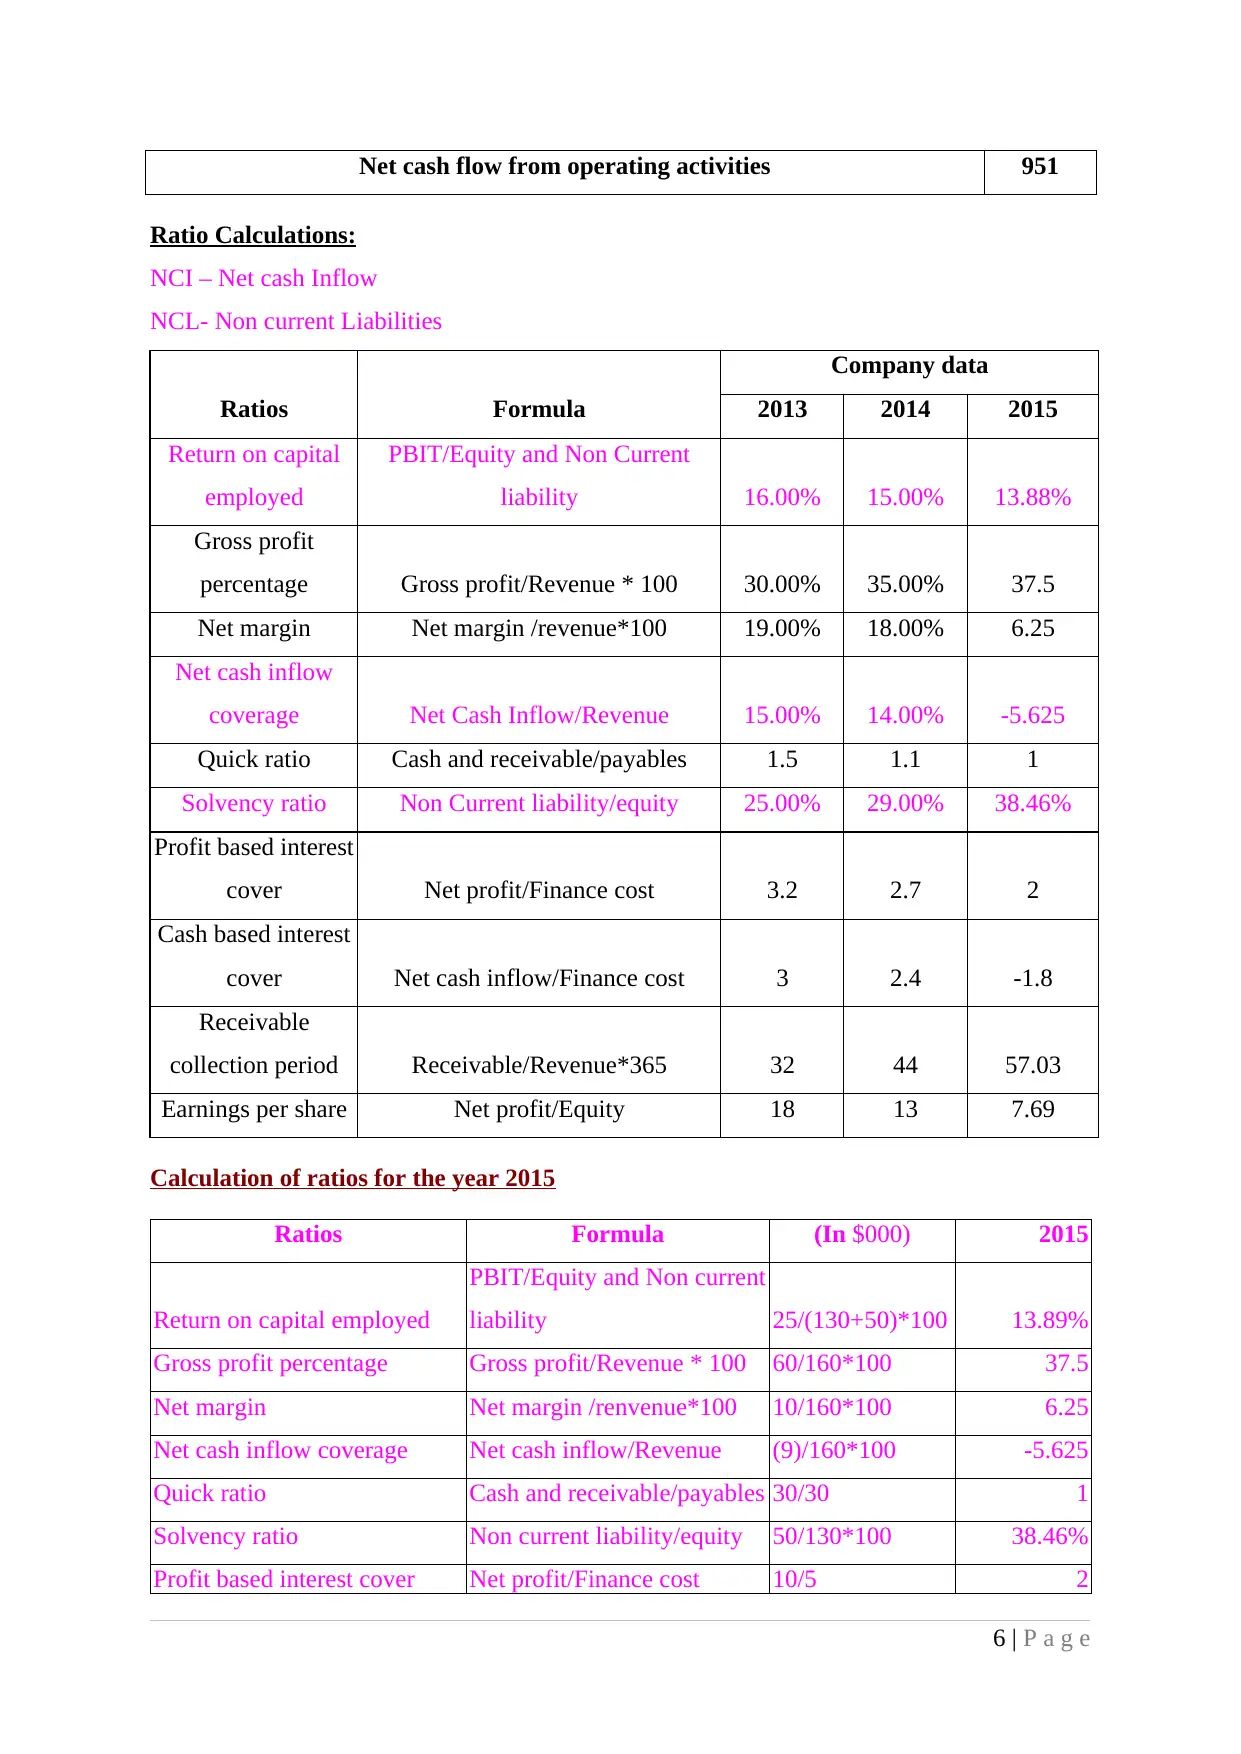
This report provides a comprehensive analysis of financial statements, encompassing key aspects such as objectives, the conceptual framework of 2010, and Dupont analysis to evaluate return on equity through operational efficiency, asset utilization, and financial leverage. It delves into changes in working capital, assessing the impact on short-term obligations and future growth, and examines earning quality, identifying factors that influence an organization's earning capacity. The report includes ratio calculations, detailed interpretations, and recommendations for business improvement, particularly focusing on improving sales, profitability, and liquidity. It also differentiates between operating profits and cash flows, highlighting the significance of both cash and non-cash expenditures. The analysis incorporates data from multiple years to identify trends and provides insights into a company's financial health and performance. The appendices include detailed calculations of key financial metrics, such as net profit percentage, asset turnover ratio, leverage, and return on equity, as well as working capital and ratio calculations.
Document Page
Financial statement
analysis
tabler-icon-diamond-filled.svg

Paraphrase This Document

Need a fresh take? Get an instant paraphrase of this document with our AI Paraphraser
Document Page
Table of Contents
PART A......................................................................................................................................1
(1) Objectives of financial statements...............................................................................1
(2) Conceptual Framework 2010......................................................................................1
(3) Dupont analysis...........................................................................................................1
(4) Changes in working capital.........................................................................................1
(5) Earning quality............................................................................................................2
PART B......................................................................................................................................2
(6) Ratio calculations........................................................................................................2
(7) Interpretations..............................................................................................................2
(8) Recommendation.........................................................................................................2
(9) Cash flow and profit....................................................................................................2
REFERENCE.............................................................................................................................3
APPENDIX................................................................................................................................1
Document Page
PART A
(1) Objectives of financial statements
Equity investors have the objectives to know the business future earning capacity,
growth potential and security of their holdings. All the investors are very much interested to
get higher amount of returns. Therefore, they make risk and return analysis associated with
their invested funds. Lenders such as bond investors have the objectives to know the short
term as well as long term solvency of the business (Bushman and Smith, 2001). They
determine the security of their funds. Further, they require timely the interest and principal
payments. Their expectations about return are highly depend upon the amount, timing and the
uncertainty of the business future cash flows. Thus, they assess the business ability to get
higher the amount of profitability and its stability. They determine the Government and other
agencies are interested to know the business activities to ensure efficient allocation of
resources so as to improve their tax incomes.
(2) Conceptual Framework 2010
(a) Full disclosure principle says that all the required information for investors, lenders
and other users should be disclosed in the financial statements. Going concern principle
assumes that company will operate for a longer time period (Scott, 2014). Further, Business
entity principle says that all the business is separate from the entity. Therefore, financial
statement shows only the business transaction not the owner's personal transaction.
The principles are more effective than regulating accounting practices and laws. For
instance, generally accepted accounting principles (GAAP) mainly aims at good reporting of
the financial statements. These are the guidelines that help managers to prepare the
company's financial statements. In the absence of these guidelines, managers cannot provide
reliable and consistent information to various stakeholders. However, rules based accounting
only states the rules that must be followed for preparing the financial statements. Rules based
accounting may includes complex set of rules hence, cannot be understandable easily by the
managers. For instance, accounting laws required that financial statements do not include
any incorrect information. It requires that the financial statements do not includes any
fraudulent behaviour without indicating that how it can be eliminated. In case of not
following the rules, business can be levied lawsuits or penalties. However, principles indicate
the way for preparation of the statements. Preparing the statements by following the
accounting principles, business can eliminate the errors and reduce the fraudulent activities.
Thus, it can be concluded that principles are more effective than set rules and laws.
1 | P a g e
Document Page
(b) Relevance characteristic says that all the relevant information should be disclosed
because misstatements can influence the user decisions negatively. Another characteristic is
comparability, says that all the financial information must be comparable to the other
accounting periods (Edwards, 2013). Therefore, users can identify the comparative changes
and trends of the business performance and the financial position.
(3) Dupont analysis
(a) It is a measurement of return on equity through identifying the operational
efficiency, assets uses efficiency and financial leverage (Chang, Chichernea and
HassabElnaby, 2014).
ROE = Profit margin*Total assets turnover*assets to equity
Calculation is enclosed in appendix
(b) Interpretation: In the year 2015, the profit margin, assets turnover and financial
leverage ratios of the company are 11.48%, 0.62 and 2.56 respectively. Therefore, the return
on equity is 18.37%. In all the three years, the return on equity is 22.07, 20.07 and 18.37
respectively. The ratio shows a declining trend continuously due to decreasing the assets
turnover ratio. However, the profit margin and leverage get increased over the period. Thus, it
can be recommended that company has to maintain its assets in an efficient manner. By using
assets efficiently, company can get greater the return to equity. This in turn helps to enhance
business return on equity.
(4) Changes in working capital
(a) Calculations
Enclosed in Appendix
(b) Interpretations
From the above statement, it can be concluded that company is increasing its current
assets and decreasing its current liability so as to improve the working capital (Financial
Ratio Analysis, 2015). This in turn helps organization to increase the ability to pay its short
term obligations. Moreover, it helps business to improve the growth in future period.
(5) Earning quality
Investors determine the earning capacity of the organization. Decreasing trend of
earnings result in reducing the business growth. Decreased business profits, earning per
share, price to earnings growth ratio, negative cash flow, inadequate liquidity and decreased
solvency position indicate decreased earning capacity of the business (Reimers, 2013).
2 | P a g e
tabler-icon-diamond-filled.svg

Paraphrase This Document

Need a fresh take? Get an instant paraphrase of this document with our AI Paraphraser
Document Page
PART B
(6) Ratio calculations
Enclosed in Appendix
(7) Interpretations
Fraser & Neave gross profit tends to increase while the net operational results get
declined to 6.25% because of high operating cost. However, net cash flow of the company is
negative amounted to -9. Moreover, liquidity of the company gets declined over the period
(DRURY, 2013). However, the solvency position of the company indicates its ability to pay
its long term liabilities. In all the three years, the solvency ratio of the company is 25%, 29%
and 38.46% respectively. The ratio show an increasing trend implies that company is more
able to discharges its long term obligations. Further, the earning per share gets declined to
7.69% that indicates lower shareholder returns. In addition to it, return on capital employed
get reduces from 15% to 13.89% in the year 2015. It indicates that company is getting lower
the profits on the capital employed. On contrary, receivable turnover ratio get inclined from
44 to 57.03 indicate that company is more efficiently using its assets.
(8) Recommendation
Mr. Shinawatra has to improve its sales and profitability so as to avail positive cash
flow. Further, operating cost should be declined for getting higher amount of profits. It helps
to improve the business performance (Zimmerman and Yahya-Zadeh, 2011). On contrary,
business has to increase its liquidity position. By doing that company will be more able to
discharge its short term obligations. Further, through enhancing business profits and financial
strengthen its position company can increase return on capital employed and earnings per
share. This in turn, company can retain its existing investors and attract new investors also.
(9) Cash flow and profit
Operating profits and cash flows are different because profitability statements involve
both the cash and non cash expenditures such as depreciation. Further, transactions are
recorded on accrual basis not on cash basis (Lee, 2014). Therefore, it may be possible that
cash flows can be negative in case of profit availability.
3 | P a g e
Document Page
REFERENCE
Books and Journals
Bushman, R. M. and Smith, A. J., 2001. Financial accounting information and corporate
governance. Journal of accounting and Economics. 32(1). pp.237-333.
Chang, K.J., Chichernea, D.C. and HassabElnaby, H.R., 2014. On the DuPont analysis in the
health care industry. Journal of Accounting and Public Policy. 33(1). pp.83-103.
DRURY, C. M., 2013. Management and cost accounting. Springer.
Edwards, J. R., 2013. A History of Financial Accounting (RLE Accounting) (Vol. 29).
Routledge.
Lee, T. A., 2014. Cash Flow Reporting (RLE Accounting): A Recent History of an
Accounting Practice. Routledge.
Reimers, J. L., 2013. Financial Accounting: Pearson New International Edition: A Business
Process Approach. Pearson Higher Ed.
Scott, W. R., 2014. Financial accounting theory. Pearson Education Canada.
Zimmerman, J. L. and Yahya-Zadeh, M., 2011. Accounting for decision making and control.
Issues in Accounting Education. 26(1). pp.258-259.
Online
Financial Ratio Analysis, 2015. [Online]. Available through:
<http://www.slideshare.net/algelyee/financial-ratio-analysis-final-report>. [Accessed
on 22 December 2015].
4 | P a g e
Document Page
APPENDIX
Calculation of net profit percentage
year Profit Revenue Calculation Net profit percentage
2013 80.35 776 80.35/776*100 10.3543814433
2014 81.36 752 81.36/752*100 10.8191489362
2015 82.24 716 82.24/716*100 11.4860335196
Calculation of assets turnover ratio
year Revenue Total assets Calculation Assets turnover ratio
2013 776 652 776/652 1.1901840491
2014 752 836 752/836 0.8995215311
2015 716 1148 716/1148 0.6236933798
Calculation of leverage
year Total assets Total equity Calculation Leverage
2013 652 364 652/364 1.7912087912
2014 836 405.36 836/405.36 2.0623643181
2015 1148 447.6 1148/447.6 2.5647899911
Calculation of Return on equity
Particular 2013 2014 2015
Net profit percentage 10.3543814433 10.8191489362 11.4860335196
Assets turnover ratio 1.1901840491 0.8995215311 0.6236933798
Leverage 1.7912087912 2.0623643181 2.5647899911
Return on equity 22.0741758242 20.0710479574 18.3735478105
Changes in Working capital:
Extract from the statement of cash flows for the year ended 30 September, 2015
Operating profit 468
Increase in current assets and decrease in current liability 2015 2014
Receivables 1325 1250 75
Inventory 869 786 83
Payables 1035 1360 325
5 | P a g e
tabler-icon-diamond-filled.svg

Paraphrase This Document

Need a fresh take? Get an instant paraphrase of this document with our AI Paraphraser
Document Page
Net cash flow from operating activities 951
Ratio Calculations:
NCI – Net cash Inflow
NCL- Non current Liabilities
Ratios Formula
Company data
2013 2014 2015
Return on capital
employed
PBIT/Equity and Non Current
liability 16.00% 15.00% 13.88%
Gross profit
percentage Gross profit/Revenue * 100 30.00% 35.00% 37.5
Net margin Net margin /revenue*100 19.00% 18.00% 6.25
Net cash inflow
coverage Net Cash Inflow/Revenue 15.00% 14.00% -5.625
Quick ratio Cash and receivable/payables 1.5 1.1 1
Solvency ratio Non Current liability/equity 25.00% 29.00% 38.46%
Profit based interest
cover Net profit/Finance cost 3.2 2.7 2
Cash based interest
cover Net cash inflow/Finance cost 3 2.4 -1.8
Receivable
collection period Receivable/Revenue*365 32 44 57.03
Earnings per share Net profit/Equity 18 13 7.69
Calculation of ratios for the year 2015
Ratios Formula (In $000) 2015
Return on capital employed
PBIT/Equity and Non current
liability 25/(130+50)*100 13.89%
Gross profit percentage Gross profit/Revenue * 100 60/160*100 37.5
Net margin Net margin /renvenue*100 10/160*100 6.25
Net cash inflow coverage Net cash inflow/Revenue (9)/160*100 -5.625
Quick ratio Cash and receivable/payables 30/30 1
Solvency ratio Non current liability/equity 50/130*100 38.46%
Profit based interest cover Net profit/Finance cost 10/5 2
6 | P a g e
chevron_up_icon
1 out of 8
circle_padding
hide_on_mobile
zoom_out_icon
[object Object]