Financial Analysis and Performance of Glow Sheets Limited
VerifiedAdded on 2020/10/22
|10
|1952
|203
Report
AI Summary
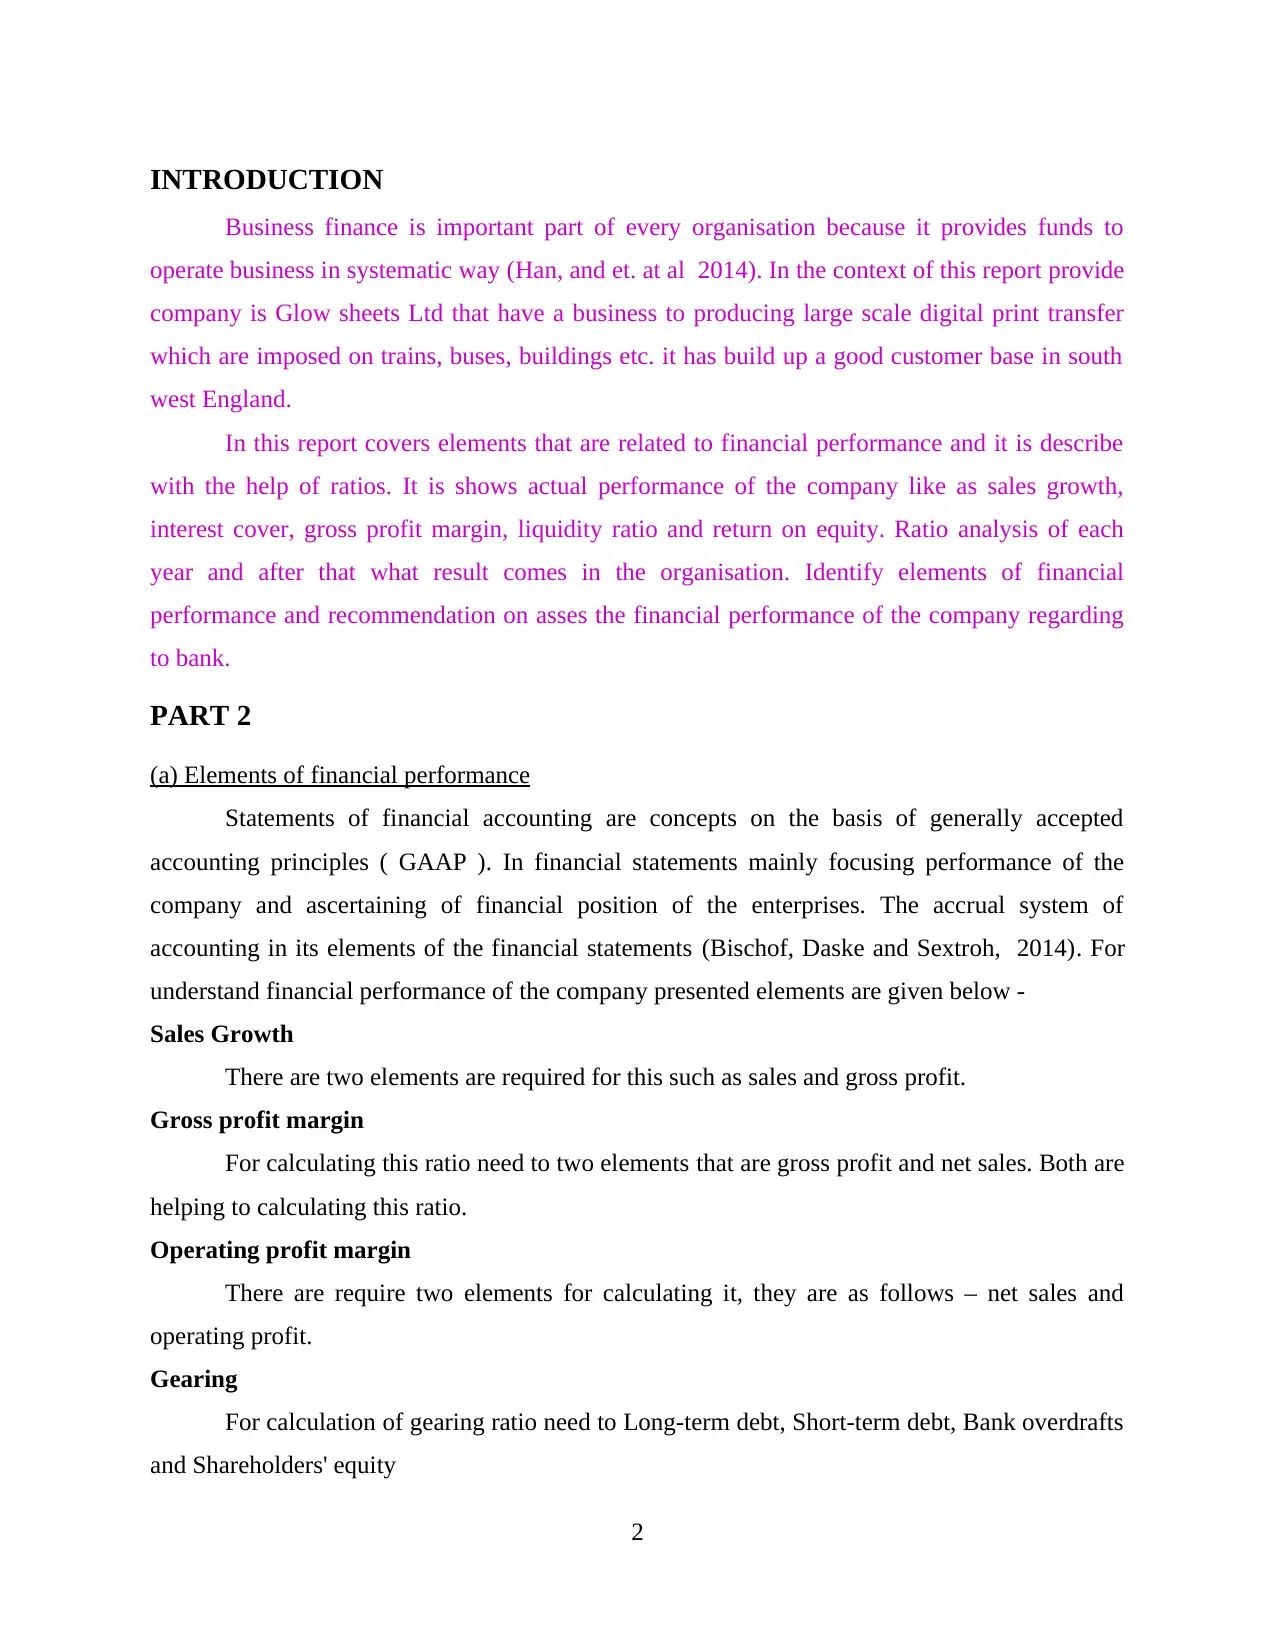
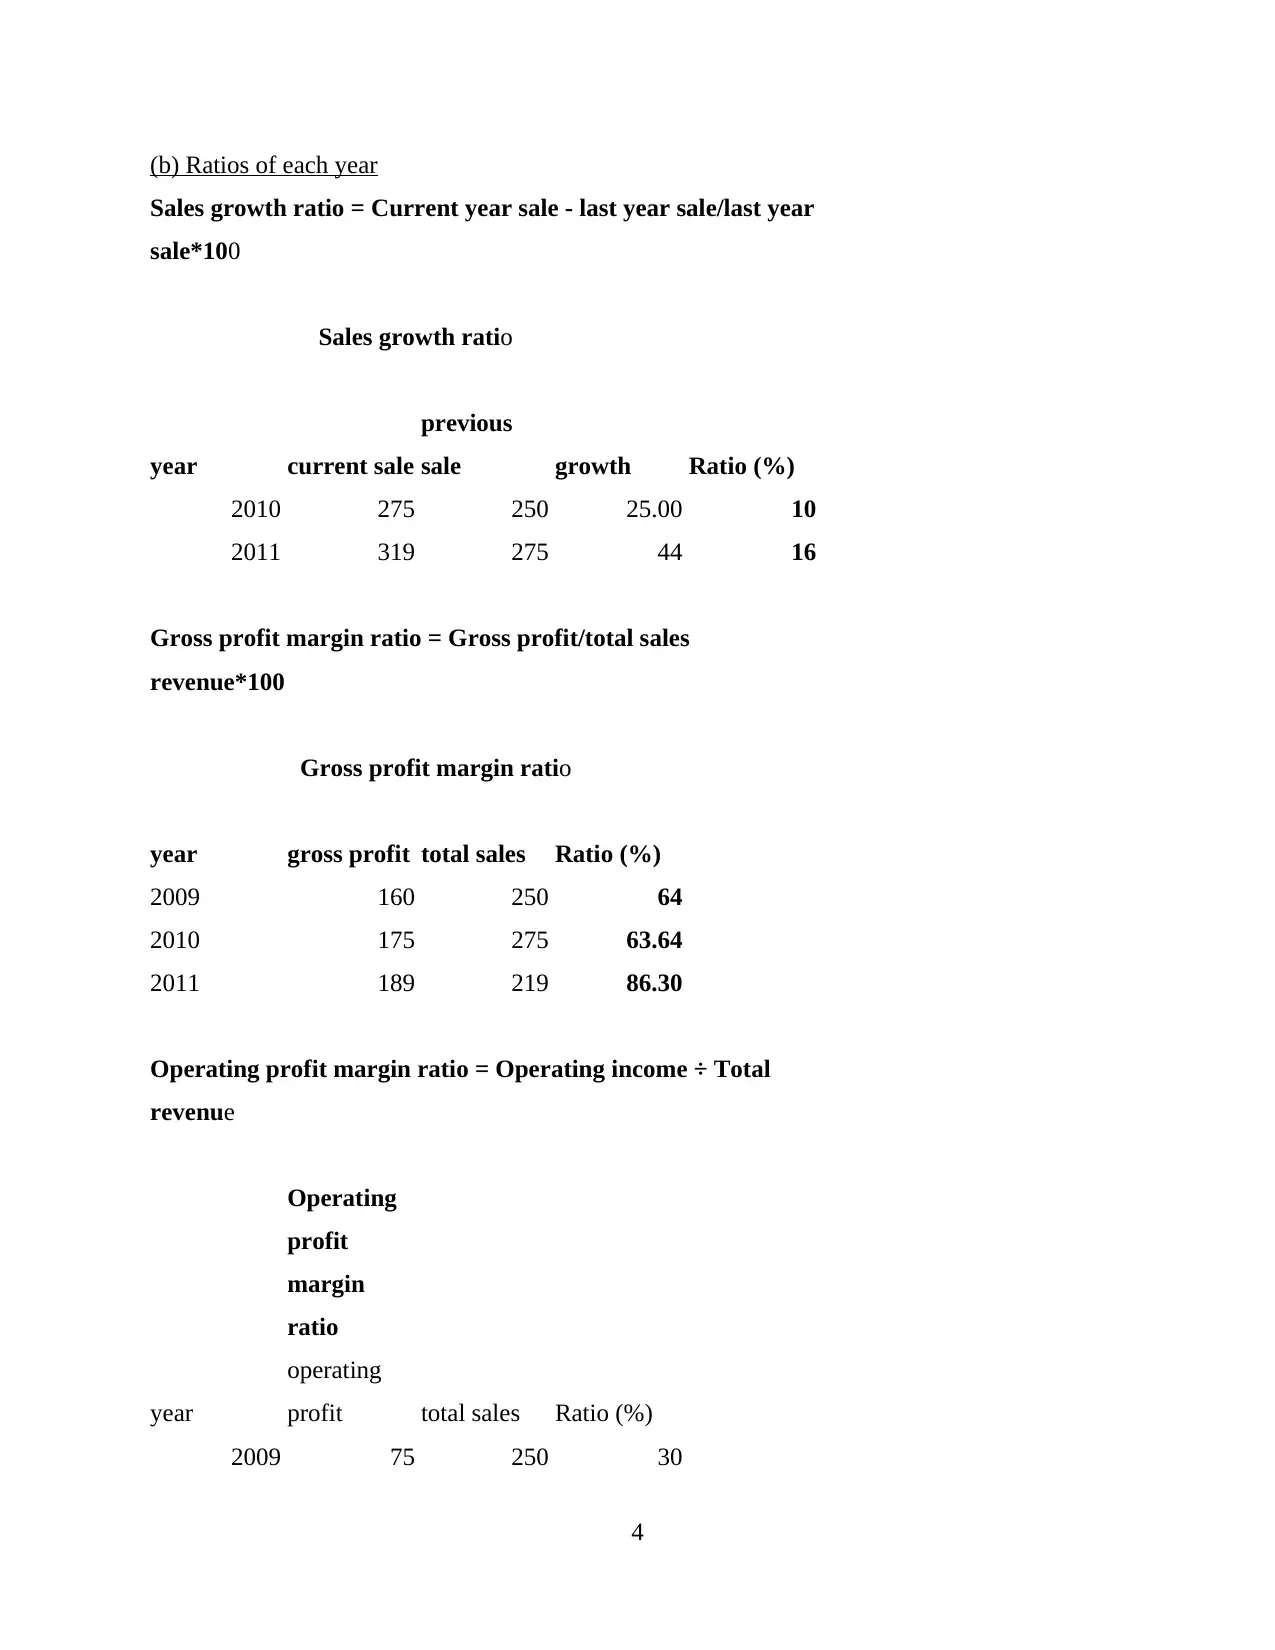
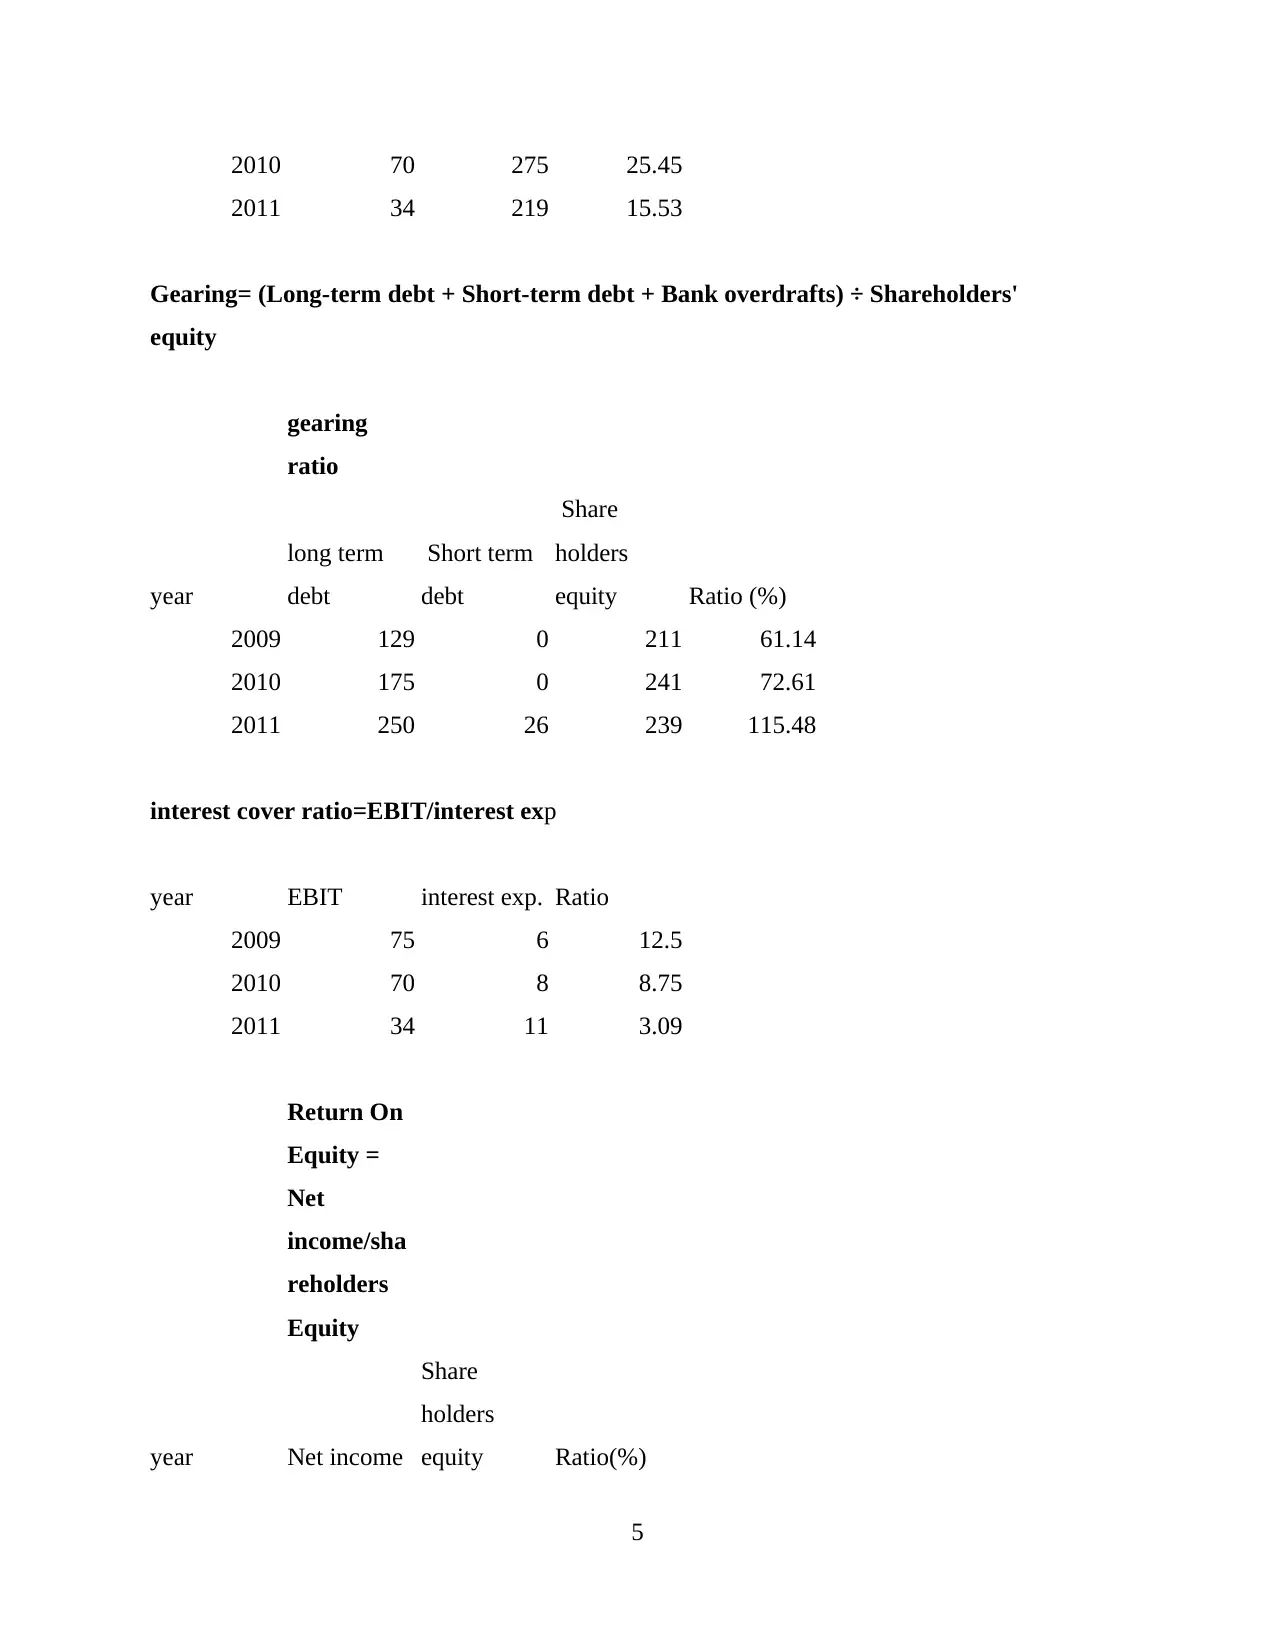
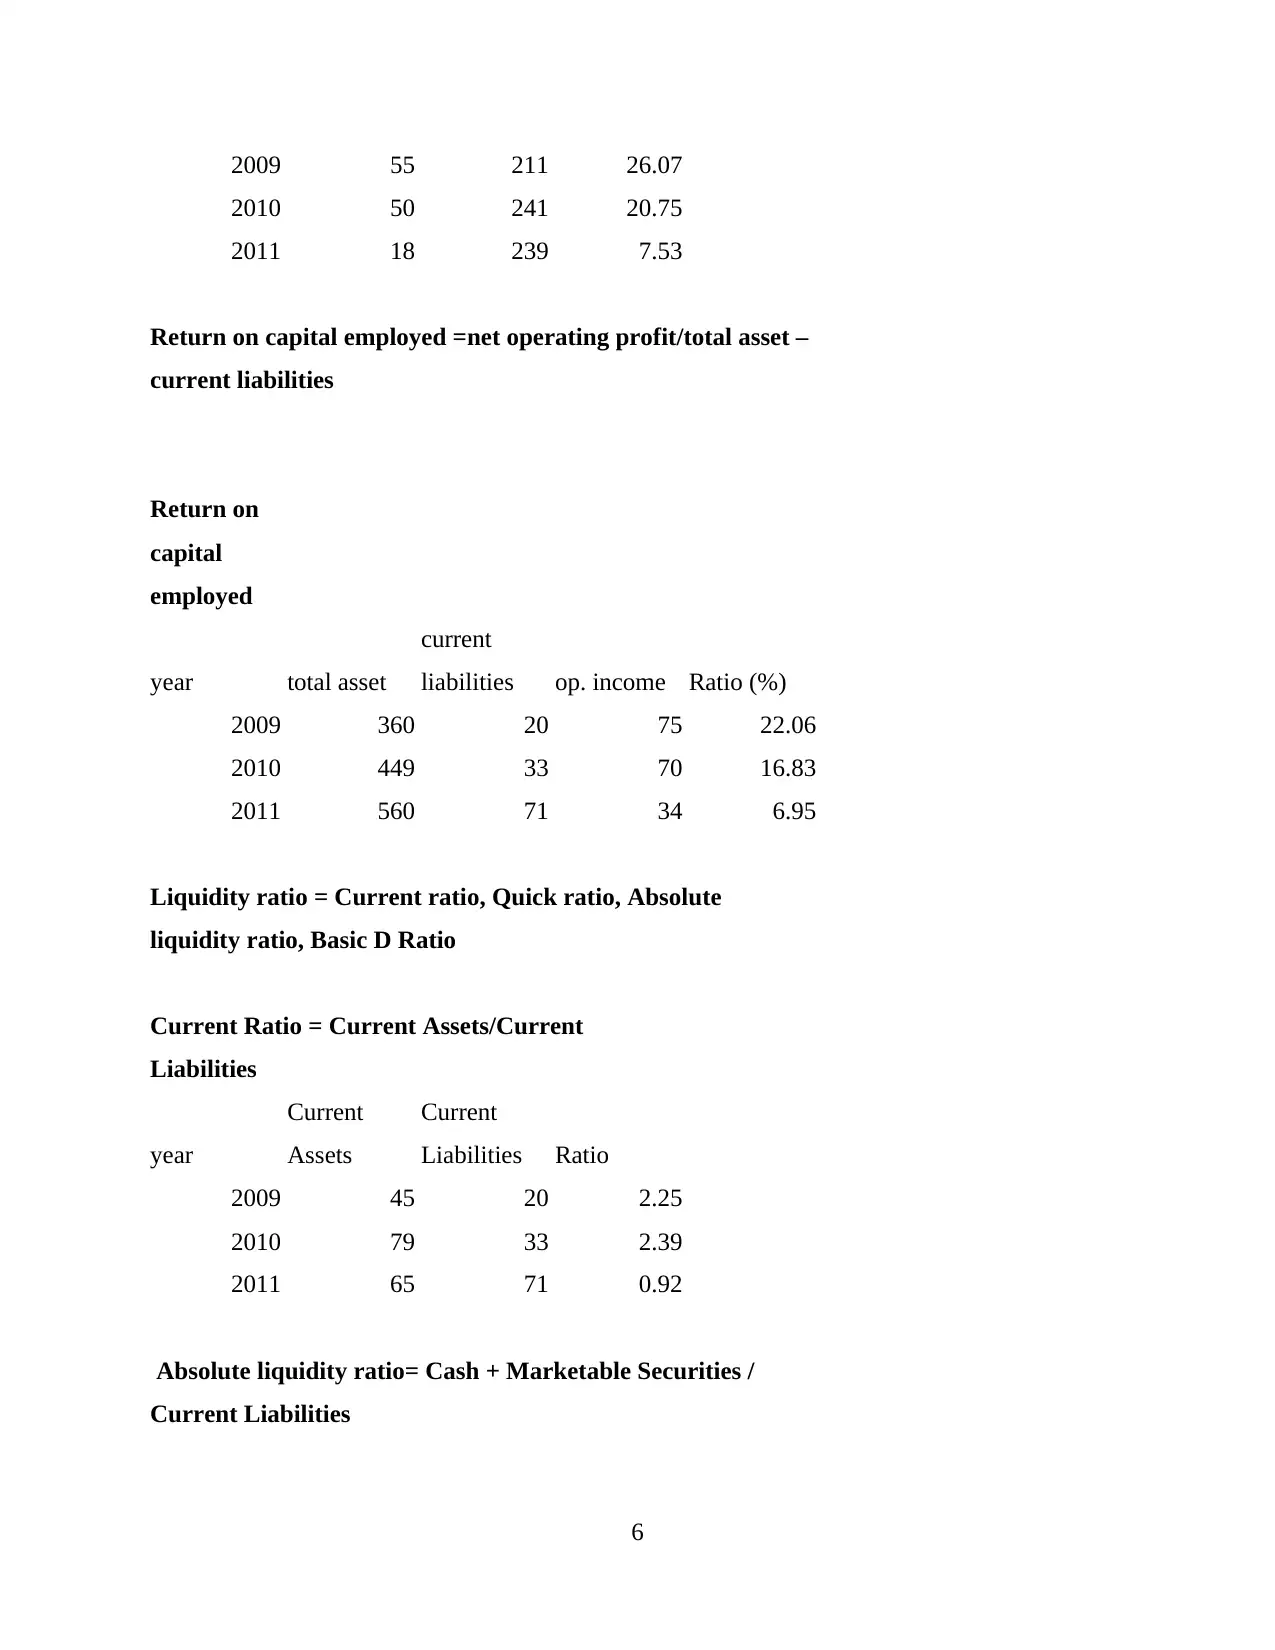
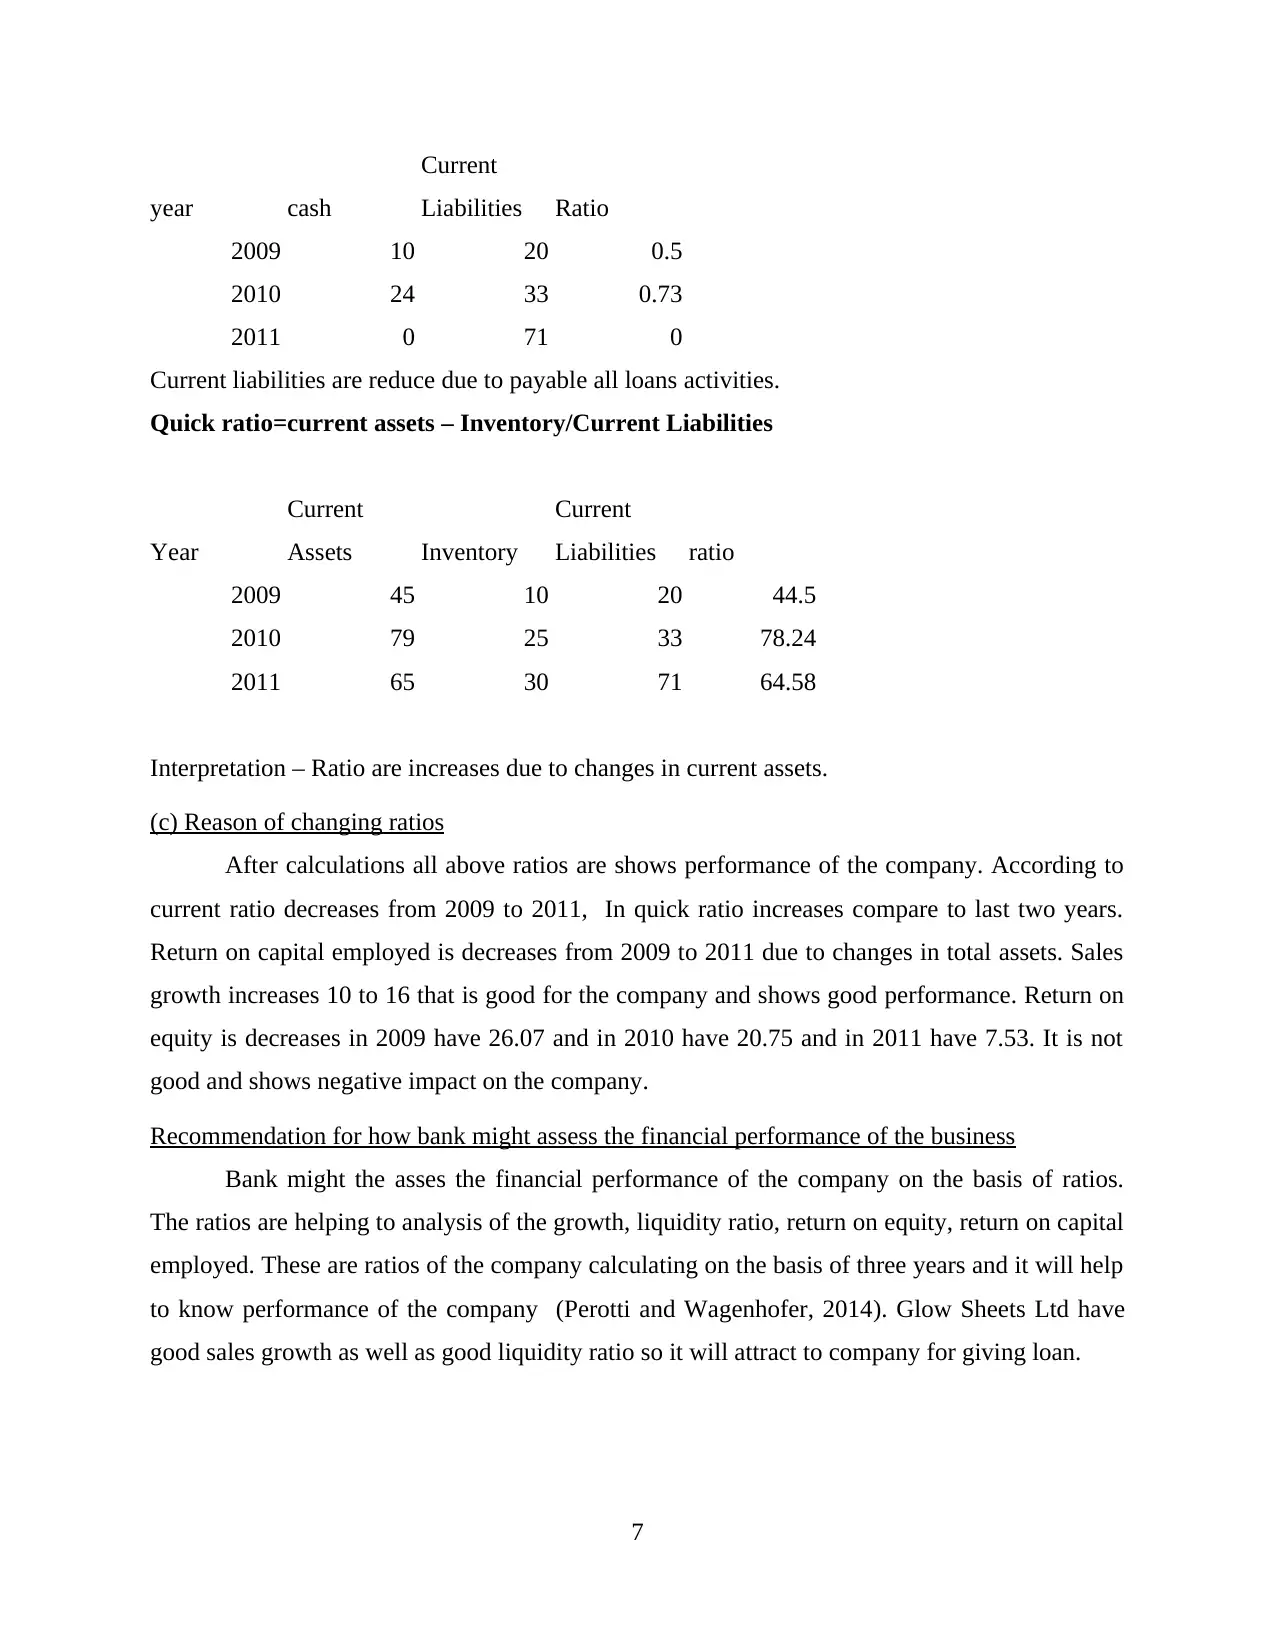
This report provides a financial performance analysis of Glow Sheets Ltd, focusing on key financial ratios from 2009 to 2011. The analysis includes calculations and interpretations of sales growth, gross profit margin, operating profit margin, gearing, interest cover, liquidity ratios (current and quick), return on equity, and return on capital employed. The report identifies the elements of financial performance, such as assets and liabilities, and examines how these ratios changed over the three-year period. The analysis highlights the company's strengths and weaknesses, recommending how a bank might assess the company's financial health based on these ratios. The conclusion summarizes the findings, emphasizing the importance of ratio analysis in understanding the company's financial position and performance. The report references various financial accounting principles and relevant academic sources.

BUSINESS
FINANCE
FINANCE
Secure Best Marks with AI Grader
Need help grading? Try our AI Grader for instant feedback on your assignments.

EXECUTIVE SUMMARY
This report Summarises that Glow sheets Limited present financial performance of the
company. It is shows issues to the bank of the company by calculation financial ratios. There is
calculated ratios of 3 years such as 2009, 2010 and 2011 of the company. For showing ratios
using financial elements that are related to performance. According to scenario sales growth,
gearing, operating profit margin, interest cover, return on equity, liquidity ratio and return on
capital employed are changing according to situation. Analysis of financial performance of the
business and recommended that bank might assess.

Table of Contents
EXECUTIVE SUMMARY.............................................................................................................2
INTRODUCTION...........................................................................................................................2
PART 2............................................................................................................................................2
(a) Elements of financial performance...................................................................................2
(b) Ratios of each year............................................................................................................4
(c) Reason of changing ratios.................................................................................................6
Recommendation for how bank might assess the financial performance of the business......7
CONCLUSION................................................................................................................................7
REFERENCES................................................................................................................................8
1

INTRODUCTION
Business finance is important part of every organisation because it provides funds to
operate business in systematic way (Han, and et. at al 2014). In the context of this report provide
company is Glow sheets Ltd that have a business to producing large scale digital print transfer
which are imposed on trains, buses, buildings etc. it has build up a good customer base in south
west England.
In this report covers elements that are related to financial performance and it is describe
with the help of ratios. It is shows actual performance of the company like as sales growth,
interest cover, gross profit margin, liquidity ratio and return on equity. Ratio analysis of each
year and after that what result comes in the organisation. Identify elements of financial
performance and recommendation on asses the financial performance of the company regarding
to bank.
PART 2
(a) Elements of financial performance
Statements of financial accounting are concepts on the basis of generally accepted
accounting principles ( GAAP ). In financial statements mainly focusing performance of the
company and ascertaining of financial position of the enterprises. The accrual system of
accounting in its elements of the financial statements (Bischof, Daske and Sextroh, 2014). For
understand financial performance of the company presented elements are given below -
Sales Growth
There are two elements are required for this such as sales and gross profit.
Gross profit margin
For calculating this ratio need to two elements that are gross profit and net sales. Both are
helping to calculating this ratio.
Operating profit margin
There are require two elements for calculating it, they are as follows – net sales and
operating profit.
Gearing
For calculation of gearing ratio need to Long-term debt, Short-term debt, Bank overdrafts
and Shareholders' equity
2
Secure Best Marks with AI Grader
Need help grading? Try our AI Grader for instant feedback on your assignments.

Interest cover
There are required of two element for calculating it such as earning before interest and
tax, interest expenses.
Liquidity ratio
These types ratios are divided in two parts first is current ration and second is quick ratio.
For current ratio required element is current assets and current liabilities and for quick ratio need
to quick assets and current liabilities. Quick assets calculated from current assets less inventories
and prepaid expenses.
Return on equity
For calculating of this ratio need to two element that are helping such as net income and
share holders equity.
Return on capital employed
For this need to two elements they are as follows – First one is net operating profit and
total assets. But from total assets less current liabilities.
Assets
It is the property of any company that on legal rights and owned to know actual value of
the assets (Chen, Parsley and Yang, 2015). It is an item related to the economics value expected
to acquire benefit in the future. In the company assets are divided into different parts such as -
Current assets – These are converted into cash with in 12 months. Foe example – cash
receivable, debtors, cash.
Fixed assets – It is not easily converted into cash, they are taking long time to convert. For
example – land and building, machinery
Intangible assets – These types assets are not visible in the company by they own have value
like as patent, goodwill
Tangible assets – It is those assets that have physical appearance in the company. Such as –
furniture, computer .
Liabilities
It is present the responsibility of the enterprises that are arising due to past events. The
settlement which is expected to result in an outflow from the organisations of resources are
related to economic benefits. In different words, liability is the cost that re taken by the
organisation for any project or tasks for particular time (Liabilities, 2018).
3

(b) Ratios of each year
Sales growth ratio = Current year sale - last year sale/last year
sale*100
Sales growth ratio
year current sale
previous
sale growth Ratio (%)
2010 275 250 25.00 10
2011 319 275 44 16
Gross profit margin ratio = Gross profit/total sales
revenue*100
Gross profit margin ratio
year gross profit total sales Ratio (%)
2009 160 250 64
2010 175 275 63.64
2011 189 219 86.30
Operating profit margin ratio = Operating income ÷ Total
revenue
Operating
profit
margin
ratio
year
operating
profit total sales Ratio (%)
2009 75 250 30
4

2010 70 275 25.45
2011 34 219 15.53
Gearing= (Long-term debt + Short-term debt + Bank overdrafts) ÷ Shareholders'
equity
gearing
ratio
year
long term
debt
Short term
debt
Share
holders
equity Ratio (%)
2009 129 0 211 61.14
2010 175 0 241 72.61
2011 250 26 239 115.48
interest cover ratio=EBIT/interest exp
year EBIT interest exp. Ratio
2009 75 6 12.5
2010 70 8 8.75
2011 34 11 3.09
Return On
Equity =
Net
income/sha
reholders
Equity
year Net income
Share
holders
equity Ratio(%)
5
Paraphrase This Document
Need a fresh take? Get an instant paraphrase of this document with our AI Paraphraser

2009 55 211 26.07
2010 50 241 20.75
2011 18 239 7.53
Return on capital employed =net operating profit/total asset –
current liabilities
Return on
capital
employed
year total asset
current
liabilities op. income Ratio (%)
2009 360 20 75 22.06
2010 449 33 70 16.83
2011 560 71 34 6.95
Liquidity ratio = Current ratio, Quick ratio, Absolute
liquidity ratio, Basic D Ratio
Current Ratio = Current Assets/Current
Liabilities
year
Current
Assets
Current
Liabilities Ratio
2009 45 20 2.25
2010 79 33 2.39
2011 65 71 0.92
Absolute liquidity ratio= Cash + Marketable Securities /
Current Liabilities
6

year cash
Current
Liabilities Ratio
2009 10 20 0.5
2010 24 33 0.73
2011 0 71 0
Current liabilities are reduce due to payable all loans activities.
Quick ratio=current assets – Inventory/Current Liabilities
Year
Current
Assets Inventory
Current
Liabilities ratio
2009 45 10 20 44.5
2010 79 25 33 78.24
2011 65 30 71 64.58
Interpretation – Ratio are increases due to changes in current assets.
(c) Reason of changing ratios
After calculations all above ratios are shows performance of the company. According to
current ratio decreases from 2009 to 2011, In quick ratio increases compare to last two years.
Return on capital employed is decreases from 2009 to 2011 due to changes in total assets. Sales
growth increases 10 to 16 that is good for the company and shows good performance. Return on
equity is decreases in 2009 have 26.07 and in 2010 have 20.75 and in 2011 have 7.53. It is not
good and shows negative impact on the company.
Recommendation for how bank might assess the financial performance of the business
Bank might the asses the financial performance of the company on the basis of ratios.
The ratios are helping to analysis of the growth, liquidity ratio, return on equity, return on capital
employed. These are ratios of the company calculating on the basis of three years and it will help
to know performance of the company (Perotti and Wagenhofer, 2014). Glow Sheets Ltd have
good sales growth as well as good liquidity ratio so it will attract to company for giving loan.
7
Current
Liabilities Ratio
2009 10 20 0.5
2010 24 33 0.73
2011 0 71 0
Current liabilities are reduce due to payable all loans activities.
Quick ratio=current assets – Inventory/Current Liabilities
Year
Current
Assets Inventory
Current
Liabilities ratio
2009 45 10 20 44.5
2010 79 25 33 78.24
2011 65 30 71 64.58
Interpretation – Ratio are increases due to changes in current assets.
(c) Reason of changing ratios
After calculations all above ratios are shows performance of the company. According to
current ratio decreases from 2009 to 2011, In quick ratio increases compare to last two years.
Return on capital employed is decreases from 2009 to 2011 due to changes in total assets. Sales
growth increases 10 to 16 that is good for the company and shows good performance. Return on
equity is decreases in 2009 have 26.07 and in 2010 have 20.75 and in 2011 have 7.53. It is not
good and shows negative impact on the company.
Recommendation for how bank might assess the financial performance of the business
Bank might the asses the financial performance of the company on the basis of ratios.
The ratios are helping to analysis of the growth, liquidity ratio, return on equity, return on capital
employed. These are ratios of the company calculating on the basis of three years and it will help
to know performance of the company (Perotti and Wagenhofer, 2014). Glow Sheets Ltd have
good sales growth as well as good liquidity ratio so it will attract to company for giving loan.
7

CONCLUSION
From the above report it is concluded that calculating all the ratios to show the
performance of the company. After calculations all results are coming in positive way so it will
shows good position of the company. In the report describe financial elements that are helping to
know ratios of the company as well as financial performance.
8
1 out of 10
Related Documents

Your All-in-One AI-Powered Toolkit for Academic Success.
+13062052269
info@desklib.com
Available 24*7 on WhatsApp / Email
Unlock your academic potential
© 2024 | Zucol Services PVT LTD | All rights reserved.