Financial Analysis of Companies Using Various Ratios

Verified

Added on  2020/07/22

|22
|4906
|242
Report
AI Summary
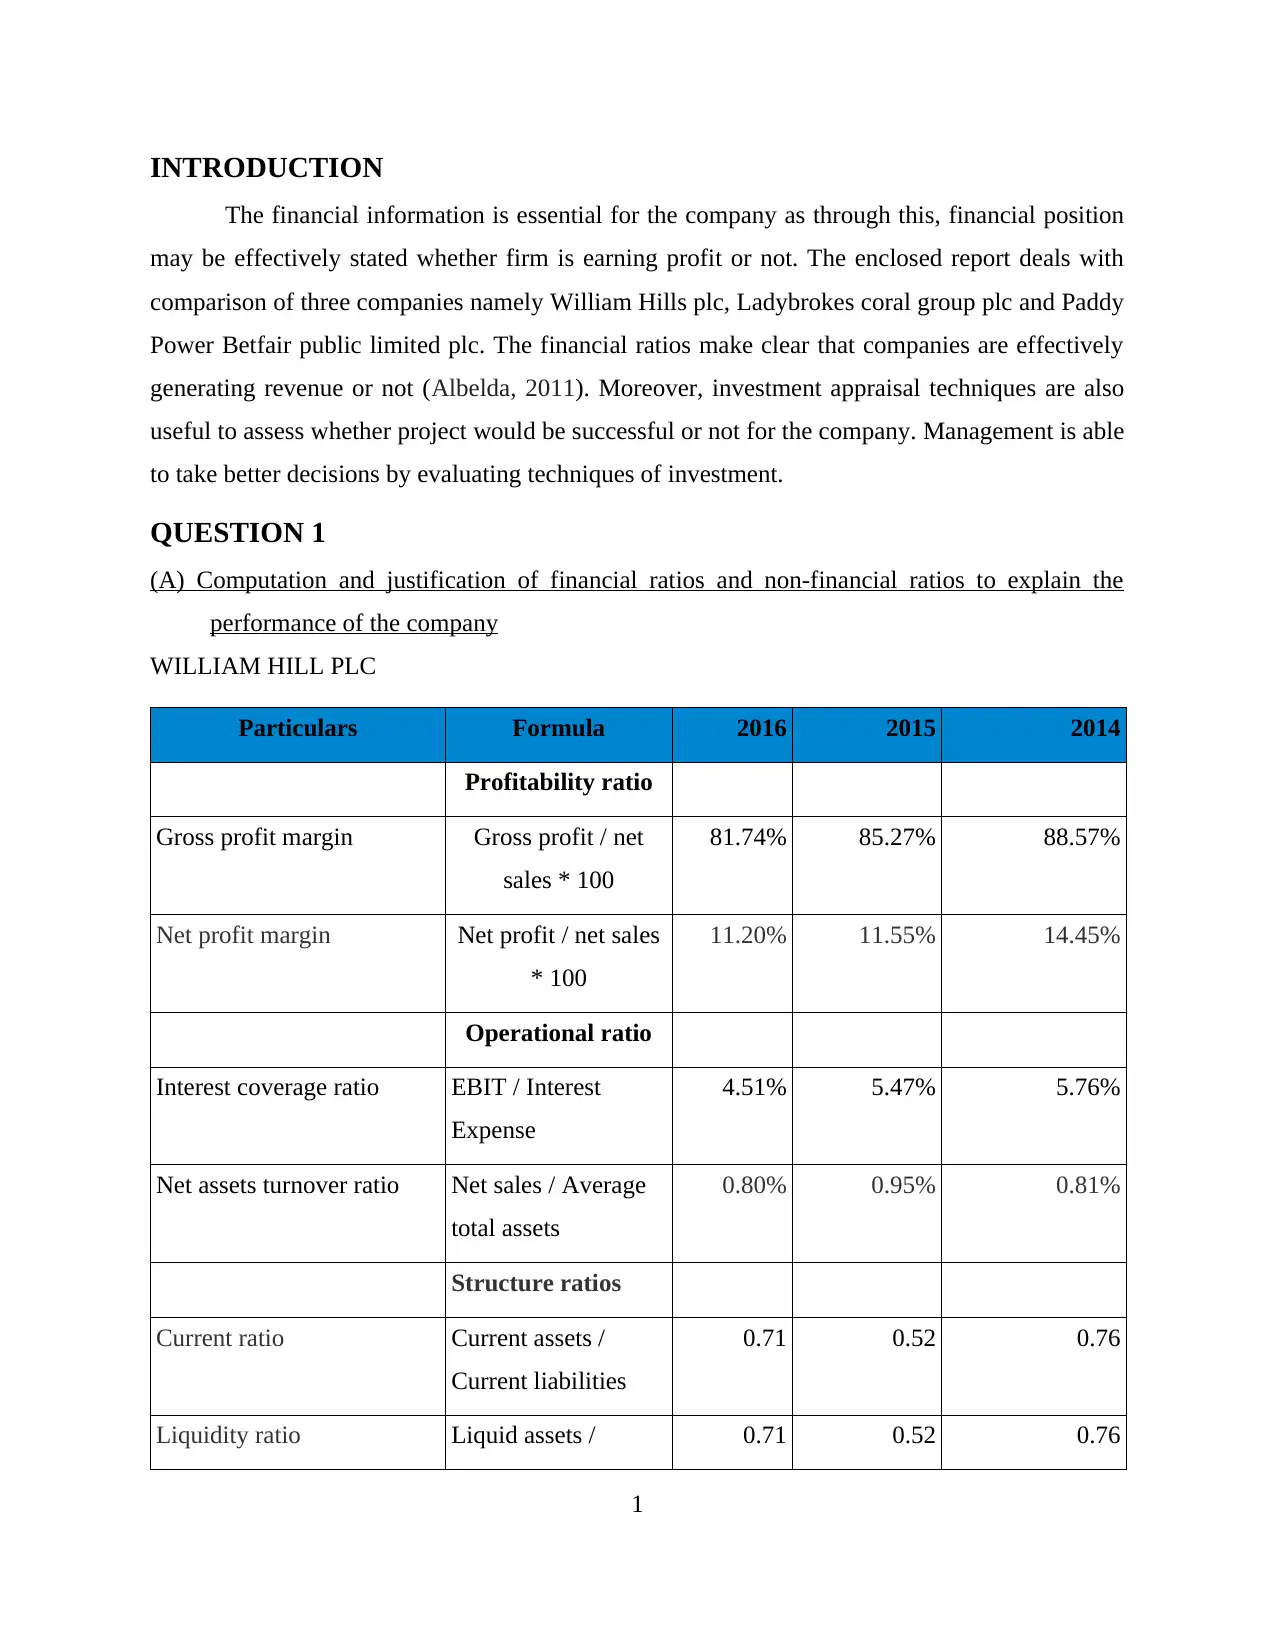
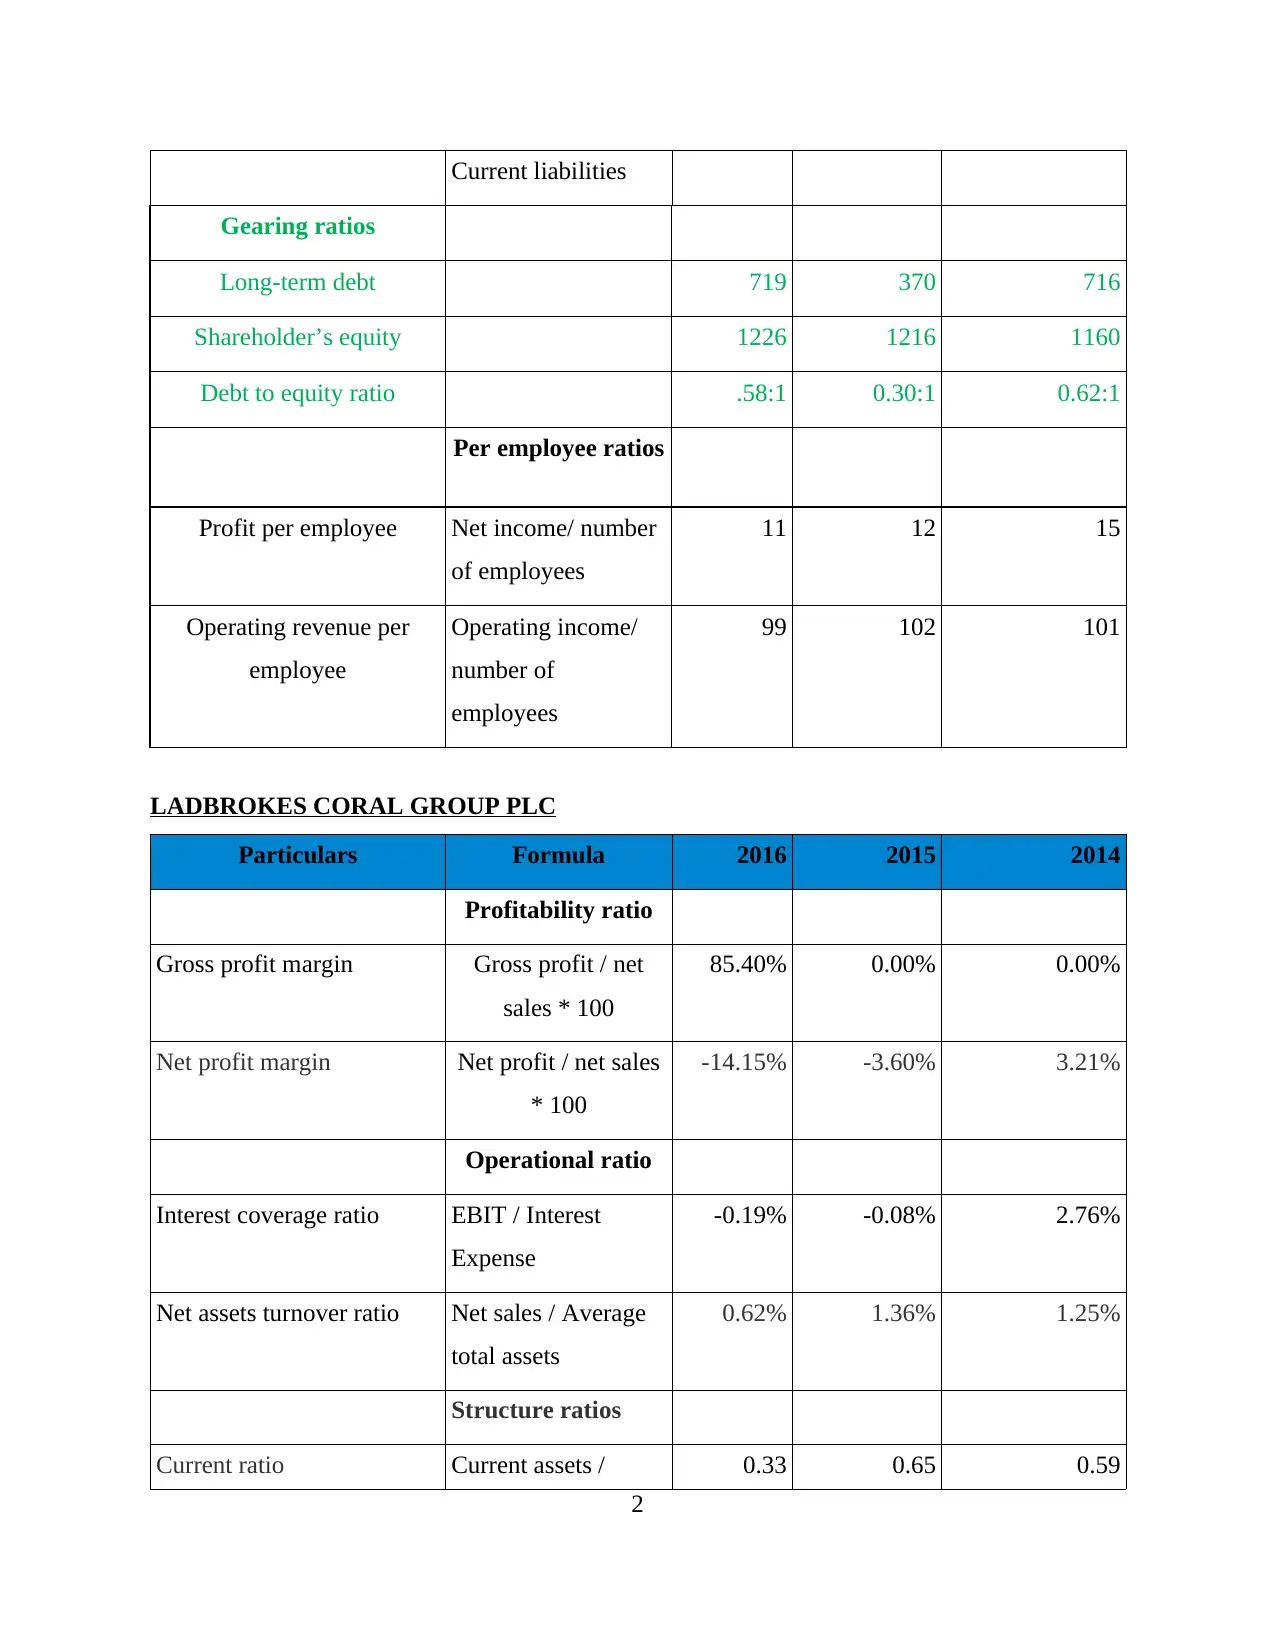
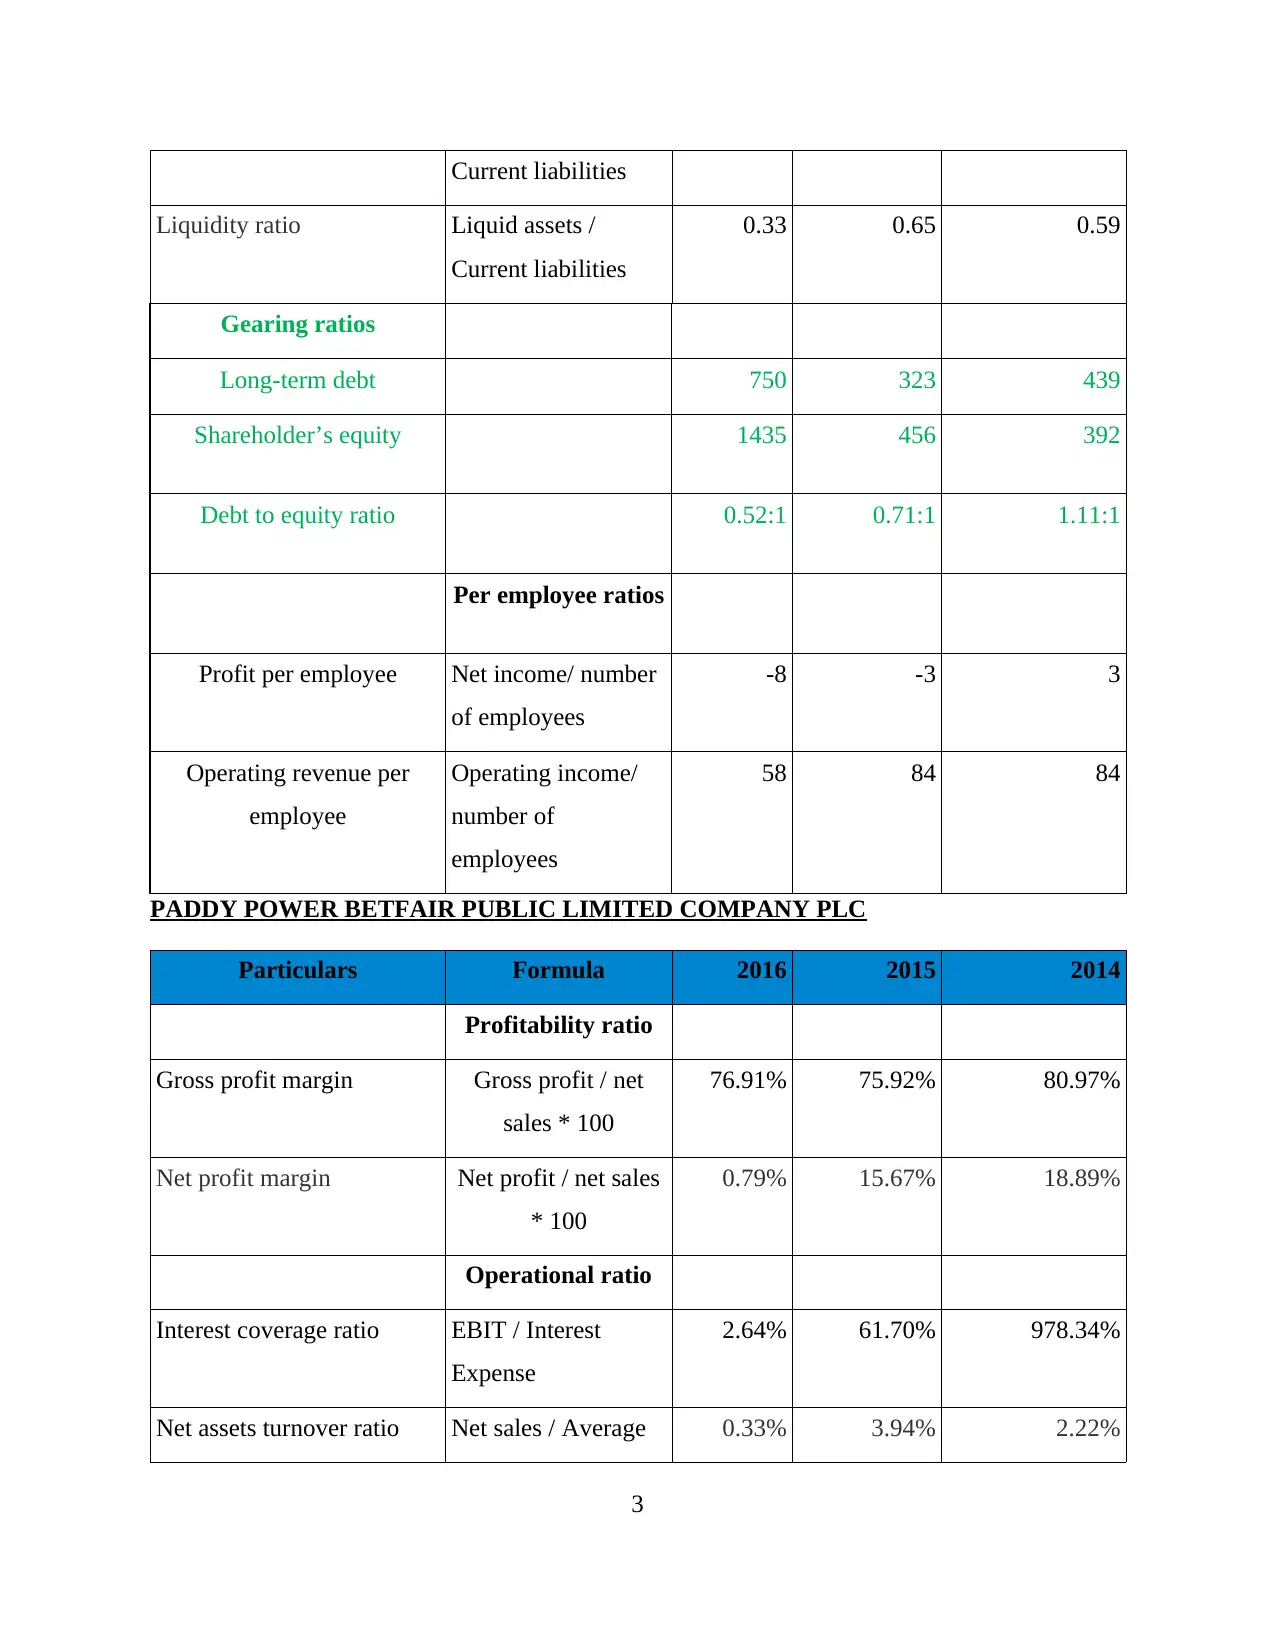
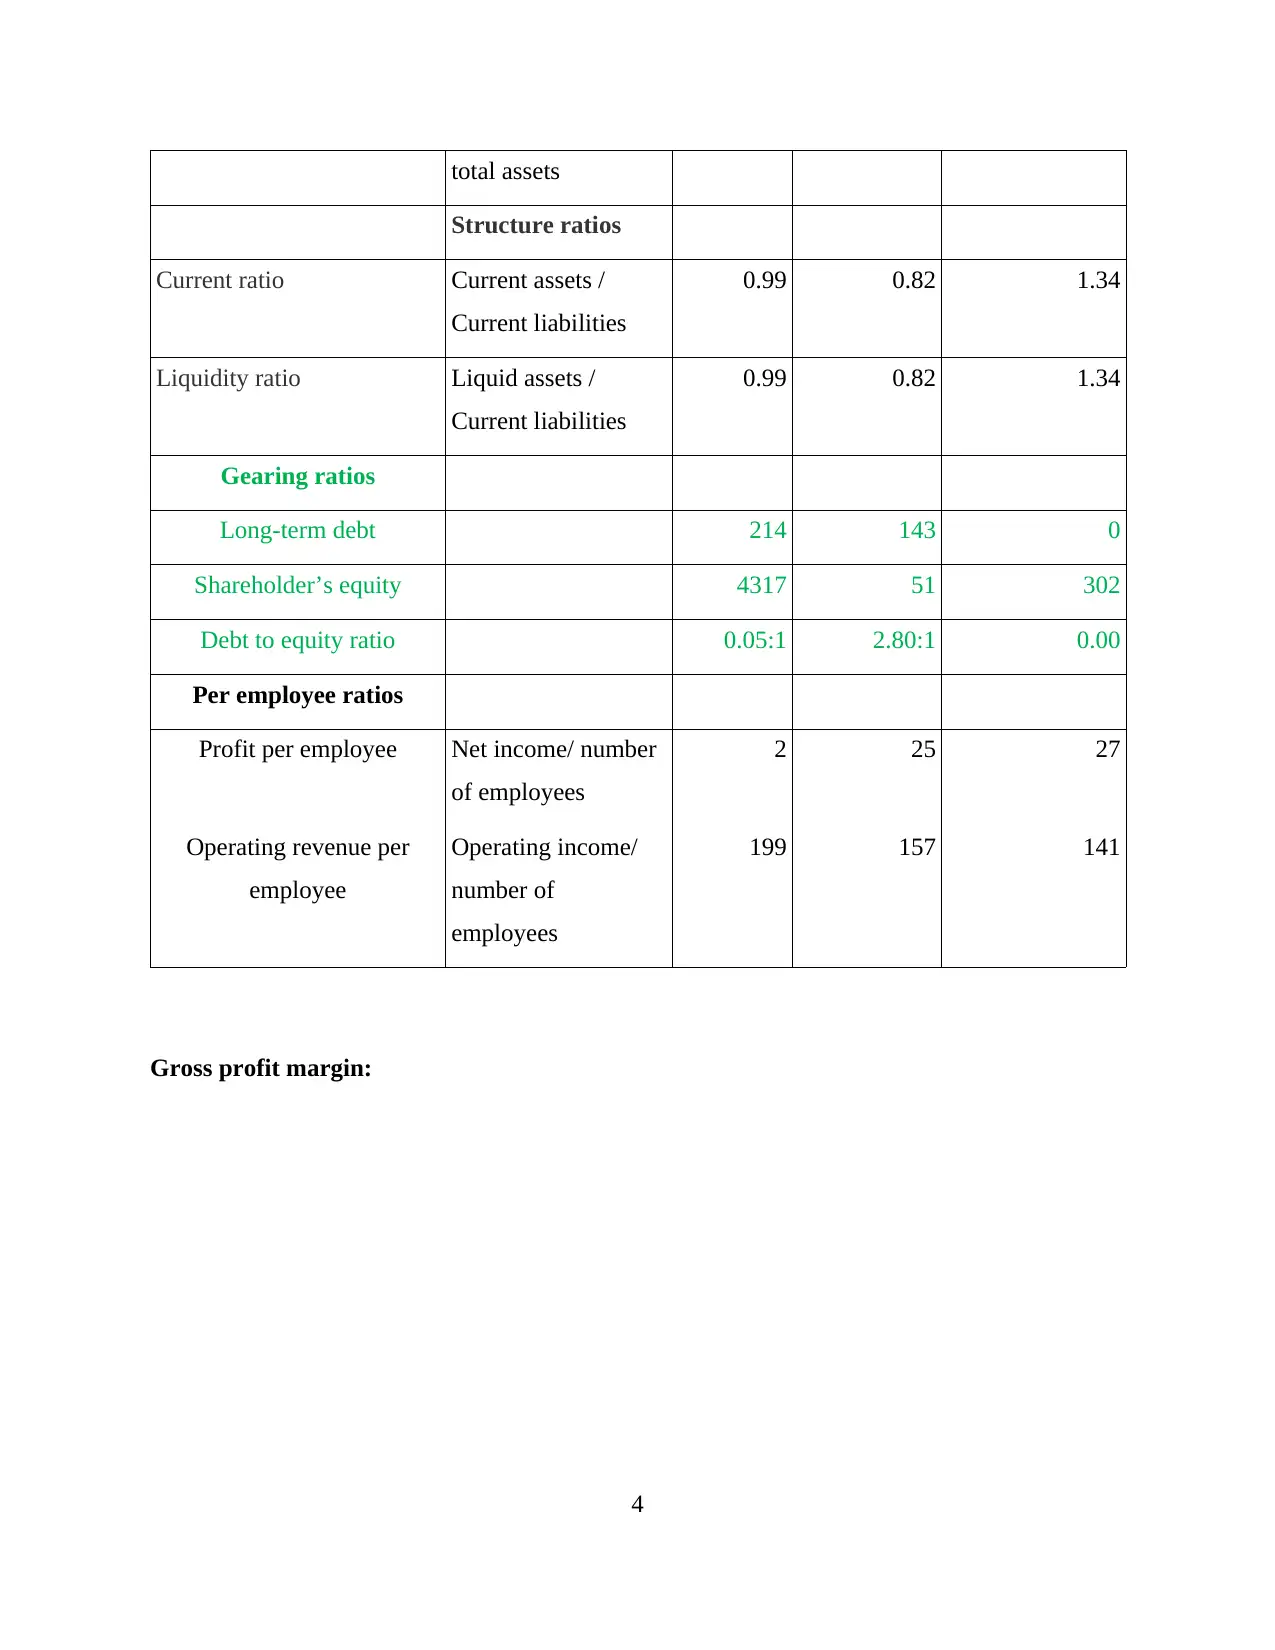
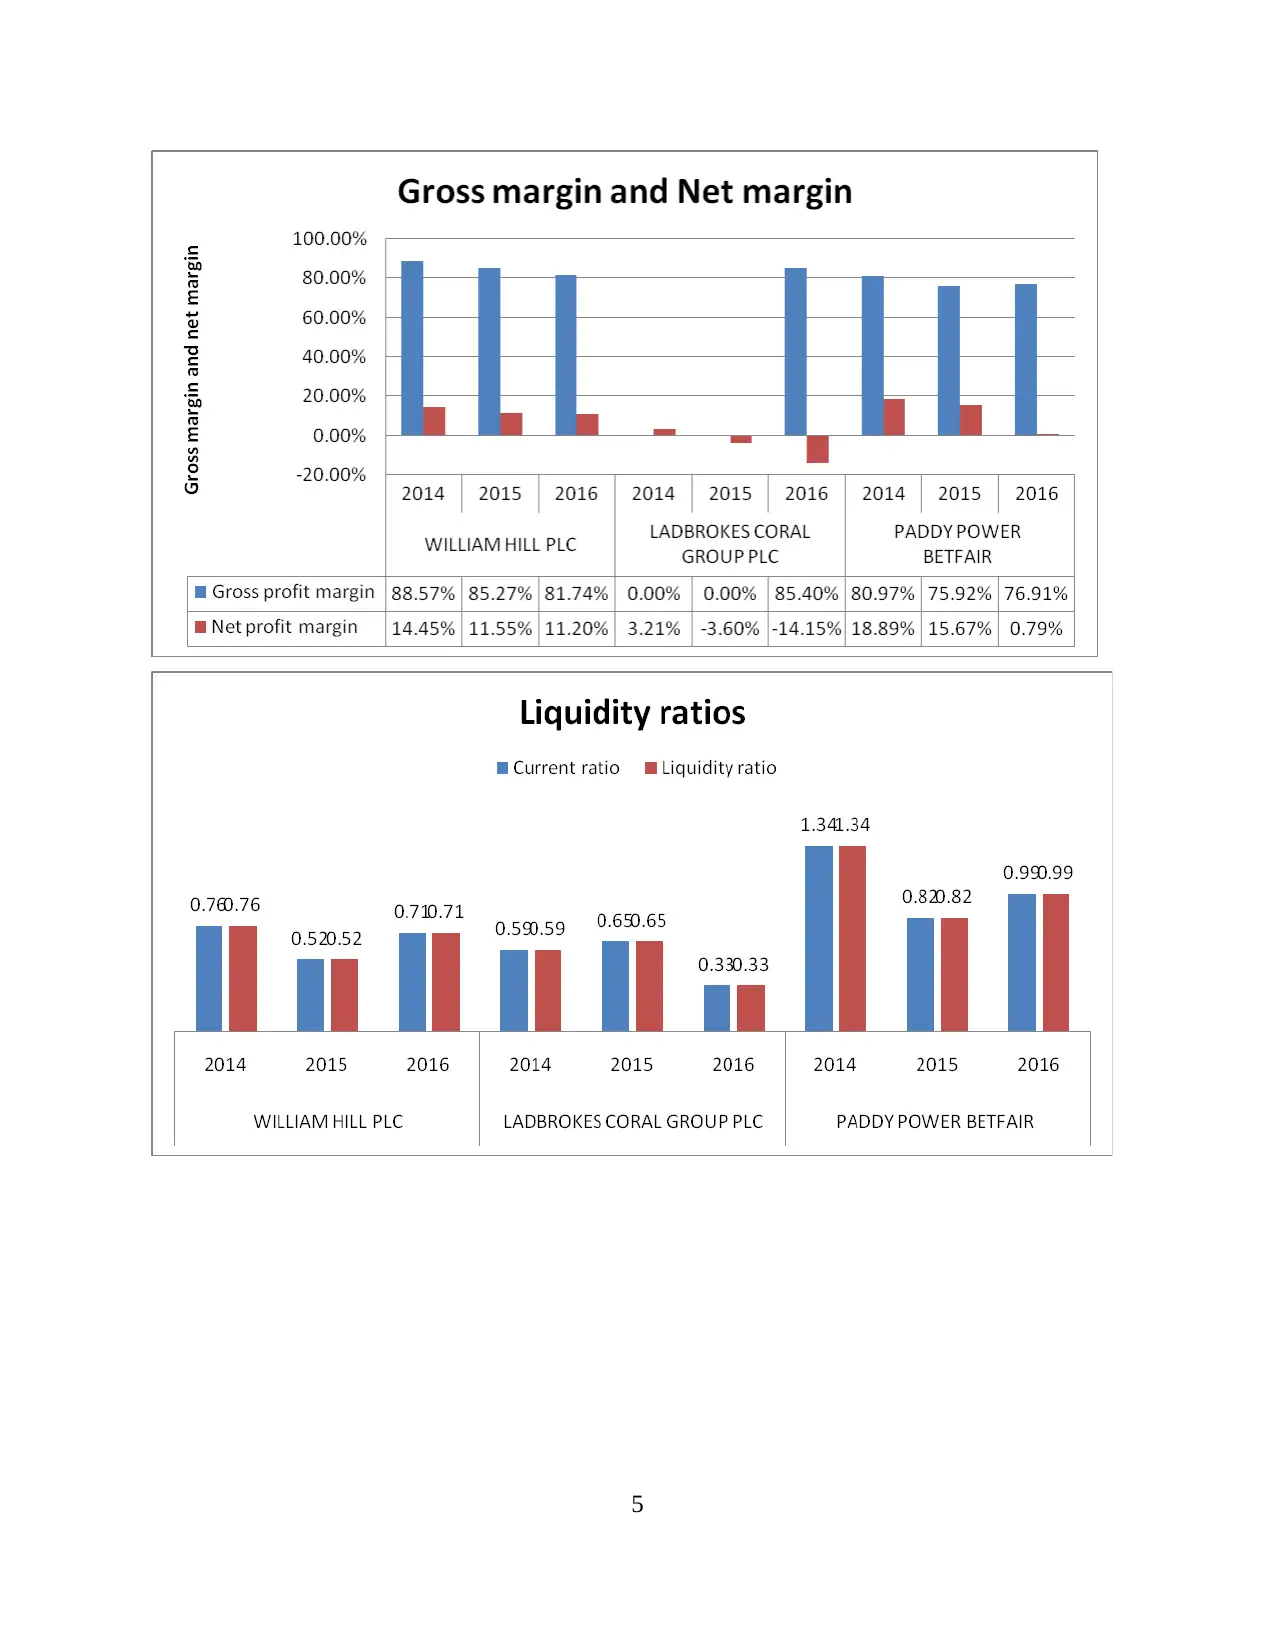
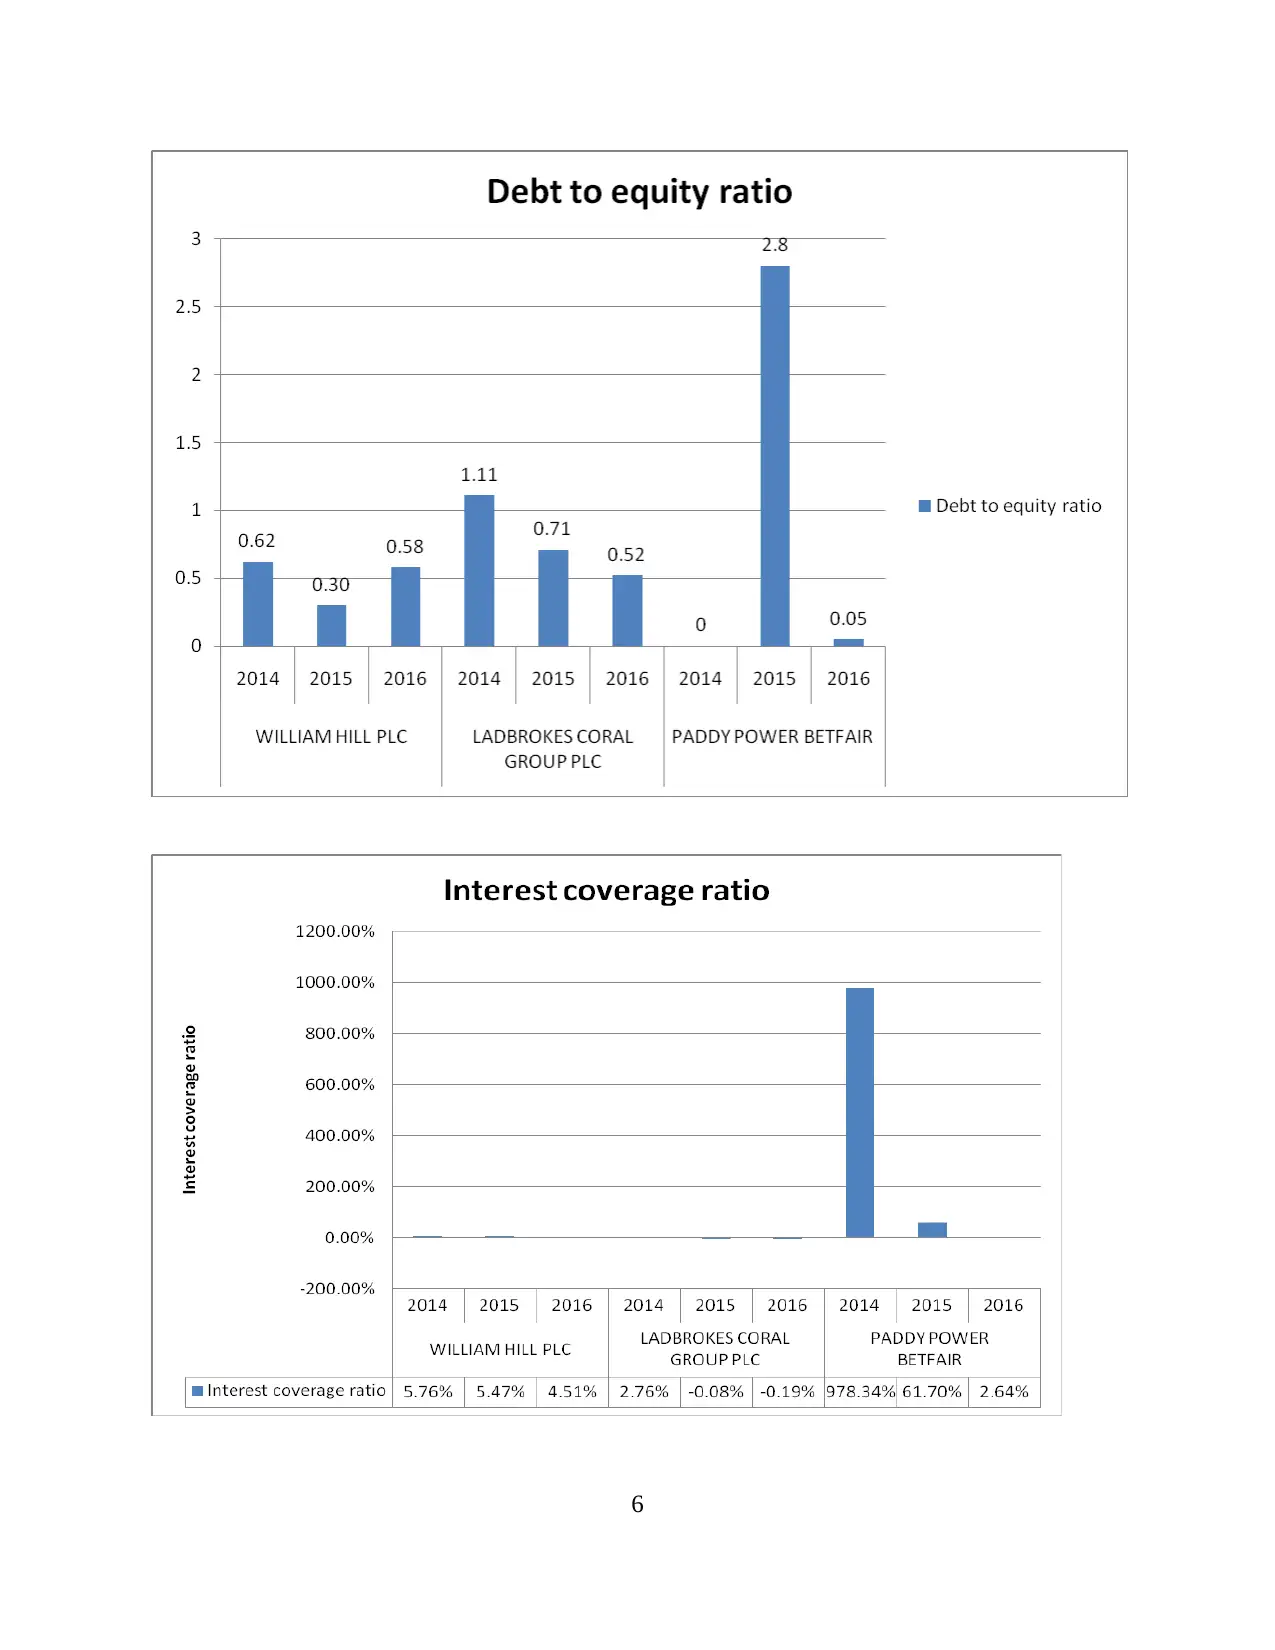
This report undertakes a comprehensive financial analysis of three companies: William Hill plc, Ladbrokes Coral Group plc, and Paddy Power Betfair public limited plc. It begins with an executive summary highlighting the importance of financial ratios and investment techniques for managerial decision-making. The report computes and justifies various financial ratios (profitability, operational, structure, and gearing ratios) to explain each company's performance over three years. The analysis reveals the strengths and weaknesses of each company, with William Hill plc emerging as the best-performing entity due to its strong profitability and solvency ratios. The report also analyzes the investment appraisal process, discussing its stages and methods, including numerical examples. Non-financial ratios, such as staff turnover and customer loyalty, are also considered to provide a holistic view of the companies' performance. The report concludes with a ranking of the companies based on their financial and non-financial performance and provides recommendations for improvement. The analysis emphasizes the importance of efficient resource utilization, cost control, and customer satisfaction for achieving financial success.
Document Page
Accounting and Finance for
Managers
tabler-icon-diamond-filled.svg

Paraphrase This Document

Need a fresh take? Get an instant paraphrase of this document with our AI Paraphraser
Document Page
EXECUTIVE SUMMARY
Management is able to take better decisions by assessing financial ratios. It provides
effective result to it whether revenue is generated by it or not. Moreover, investment techniques
also guide managers to assess viability of the project in effectual manner.
Document Page
TABLE OF CONTENTS
INTRODUCTION...........................................................................................................................1
QUESTION 1...................................................................................................................................1
(A) Computation and justification of financial ratios and non-financial ratios to explain the
performance of the company..................................................................................................1
(B) Analyse best performing company and evaluate reasons why this company would be a
positive investment opportunity.............................................................................................8
(C) Analyse poorly performing company and give recommendations to improve financial
performance............................................................................................................................9
QUESTION 2.................................................................................................................................10
(A) Discuss stages in the capital investment decision-making process and role of investment
appraisal process ..................................................................................................................10
(B) Discuss main methods of investment appraisal with suitable numerical example........12
CONCLUSION..............................................................................................................................13
REFERENCES..............................................................................................................................15
Document Page
INTRODUCTION
The financial information is essential for the company as through this, financial position
may be effectively stated whether firm is earning profit or not. The enclosed report deals with
comparison of three companies namely William Hills plc, Ladybrokes coral group plc and Paddy
Power Betfair public limited plc. The financial ratios make clear that companies are effectively
generating revenue or not (Albelda, 2011). Moreover, investment appraisal techniques are also
useful to assess whether project would be successful or not for the company. Management is able
to take better decisions by evaluating techniques of investment.
QUESTION 1
(A) Computation and justification of financial ratios and non-financial ratios to explain the
performance of the company
WILLIAM HILL PLC
Particulars Formula 2016 2015 2014
Profitability ratio
Gross profit margin Gross profit / net
sales * 100
81.74% 85.27% 88.57%
Net profit margin Net profit / net sales
* 100
11.20% 11.55% 14.45%
Operational ratio
Interest coverage ratio EBIT / Interest
Expense
4.51% 5.47% 5.76%
Net assets turnover ratio Net sales / Average
total assets
0.80% 0.95% 0.81%
Structure ratios
Current ratio Current assets /
Current liabilities
0.71 0.52 0.76
Liquidity ratio Liquid assets / 0.71 0.52 0.76
1
tabler-icon-diamond-filled.svg

Paraphrase This Document

Need a fresh take? Get an instant paraphrase of this document with our AI Paraphraser
Document Page
Current liabilities
Gearing ratios
Long-term debt 719 370 716
Shareholder’s equity 1226 1216 1160
Debt to equity ratio .58:1 0.30:1 0.62:1
Per employee ratios
Profit per employee Net income/ number
of employees
11 12 15
Operating revenue per
employee
Operating income/
number of
employees
99 102 101
LADBROKES CORAL GROUP PLC
Particulars Formula 2016 2015 2014
Profitability ratio
Gross profit margin Gross profit / net
sales * 100
85.40% 0.00% 0.00%
Net profit margin Net profit / net sales
* 100
-14.15% -3.60% 3.21%
Operational ratio
Interest coverage ratio EBIT / Interest
Expense
-0.19% -0.08% 2.76%
Net assets turnover ratio Net sales / Average
total assets
0.62% 1.36% 1.25%
Structure ratios
Current ratio Current assets / 0.33 0.65 0.59
2
Document Page
Current liabilities
Liquidity ratio Liquid assets /
Current liabilities
0.33 0.65 0.59
Gearing ratios
Long-term debt 750 323 439
Shareholder’s equity 1435 456 392
Debt to equity ratio 0.52:1 0.71:1 1.11:1
Per employee ratios
Profit per employee Net income/ number
of employees
-8 -3 3
Operating revenue per
employee
Operating income/
number of
employees
58 84 84
PADDY POWER BETFAIR PUBLIC LIMITED COMPANY PLC
Particulars Formula 2016 2015 2014
Profitability ratio
Gross profit margin Gross profit / net
sales * 100
76.91% 75.92% 80.97%
Net profit margin Net profit / net sales
* 100
0.79% 15.67% 18.89%
Operational ratio
Interest coverage ratio EBIT / Interest
Expense
2.64% 61.70% 978.34%
Net assets turnover ratio Net sales / Average 0.33% 3.94% 2.22%
3
Document Page
total assets
Structure ratios
Current ratio Current assets /
Current liabilities
0.99 0.82 1.34
Liquidity ratio Liquid assets /
Current liabilities
0.99 0.82 1.34
Gearing ratios
Long-term debt 214 143 0
Shareholder’s equity 4317 51 302
Debt to equity ratio 0.05:1 2.80:1 0.00
Per employee ratios
Profit per employee Net income/ number
of employees
2 25 27
Operating revenue per
employee
Operating income/
number of
employees
199 157 141
Gross profit margin:
4
tabler-icon-diamond-filled.svg

Paraphrase This Document

Need a fresh take? Get an instant paraphrase of this document with our AI Paraphraser
Document Page
5
Document Page
6
Document Page
Profit per employee
Operating revenue per employee
7
tabler-icon-diamond-filled.svg

Paraphrase This Document

Need a fresh take? Get an instant paraphrase of this document with our AI Paraphraser
Document Page
From the above ratios, it can be interpreted that performance of Paddy Power Betfair
company as current ratio is better than other two companies. The ideal current ratio is 2:1 and
other organisations apart from Paddy Power Betfair is better in three years. The reason behind
this is its Paddy Power Betfair’s CR is 0.99:1 that is closer to the idle and also greather than
Ladbroks and William Hill Plc with CR of 0.33 an 0.71 respectively. It states that Paddy Power
had enough resources available to meet out their short-term business obligations and have sound
working capital management structure and cash management structure so as to retain sufficient
cash resources in the business so that deferral liability to the suppliers can be paid timely.
However, with respect to profitability ratios, it can be seen that in 2016, Ladbrokes Gross
margin is 85.40% above than Paddy Power and William hill with gross margin of 76.91% and
81.74%. It is because of significant increase in their revenue from £1,200m to £1,508m by
25.72% through the delivery of quality services. Despite this, although cost grown up but larger
grown driven in its revenue enable business entity to maximize its gross profit evidenced
stronger performance over other firms.
However, on the other side, excessive sales, general and admin expense, expense on
restructure, merger and acquisition and other operational expenditures incurred by the firm
reported net loss. Ladbrokes plc has lower performance as compared to other companies as net
profit margin is negative which shows that performance is not at all good as expenditures are
more than profits. It has to formulate and implement better strategies so that profit may be
8
Document Page
maximised up too much extent (Burritt, Schaltegger and Zvezdov, 2011). The performance of
William is better with larger net profit margin of 11.20% while Paddy Power and Ladbroks
reported (14.15%) and 0.79% respectively. A robust cost control mechanism employed by
William is the key reason why it had performed better over other companies and achieved a great
success. Moreover, effective use of resource enable firm to drive scale based benefits and
maximize profitability.
The financial ratios are interpreted from the financial statements. But apart from this,
non-financial ratios are also key aspect of organisation as it shows performance of company
which cannot be stated in financial term. Non-financial ratios like staff turnover ratio,
absenteeism ratio are qualitative ratios which are vital for the company. If employees' are not
paid adequate salaries then absenteeism ratio rises up which is not a good sign for organisation as
productivity reduces. Staff turnover ratio is another vital ratio as when employees' constantly
leaves organisation, it adversely impacts as overall productivity reduces which is not good for
the company. As a result, organisation should be able to analyse factors which leads to rise in
employee turnover and then corrective measures be taken to minimise employee turnover ratio.
Customer Loyalty is another qualitative factors, William Hill Plc had a highly satisfied
customer base who believe its brand loyalty. Innovation, outstanding service quality and strong
quality products enable firm to deliver a great experience to the customers and exceed their
requirements and expectations strongly. Its differentiating offerings and focus on customer
desires help business in shaping their experience and build loyal relationship. Thus, on the basis
of it, it can be said that brand loyalty of William Hill Plc is quite high.
The gearing ratio shows that in 2015, William Hill Plc’s had repaid its long-term debt
while shareholder equity grows up resultant declined debt to equity ratio to 0.30:1 shows lesser
fixed financial burden on the business entity. However, in the following year 2016, it grown up
to 0.58 due to more debt borrowing by the company indicates higher leverage in the business
because of more debt use in capital structure. By contrast, Ladbrokes Coral Group’s debt to
equity ratio was 1.11:1 reflect consistent decline to 0.71:1 and 0.52:1 in FY 2015 and FY 2016.
It is because, in the capital structure, equity contributes a major proportion whereas debt is used
comparatively in a less proportion. It is near to the idle ratio of 0.50:1 shows strong capital
composition of debt & investor’s equity and good solvency status. However, in contrast to this,
Paddy power Plc’s gearing ratio reflects high volatility as in 2013, it did not used any debt
9
chevron_up_icon
1 out of 22
circle_padding
hide_on_mobile
zoom_out_icon
[object Object]