Financial Analysis Report: Evaluating Farsons & Heiniken Performance
VerifiedAdded on 2023/01/10
|32
|3730
|25
Report
AI Summary
This report presents a detailed financial analysis of two companies, Farsons and Heiniken, evaluating their performance and efficiency over a four-year period. The analysis includes vertical analysis, horizontal analysis, and ratio analysis to assess the companies' financial positions. The report examines key financial statements, including income statements and balance sheets, to identify trends and patterns in gross profit, net profit, and other relevant financial metrics. Furthermore, the report evaluates the working capital and cash flow of both companies, providing a comprehensive overview of their financial health and operational effectiveness. The findings are supported by financial data and calculations, offering insights into the companies' strengths, weaknesses, and overall financial strategies. The report aims to provide a thorough understanding of the financial performance of these two companies, enabling informed decision-making and strategic planning.
FINANCIAL ANALYSIS
MANAGEMENT ENTERPRISE
MANAGEMENT ENTERPRISE
Paraphrase This Document
Need a fresh take? Get an instant paraphrase of this document with our AI Paraphraser
TABLE OF CONTENTS
TABLE OF CONTENTS................................................................................................................2
INTRODUTION..............................................................................................................................1
REPORT..........................................................................................................................................1
TASK 1. Complete vertical, horizontal and ratio analysis on performance and efficiency of the
two companies.............................................................................................................................1
Task 2.Evaluation of the Working Capital..................................................................................8
Task 3. Evaluation of the Cash Flow...........................................................................................9
CONCLUSION..............................................................................................................................10
REFERENCES..............................................................................................................................11
APPENDIX....................................................................................................................................12
INTRODUTION
The term financial analysis can be defined as a way of analysing monetary aspect of
business entities for a particular time frame. In order to do an effective financial analysis, various
kinds of financial reports are interpreted such profit or loss statement, financial position
statement and statement of cash flows. Basically, there are different types of techniques of doing
financial analysis which are vertical, horizontal analysis, ratio analysis and many more
(Weintraub and Resnick, 2017). The objective of report to do a detailed financial analysis of
given enterprises. The research is conducted on two companies which are Farsons and Heiniken.
Under the project report four years financial statements are evaluated for assessing the
performance and efficiency of the companies. The Farsons company operates its business and
activities in beverage sector. They produce a wide range of beers and soft drinks. The company
is headquartered in Malta and it was founded in year 1928. The another company, Heiniken is
also involved in process of beer manufacturing and located in Netherlands.
REPORT
TASK 1. Complete vertical, horizontal and ratio analysis on performance and efficiency of the
two companies.
Vertical analysis: This could be described as a type of financial statement analysis tool where
every item is presented as a percentage of base amount in various statements. Vertical analysis is
conducted for assessing the change in other items as against the sales or revenues of the
company. In order to convert elements of different elements to do vertical analysis every item of
the income statement is divided by the sales to identify the percentage of expense as against sales
and it is compared between years to identify change in proportions over the years (Greenaway,
Hine. and Milner, 2018).
Vertical analysis of both the companies is provided below
Heiniken:
Income Statement:
On the basis of produced income statement of Heiniken Plc, it could be found that all the
elements of this statement are based on total value of sales. Their income statement presents that
the value of gross profit was increasing during year of 2015 to 2017. Though, in year 2018, it
decreased and became of 51.29%. It could be analyzed from the analysis that net profit of the
company is fluctuating over the period of 4 years. It had a net profit of 4.67% in year 2015 that
1
⊘ This is a preview!⊘
Do you want full access?
Subscribe today to unlock all pages.
Trusted by 1+ million students worldwide
declined to 3.75 in the year 2016. (Annual Report of Heiniken, 2019). In year 2017 it showed a
jump to 4.46% which was gain reduced to 4.28% in 2018.
Balance sheet:
Heiniken:
Income Statement:
On the basis of produced income statement of Heiniken Plc, this can be find out that all
the elements of this statement are based on total value of sales. Their income statement presents
that the value of gross profit was increasing during year of 2015 to 2017. Though, in year 2018,
it decreased and became of 51.29%. In the aspect of net profit of company, it can be find out that
this is fluctuating in all four years. In year 2015, it was of 4.67% that reduced and became of
3.75% in 2016 (Annual Report of Heiniken, 2019). In next year 2017, it increased and became of
4.46% but in last year 2018, again it reduced till 4.28%.
Balance sheet:
As per the information included in statement of financial position of the firm, it could be
evaluated that fixed assets of the company are showing fluctuating trend over the period. These
fluctuations show that company has active and considerable transactions in the fixed assets
during the year. it shows that company puts efforts for keeping its production processes updated
and new. In 2018, it decreased and became of 78.38%. Their current assets are also increasing by
huge gapes in all four years. In 2015, gaps in current assets were 15.68% that increased between
three years and stated at 21.62% in last year 2018. Their cash proportion which is based on total
assets was high in 2018 of 6.92%. In rest of the years, it was of 2.23% in year 2015, 7.72% in
2016 and 5.95% in year 2017.
Apart from it, above company's shareholder's funds is based over percentage of total
assets. The value of their shareholder's fund was higher in year 2015 that was of 17.90%. In rest
of years, it was of 16.78%, 16.16% and 17.06%. Along with the amount of current liabilities fell
down from 26.44% to 24.90% in the financial years 2016 - 2018. The non current liabilities have
decreased by some gape during accounting year 2015 to 2018 from 59.52% to 58.03%.
Farsons:
Income Statement:
2
Paraphrase This Document
Need a fresh take? Get an instant paraphrase of this document with our AI Paraphraser
The companies' all items of income statement are based over the percentage of total
revenues. Over the GP of this company, it could be stated that it is increasing year by year. For
four years 2015,2016,2017 and 2018 their gross profits is as follows: 37.97%, 38.82%, 38.64%
and 38.95% (Annual Report of Farsons, 2019). In addition, the value of net income is also
increasing in a significant manner. Such as in year 2015, it was of 10.13% which raised and
became of 12.94% in 2016. As well as in next two years it became of 13.64% and 14.74%.
Balance sheet:
All the items of balance sheet are based on the total value of assets. Such as their
shareholder's equity was of 67.11% in year 2015 which fluctuated in next three years. In year
2016, it decreased to 66.87% but in 2017, it raised & increased to 67.21 percent. In previous
year, it decreased by huge gape till 59.88%. In addition, the amount of total liabilities increased
year by year. Starting from 2015, it was of 20.37% that raised continuously and became of
32.79% in 2016, 32.52% in year 2017 and ended with 32.89% in year 2018.
It could be analyzed that non current assets are also fluctuating such as it has increased to
79.14% from 78.52% in 2015. It showed continuous increase to 81.42% and decreased to 77.16
in 2018. Their value of total assets are as: 21.48%, 20.25%, 18.58% and 22.22% for year
2015,2016, 2017 and 2018 respectively.
Horizontal Analysis: It is also known as Trend analysis. It could be described as tool used in
analyzing the financial statement where variation in the value of different elements of financial is
presented for specific period of time. In this kind of analyzing technique, financial statements of
two or more than 2 years are taken to make a proper comparison (Toy and et,al., 2017).
Horizontal analysis of the tow given companies is conducted below.
Heiniken:
Income Statement:
It could be evaluated from the analysis that the variation in total revenues is raised in year
2017 till 5.27% which decreased in next year and became of 2.66% in 2018. In addition, the GP
of this entity also fell by 2.08% in 2018 & in year 2017, there was higher increased in variation
of 6.04%. it could be analyzed that net profits of the firm has decreased from 1.64 percent and
has shown increase from 25.42 percent.
3
Balance sheet:
It could be evaluate from the analysis of the firm that value of shareholder's funds is
increased by 7.91% in year 2018. Though, during year 2016-17, it was of -2.25% and 0.53%. In
respect to non current liabilities of this entity, it can be find out that in year 2017 it increased by
7.24% and in year 2018, it raised by just 1.69%. The current liabilities were increased in year
2016-17 from 22.09% and 0.59% where in 2018, it decreased by -0.08%.
On cash funds of the organization, it is interpreted that in year 2018, it increased by
18.88% but in year 2017, there was decreasing in its value by 19.54%. In 2016, it was raised by
significant margin of 268.33%. Their current assets were raised from 37.59%, by 1.36% &
9.97% in 2016, 2017 & 2018 respectively. On the other hand, value of non current assets raised
by just 0.31% in year 2018. As well as their NCA were decreased in financial year 2016.
Farsons:
Income Statement:
It could be evaluated from the profit or loss statement of the enterprise that it is raised
from 7.95% in year 2016. While in year 2017-18, its increasing value was of 3.53% and 7.59%.
Along with the value of GP also raised from 8.82 percent in 2018, though in 2016, 2017 its
increasing was of 10% and 3.03%. The NP of firm raised as: 37.50%, 9.09% and 16.67%
throughout year 2016, 2017 and 2018.
Balance sheet:
As per the B/s, it could be analysed that shareholder funds decreased from 9% in 2016
and 12.84% in 2017. In 2018, it fell down from 21.14%. NCL of firm have showed increase by
8.16% in 2016, 13.21% in 2017 and 11.67% in 2018. In the aspect of CL, it can be find out that
it increased by 33.33% in year 2018 and it remain unchanged in year 2017. As well as their total
assets decreased by 11.48% in year 2018 and in year 2016 & 2017, it raised by 12.27% and
9.40%. In addition, the fixed assets decreased by 16.11% in year 2018 while in last year, it raised
from 15.50% and 10.26% in year 2016 and 2017. Their current assets also raised from 5.88% in
2018, 3.03% in 2017 and 3.13% for 2016.
Ratio analysis- It could be described as tool used by the experts and analysts in evaluating the
performance and position of the enterprise for making investment decisions. Simple figures
4
⊘ This is a preview!⊘
Do you want full access?
Subscribe today to unlock all pages.
Trusted by 1+ million students worldwide
stated in the statements do not reflect the actual position of the organization as there various
factors that are analyzed using ration analysis. There are various that are used by the organization
for evaluating the performance and efficiency of management such as profitability, liquidity,
efficiency and solvency ratios. In the present case ratio analysis is used for analyzing the
financial position and performance of the organizations.
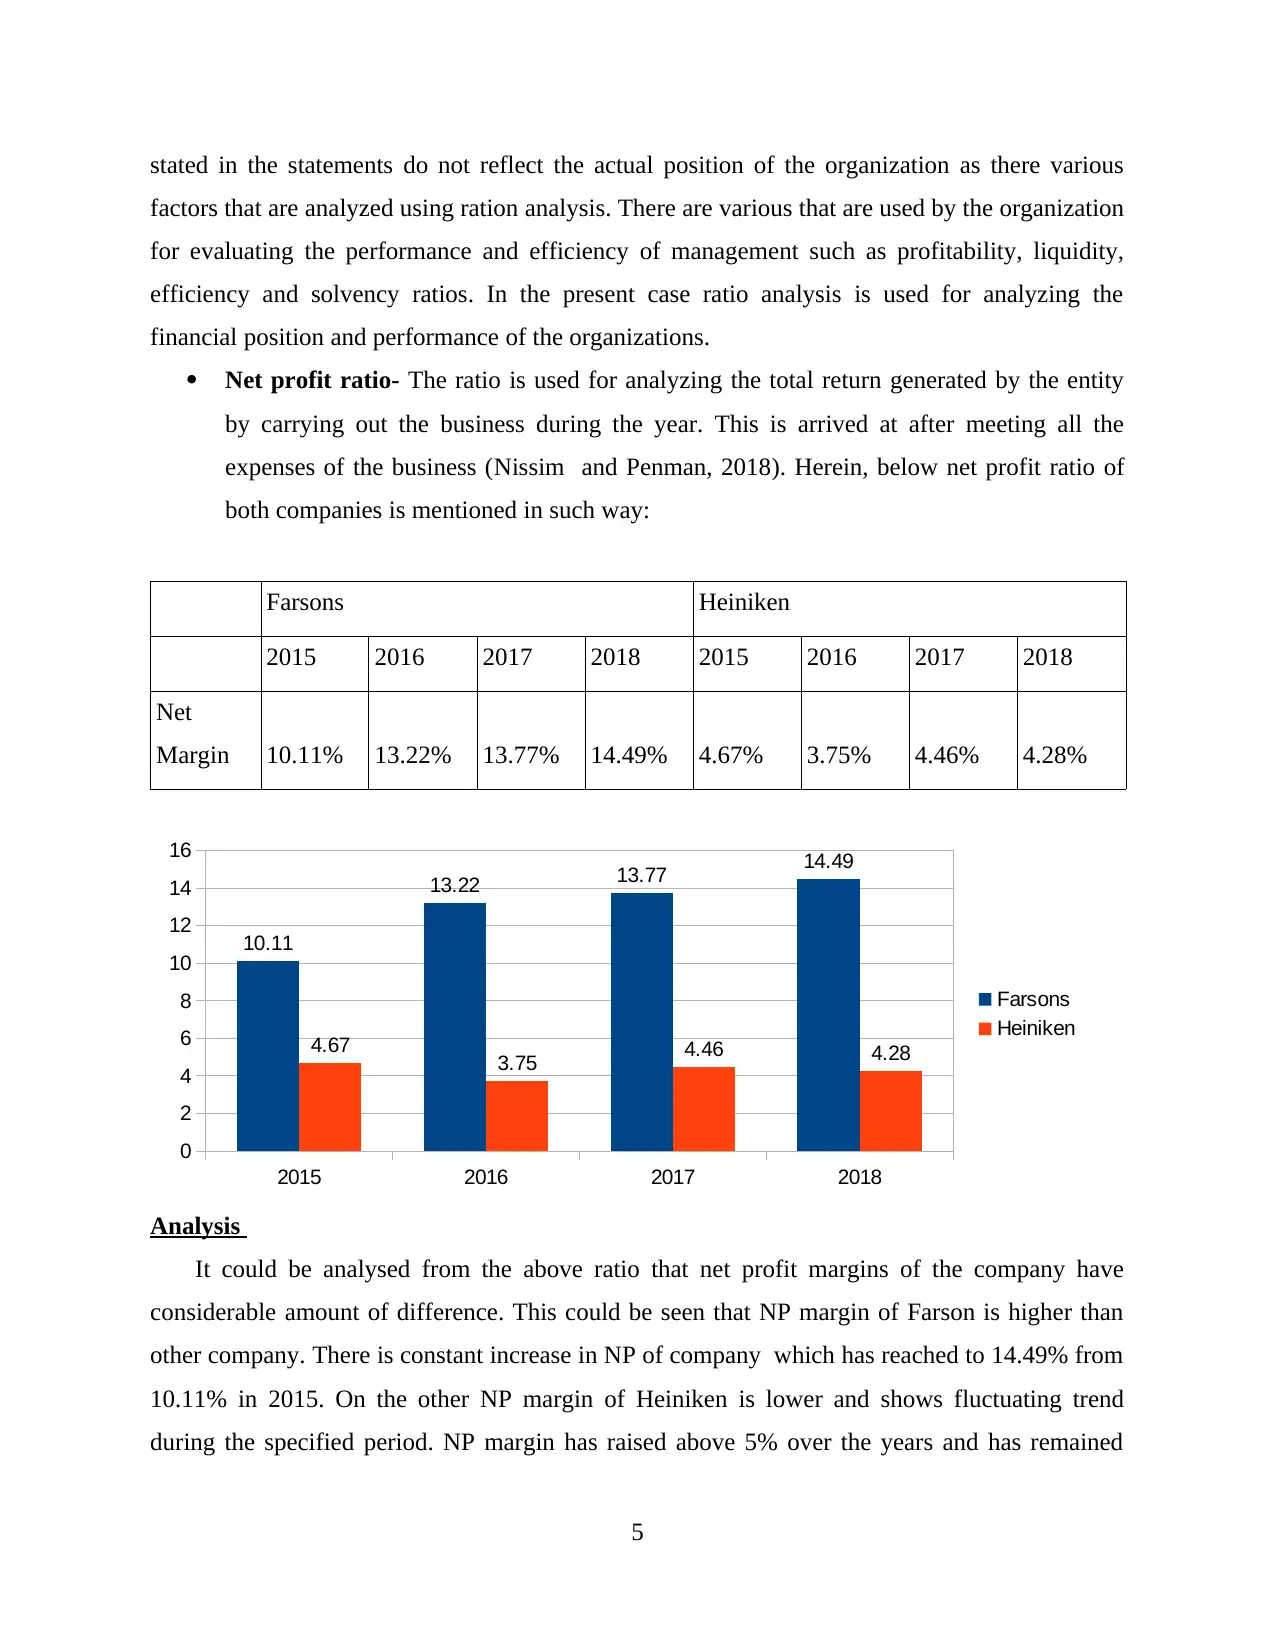
Net profit ratio- The ratio is used for analyzing the total return generated by the entity
by carrying out the business during the year. This is arrived at after meeting all the
expenses of the business (Nissim and Penman, 2018). Herein, below net profit ratio of
both companies is mentioned in such way:
Farsons Heiniken
2015 2016 2017 2018 2015 2016 2017 2018
Net
Margin 10.11% 13.22% 13.77% 14.49% 4.67% 3.75% 4.46% 4.28%
2015 2016 2017 2018
0
2
4
6
8
10
12
14
16
10.11
13.22 13.77 14.49
4.67 3.75 4.46 4.28
Farsons
Heiniken
Analysis
It could be analysed from the above ratio that net profit margins of the company have
considerable amount of difference. This could be seen that NP margin of Farson is higher than
other company. There is constant increase in NP of company which has reached to 14.49% from
10.11% in 2015. On the other NP margin of Heiniken is lower and shows fluctuating trend
during the specified period. NP margin has raised above 5% over the years and has remained
5
factors that are analyzed using ration analysis. There are various that are used by the organization
for evaluating the performance and efficiency of management such as profitability, liquidity,
efficiency and solvency ratios. In the present case ratio analysis is used for analyzing the
financial position and performance of the organizations.
Net profit ratio- The ratio is used for analyzing the total return generated by the entity
by carrying out the business during the year. This is arrived at after meeting all the
expenses of the business (Nissim and Penman, 2018). Herein, below net profit ratio of
both companies is mentioned in such way:
Farsons Heiniken
2015 2016 2017 2018 2015 2016 2017 2018
Net
Margin 10.11% 13.22% 13.77% 14.49% 4.67% 3.75% 4.46% 4.28%
2015 2016 2017 2018
0
2
4
6
8
10
12
14
16
10.11
13.22 13.77 14.49
4.67 3.75 4.46 4.28
Farsons
Heiniken
Analysis
It could be analysed from the above ratio that net profit margins of the company have
considerable amount of difference. This could be seen that NP margin of Farson is higher than
other company. There is constant increase in NP of company which has reached to 14.49% from
10.11% in 2015. On the other NP margin of Heiniken is lower and shows fluctuating trend
during the specified period. NP margin has raised above 5% over the years and has remained
5
Paraphrase This Document
Need a fresh take? Get an instant paraphrase of this document with our AI Paraphraser
between range of 3.5% - 4.8% company must have high profit margin for achieving goals and
objectives and expanding the business.
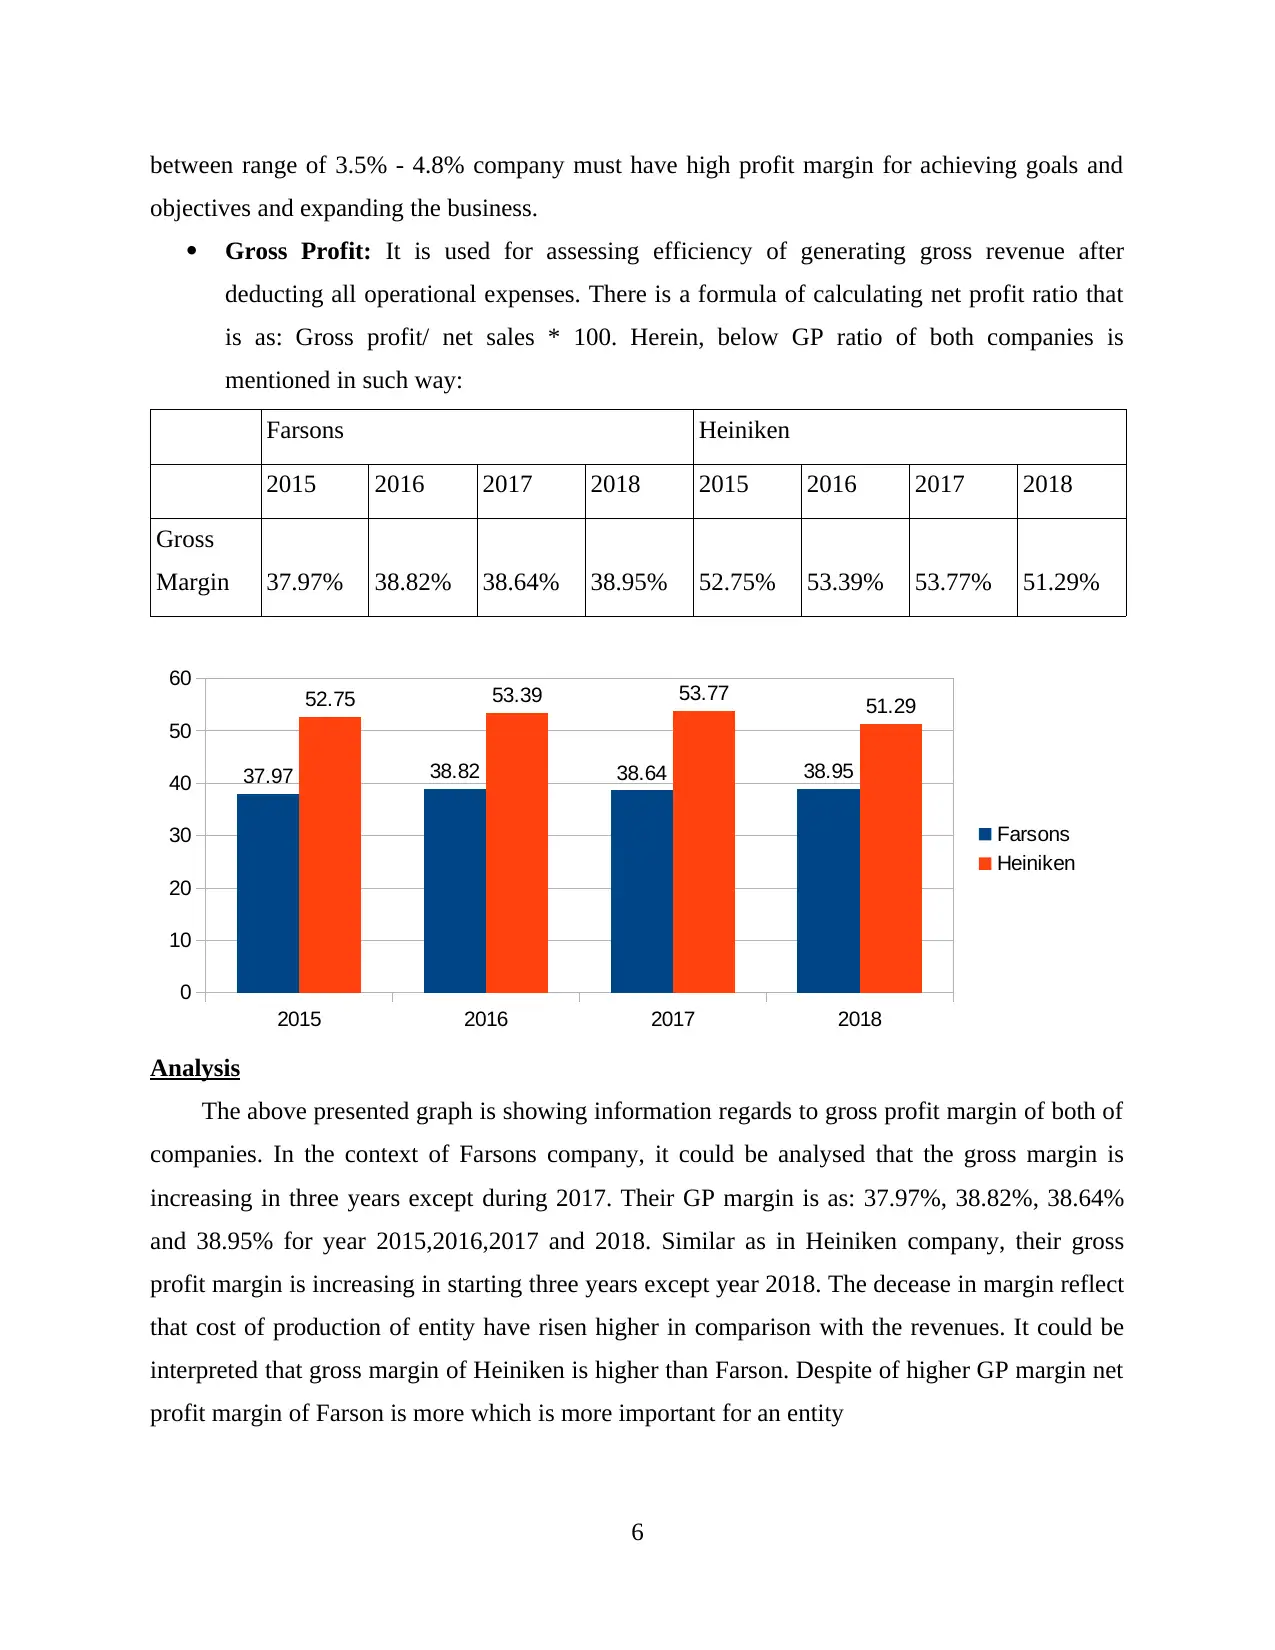
Gross Profit: It is used for assessing efficiency of generating gross revenue after
deducting all operational expenses. There is a formula of calculating net profit ratio that
is as: Gross profit/ net sales * 100. Herein, below GP ratio of both companies is
mentioned in such way:
Farsons Heiniken
2015 2016 2017 2018 2015 2016 2017 2018
Gross
Margin 37.97% 38.82% 38.64% 38.95% 52.75% 53.39% 53.77% 51.29%
2015 2016 2017 2018
0
10
20
30
40
50
60
37.97 38.82 38.64 38.95
52.75 53.39 53.77 51.29
Farsons
Heiniken
Analysis
The above presented graph is showing information regards to gross profit margin of both of
companies. In the context of Farsons company, it could be analysed that the gross margin is
increasing in three years except during 2017. Their GP margin is as: 37.97%, 38.82%, 38.64%
and 38.95% for year 2015,2016,2017 and 2018. Similar as in Heiniken company, their gross
profit margin is increasing in starting three years except year 2018. The decease in margin reflect
that cost of production of entity have risen higher in comparison with the revenues. It could be
interpreted that gross margin of Heiniken is higher than Farson. Despite of higher GP margin net
profit margin of Farson is more which is more important for an entity
6
objectives and expanding the business.
Gross Profit: It is used for assessing efficiency of generating gross revenue after
deducting all operational expenses. There is a formula of calculating net profit ratio that
is as: Gross profit/ net sales * 100. Herein, below GP ratio of both companies is
mentioned in such way:
Farsons Heiniken
2015 2016 2017 2018 2015 2016 2017 2018
Gross
Margin 37.97% 38.82% 38.64% 38.95% 52.75% 53.39% 53.77% 51.29%
2015 2016 2017 2018
0
10
20
30
40
50
60
37.97 38.82 38.64 38.95
52.75 53.39 53.77 51.29
Farsons
Heiniken
Analysis
The above presented graph is showing information regards to gross profit margin of both of
companies. In the context of Farsons company, it could be analysed that the gross margin is
increasing in three years except during 2017. Their GP margin is as: 37.97%, 38.82%, 38.64%
and 38.95% for year 2015,2016,2017 and 2018. Similar as in Heiniken company, their gross
profit margin is increasing in starting three years except year 2018. The decease in margin reflect
that cost of production of entity have risen higher in comparison with the revenues. It could be
interpreted that gross margin of Heiniken is higher than Farson. Despite of higher GP margin net
profit margin of Farson is more which is more important for an entity
6
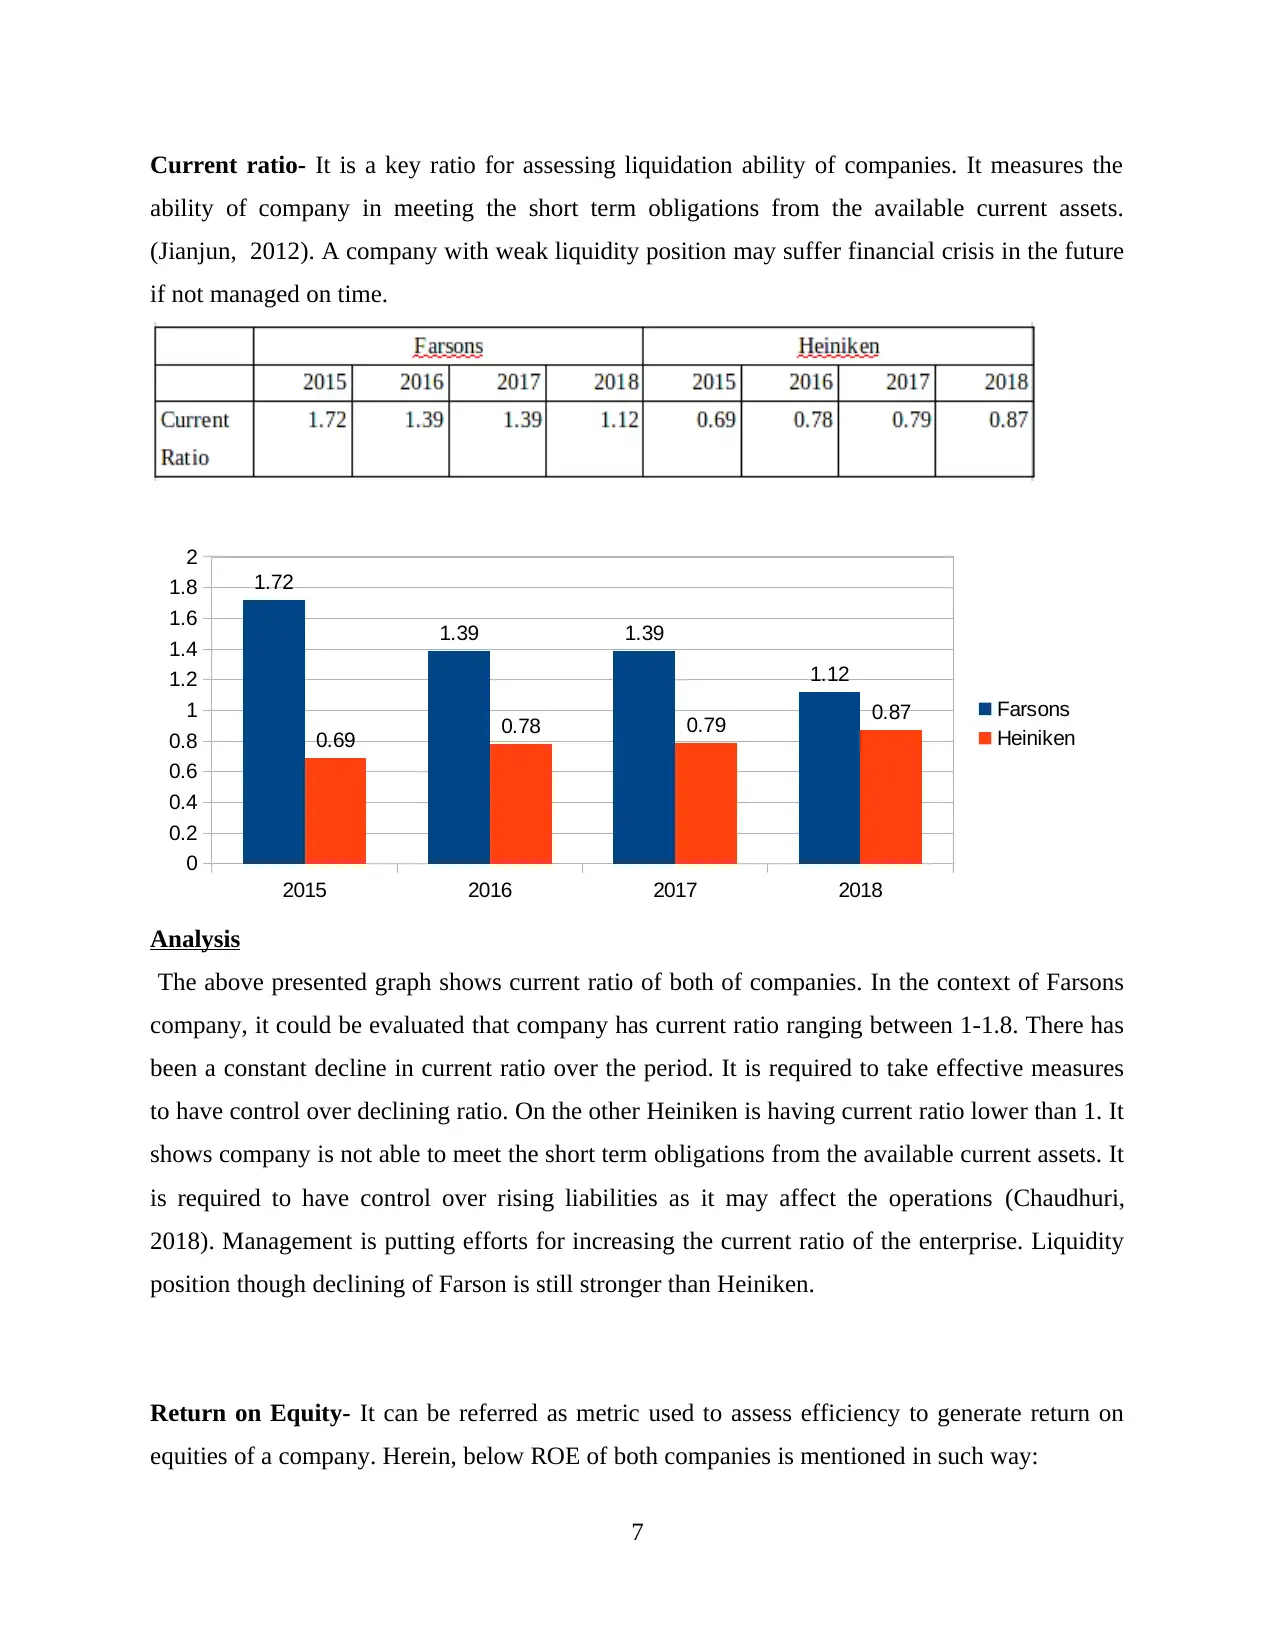
Current ratio- It is a key ratio for assessing liquidation ability of companies. It measures the
ability of company in meeting the short term obligations from the available current assets.
(Jianjun, 2012). A company with weak liquidity position may suffer financial crisis in the future
if not managed on time.
2015 2016 2017 2018
0
0.2
0.4
0.6
0.8
1
1.2
1.4
1.6
1.8
2
1.72
1.39 1.39
1.12
0.69 0.78 0.79 0.87 Farsons
Heiniken
Analysis
The above presented graph shows current ratio of both of companies. In the context of Farsons
company, it could be evaluated that company has current ratio ranging between 1-1.8. There has
been a constant decline in current ratio over the period. It is required to take effective measures
to have control over declining ratio. On the other Heiniken is having current ratio lower than 1. It
shows company is not able to meet the short term obligations from the available current assets. It
is required to have control over rising liabilities as it may affect the operations (Chaudhuri,
2018). Management is putting efforts for increasing the current ratio of the enterprise. Liquidity
position though declining of Farson is still stronger than Heiniken.
Return on Equity- It can be referred as metric used to assess efficiency to generate return on
equities of a company. Herein, below ROE of both companies is mentioned in such way:
7
⊘ This is a preview!⊘
Do you want full access?
Subscribe today to unlock all pages.
Trusted by 1+ million students worldwide
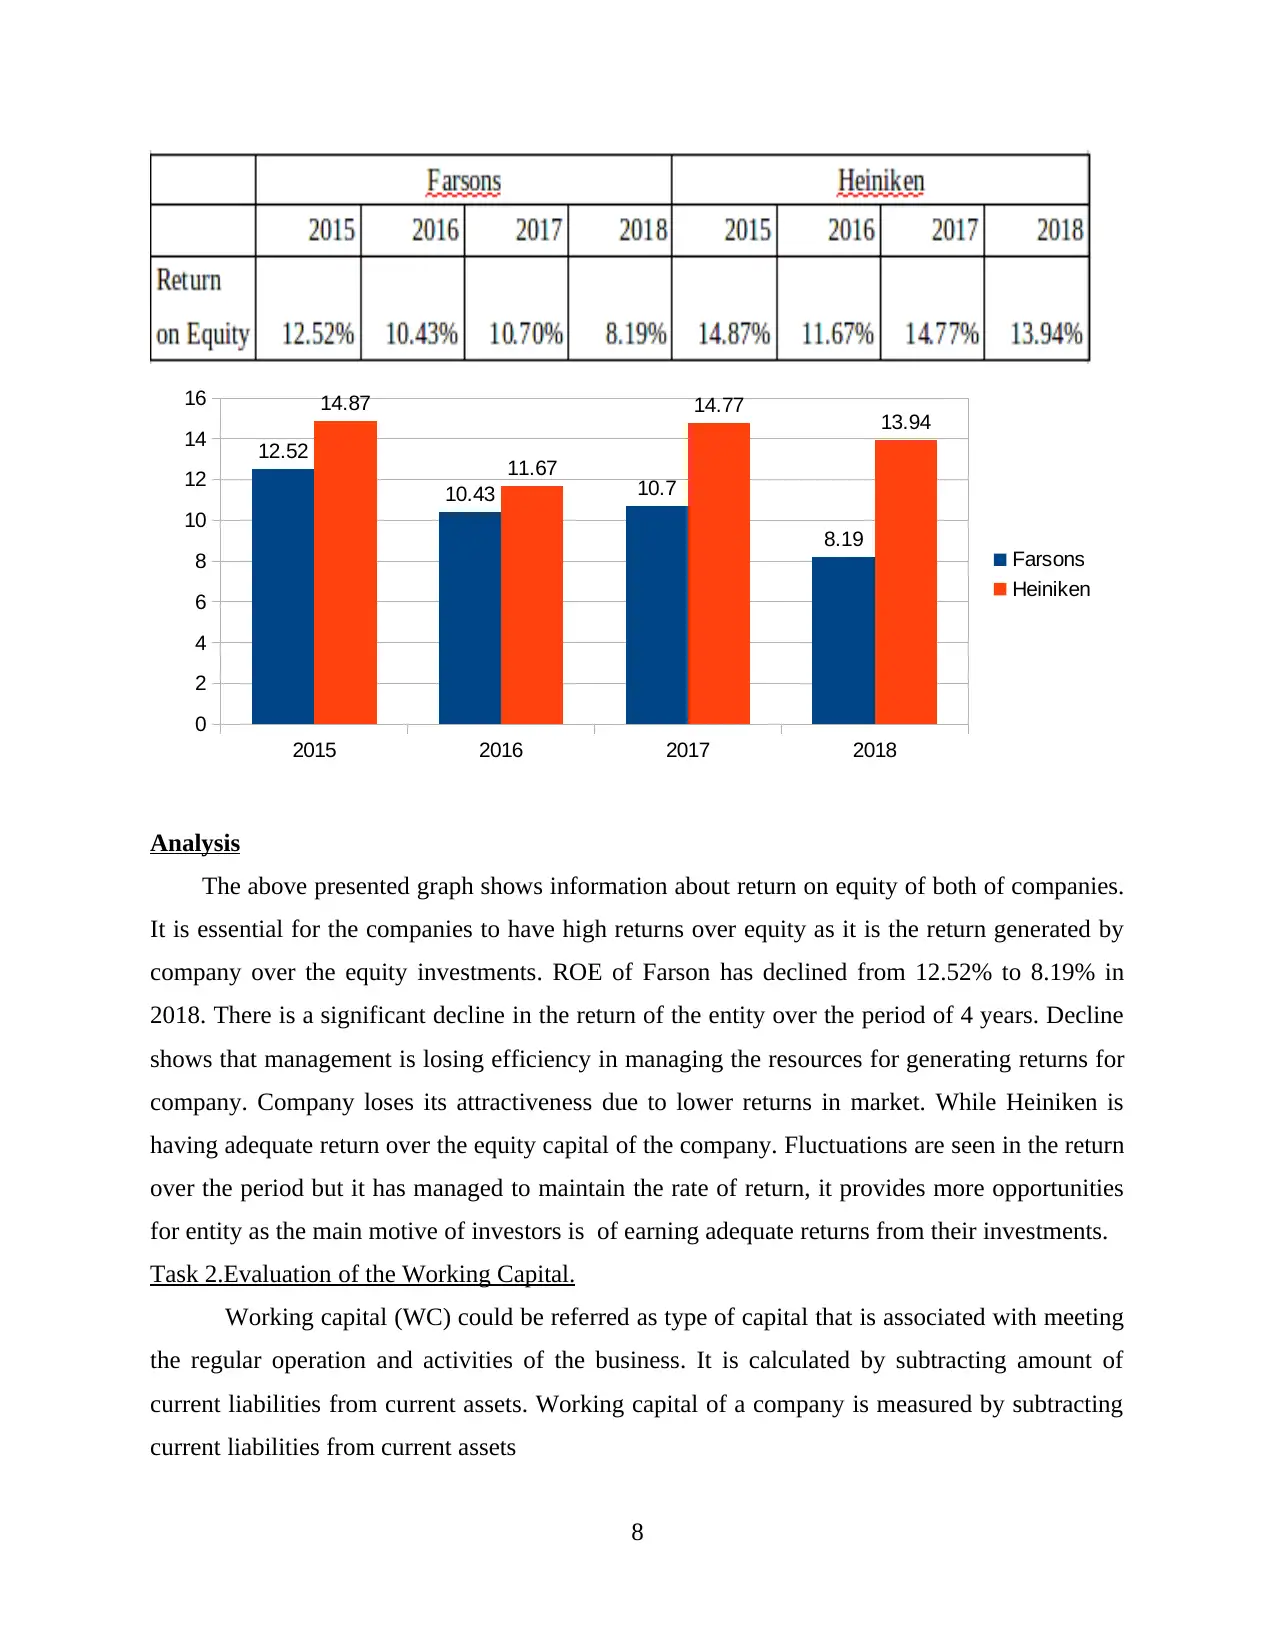
Analysis
The above presented graph shows information about return on equity of both of companies.
It is essential for the companies to have high returns over equity as it is the return generated by
company over the equity investments. ROE of Farson has declined from 12.52% to 8.19% in
2018. There is a significant decline in the return of the entity over the period of 4 years. Decline
shows that management is losing efficiency in managing the resources for generating returns for
company. Company loses its attractiveness due to lower returns in market. While Heiniken is
having adequate return over the equity capital of the company. Fluctuations are seen in the return
over the period but it has managed to maintain the rate of return, it provides more opportunities
for entity as the main motive of investors is of earning adequate returns from their investments.
Task 2.Evaluation of the Working Capital.
Working capital (WC) could be referred as type of capital that is associated with meeting
the regular operation and activities of the business. It is calculated by subtracting amount of
current liabilities from current assets. Working capital of a company is measured by subtracting
current liabilities from current assets
8
2015 2016 2017 2018
0
2
4
6
8
10
12
14
16
12.52
10.43 10.7
8.19
14.87
11.67
14.77 13.94
Farsons
Heiniken
Paraphrase This Document
Need a fresh take? Get an instant paraphrase of this document with our AI Paraphraser
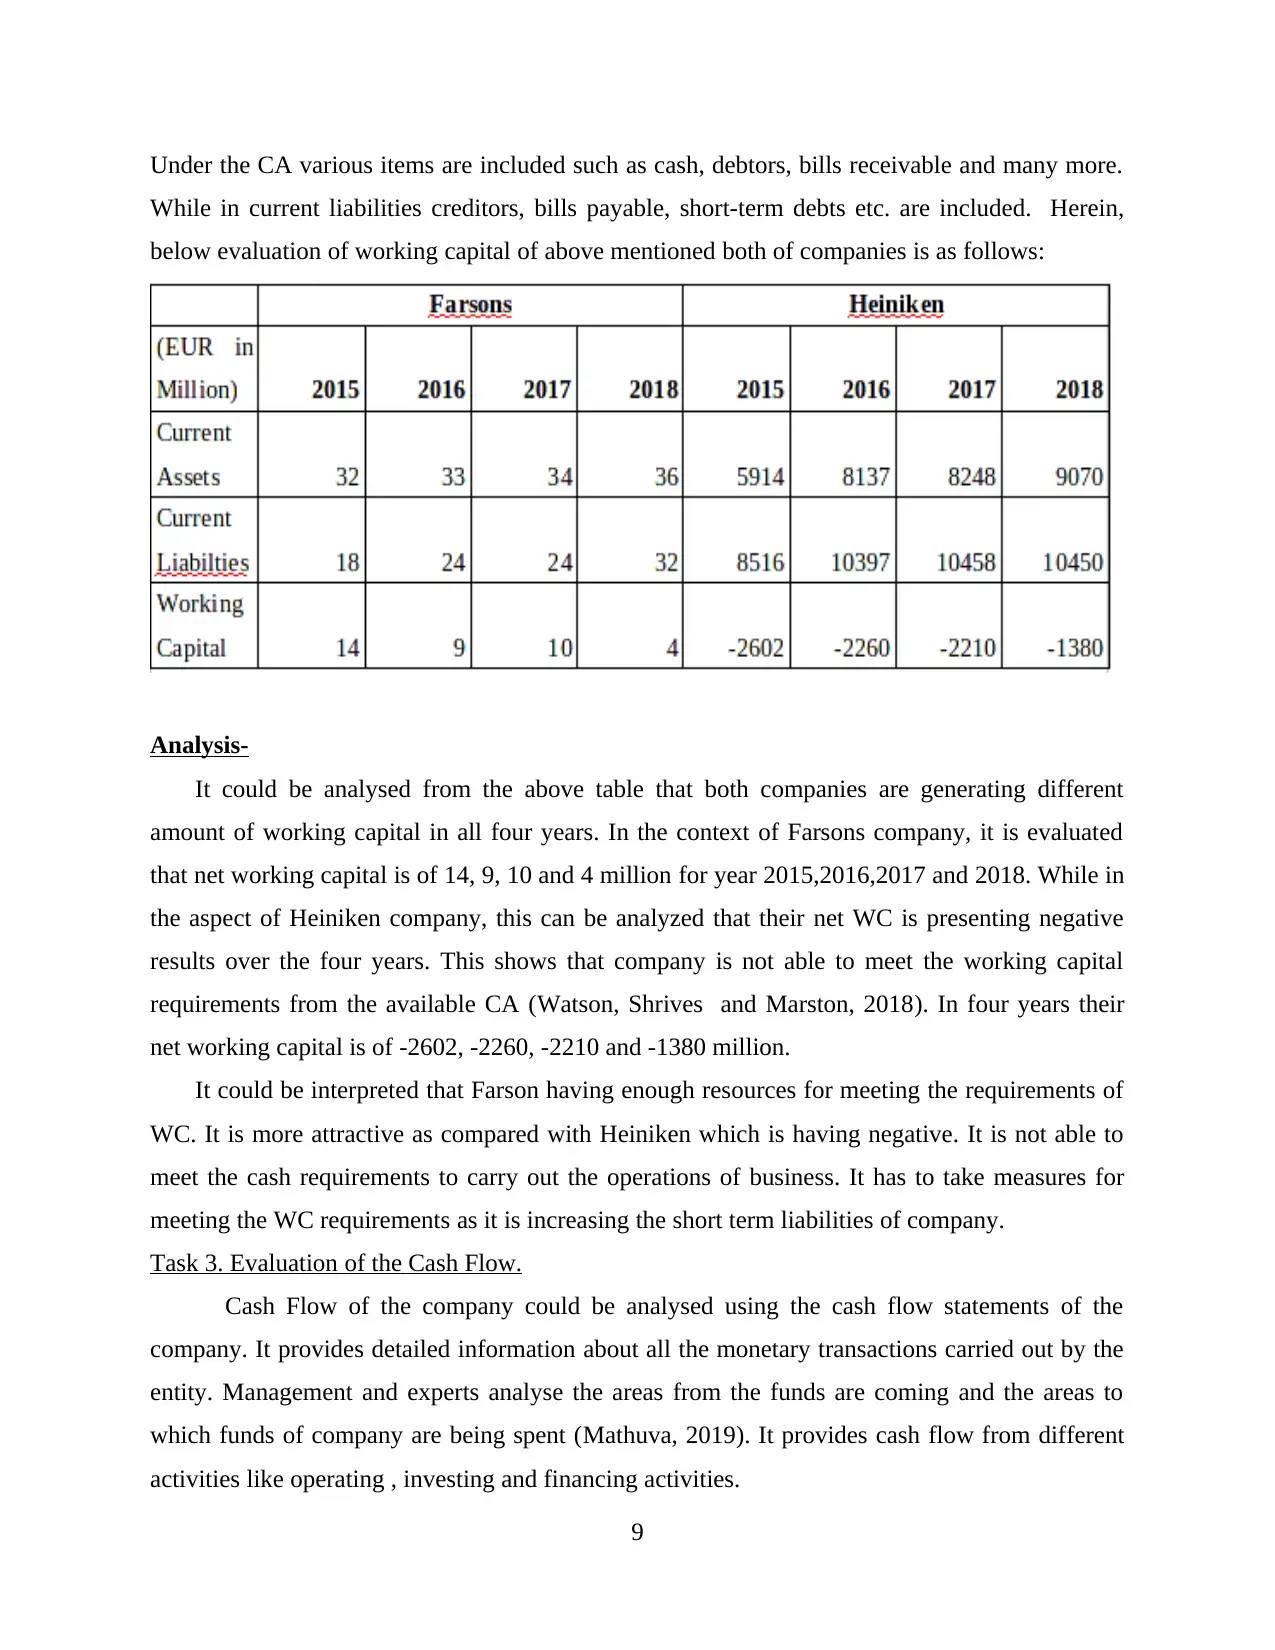
Under the CA various items are included such as cash, debtors, bills receivable and many more.
While in current liabilities creditors, bills payable, short-term debts etc. are included. Herein,
below evaluation of working capital of above mentioned both of companies is as follows:
Analysis-
It could be analysed from the above table that both companies are generating different
amount of working capital in all four years. In the context of Farsons company, it is evaluated
that net working capital is of 14, 9, 10 and 4 million for year 2015,2016,2017 and 2018. While in
the aspect of Heiniken company, this can be analyzed that their net WC is presenting negative
results over the four years. This shows that company is not able to meet the working capital
requirements from the available CA (Watson, Shrives and Marston, 2018). In four years their
net working capital is of -2602, -2260, -2210 and -1380 million.
It could be interpreted that Farson having enough resources for meeting the requirements of
WC. It is more attractive as compared with Heiniken which is having negative. It is not able to
meet the cash requirements to carry out the operations of business. It has to take measures for
meeting the WC requirements as it is increasing the short term liabilities of company.
Task 3. Evaluation of the Cash Flow.
Cash Flow of the company could be analysed using the cash flow statements of the
company. It provides detailed information about all the monetary transactions carried out by the
entity. Management and experts analyse the areas from the funds are coming and the areas to
which funds of company are being spent (Mathuva, 2019). It provides cash flow from different
activities like operating , investing and financing activities.
9
Heiniken:
It could be evaluated operating cash flows are increasing throughout the four years. It
could be seen that there is constant increase in the cash flows over the period. There is no major
change seen in working capital except in 2018. It has negative cash flows from the investing
activities as company has significant purchase transactions of the PPE and investments in
properties. It made a major acquisition in 2017. Financing activities shows that company has
major outflow in payment of debt and dividends and inflow from debts capital.
Farsons:
It could be analysed that company operating activity cash flows are positive during the
years. It has also shown increase in amount of cash balance from operating activities. There are
very low WC changes in statement. Company makes investment and purchase PPE but these are
not significant. Financing activities shows that has raised funds through and made repayment
every year. Company is also paying dividend every year. Cash flow position of the company is
negative during the year (Carslaw and Mills, 2019). Therefore it could be analysed that Heiniken
is more efficiently managing the cash flows of the business and Farson is required to pay
attention over maintaining positive cash flows for the business.
CONCLUSION
It is summarized from the study, that financial analysis is essential for organisations in
order to do proper evaluation. The report concludes about financial analysis of two firms:
Heiniken Farsons from different techniques such as horizontal & vertical analysis and ratio
analysis. Both companies' performance is average. In some aspects, Heiniken Company is better
while in others Farsons is better. The further part of report concludes about cash flow & WC
analysis in which both companies are beating each other.
10
⊘ This is a preview!⊘
Do you want full access?
Subscribe today to unlock all pages.
Trusted by 1+ million students worldwide
1 out of 32
Related Documents


Your All-in-One AI-Powered Toolkit for Academic Success.
+13062052269
info@desklib.com
Available 24*7 on WhatsApp / Email
![[object Object]](/_next/static/media/star-bottom.7253800d.svg)
Unlock your academic potential
Copyright © 2020–2026 A2Z Services. All Rights Reserved. Developed and managed by ZUCOL.