Comprehensive Business Performance and Financial Analysis Report

Verified

Added on  2023/02/01

|8
|569
|27
Homework Assignment
AI Summary
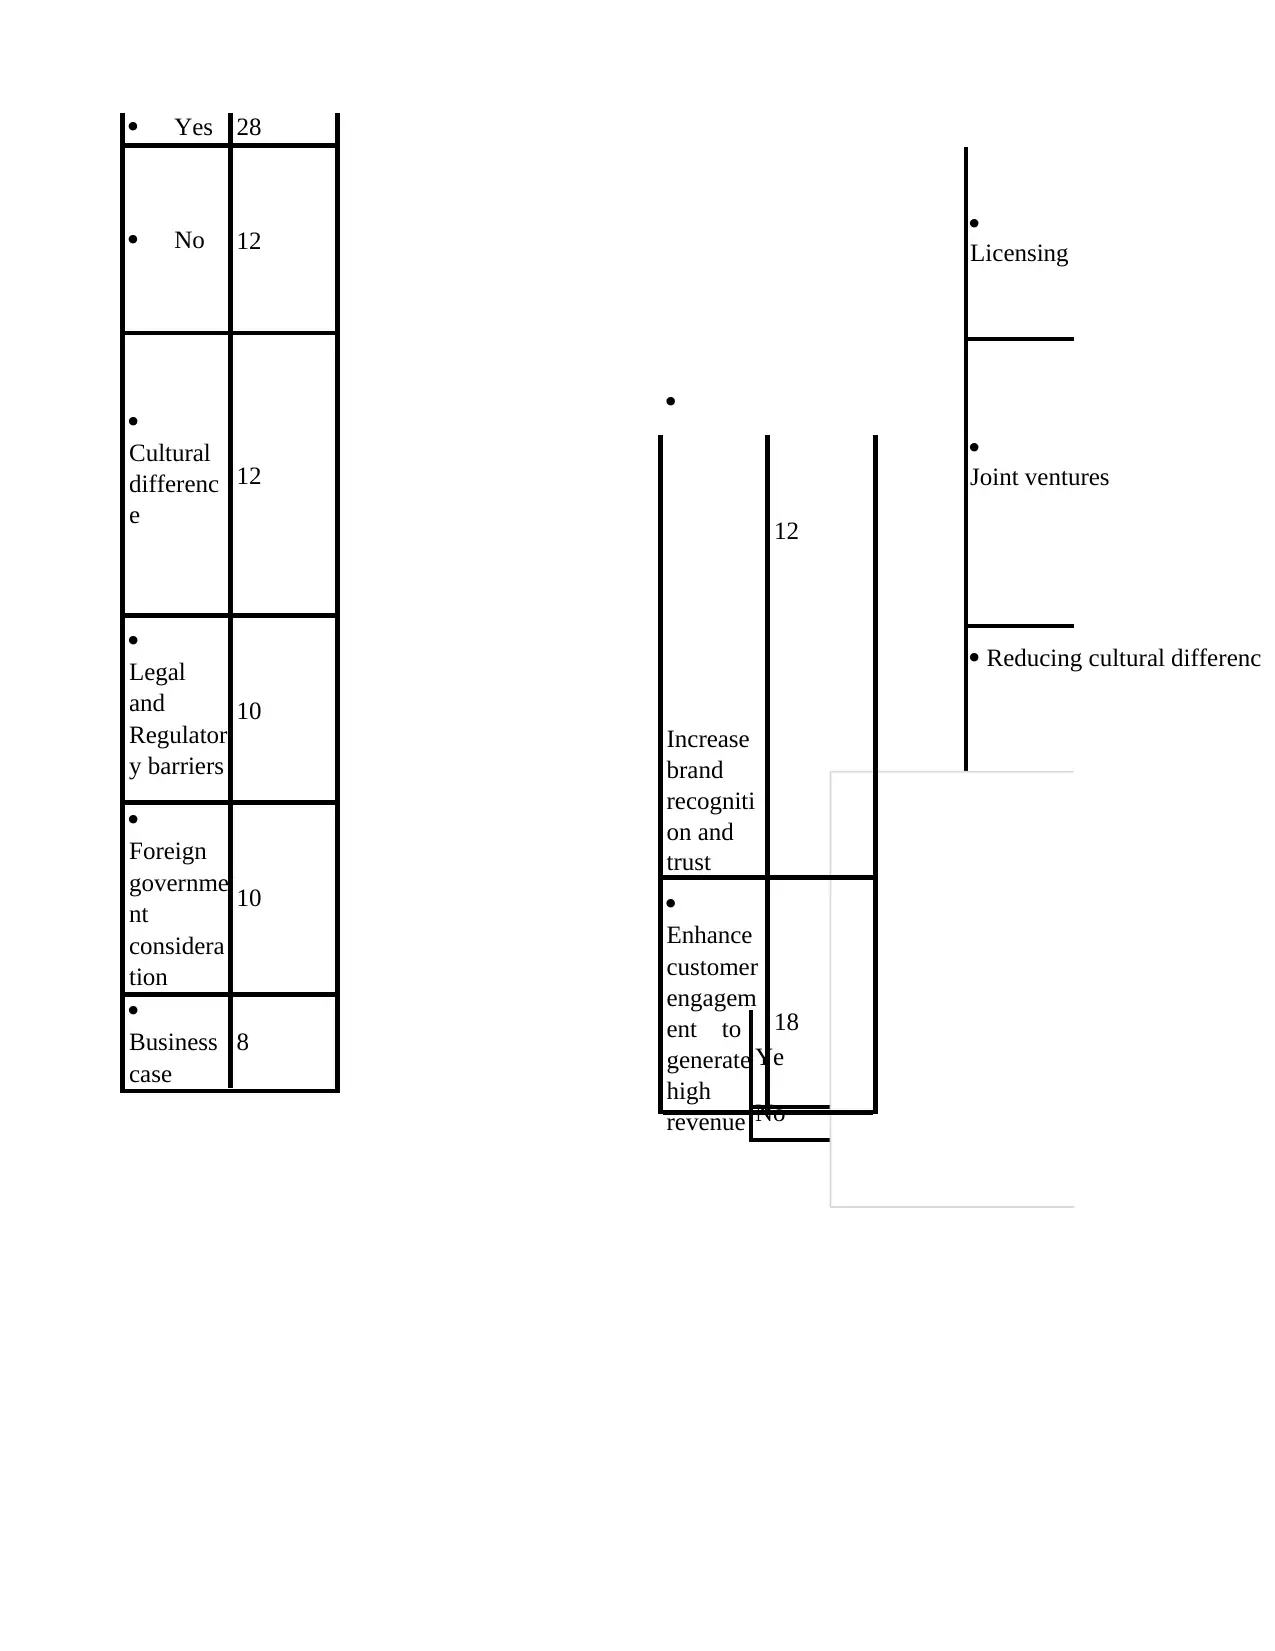
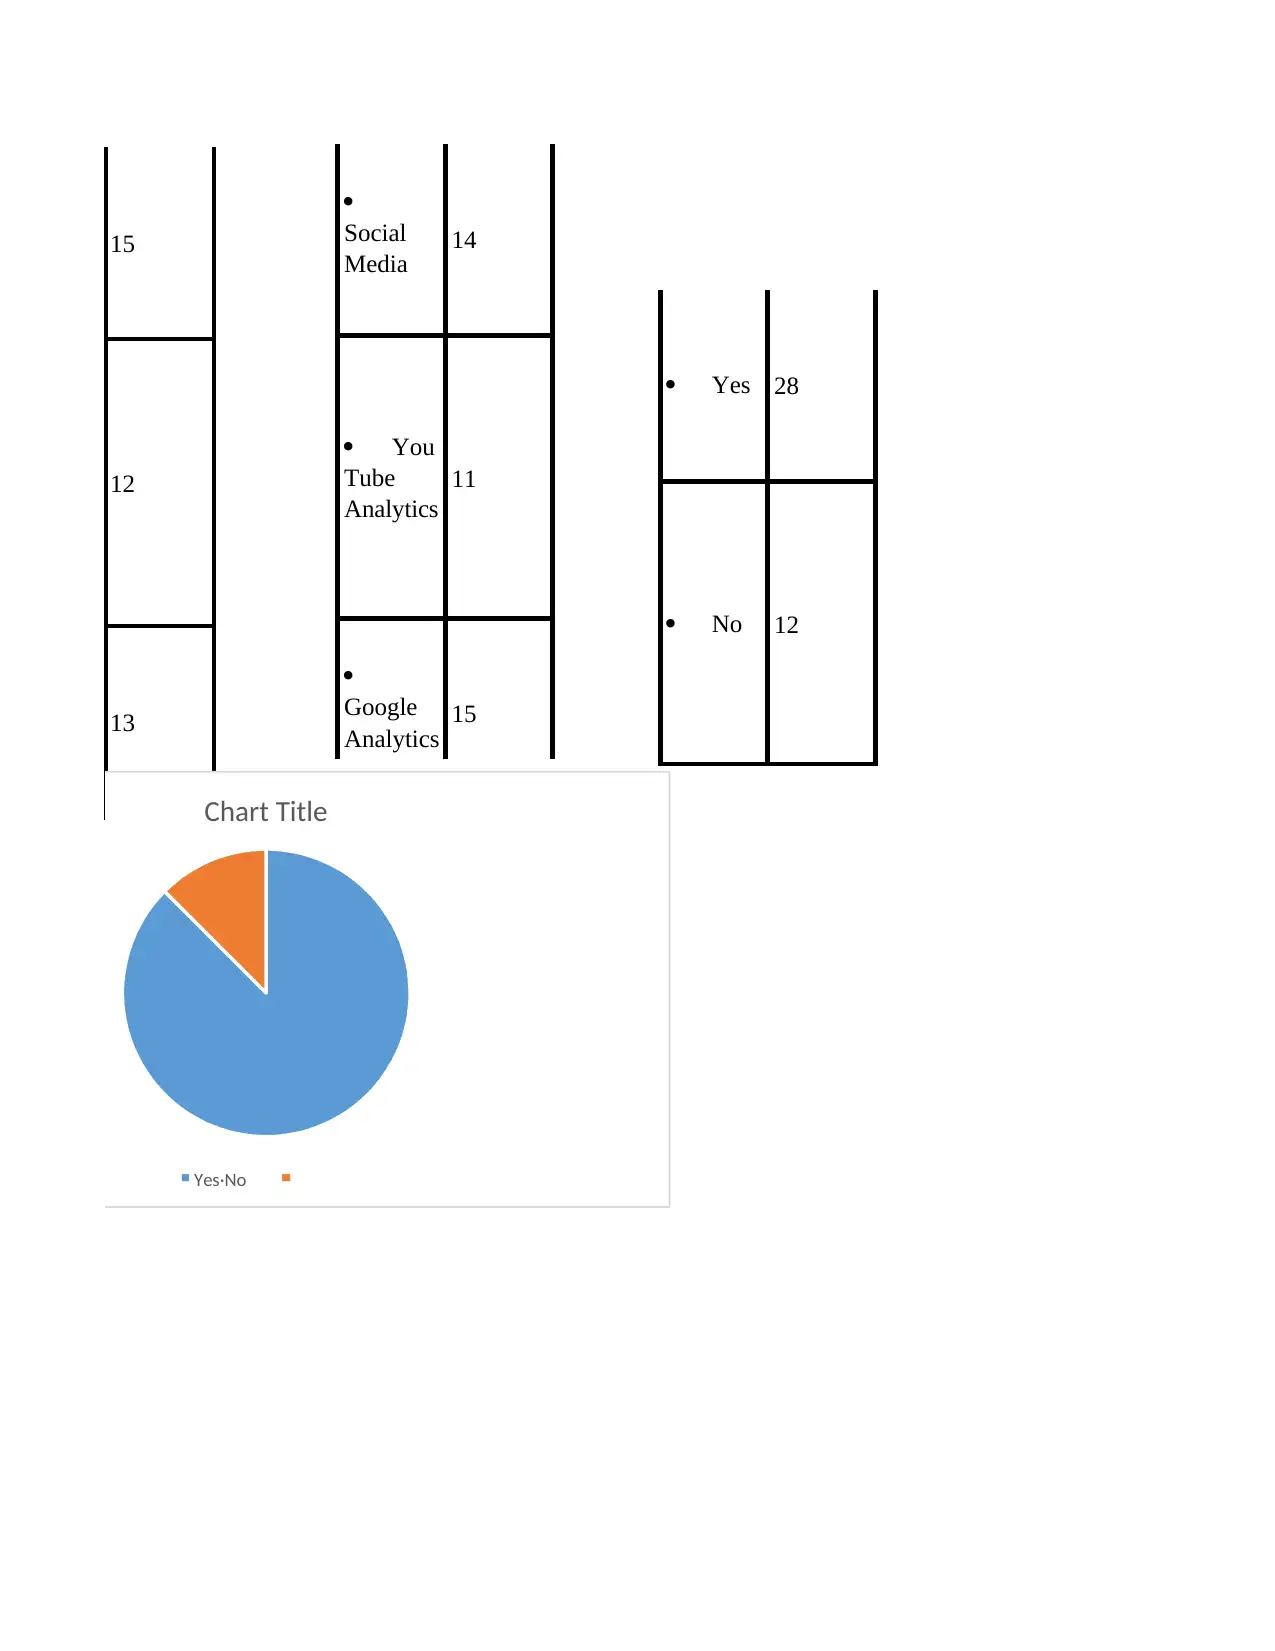
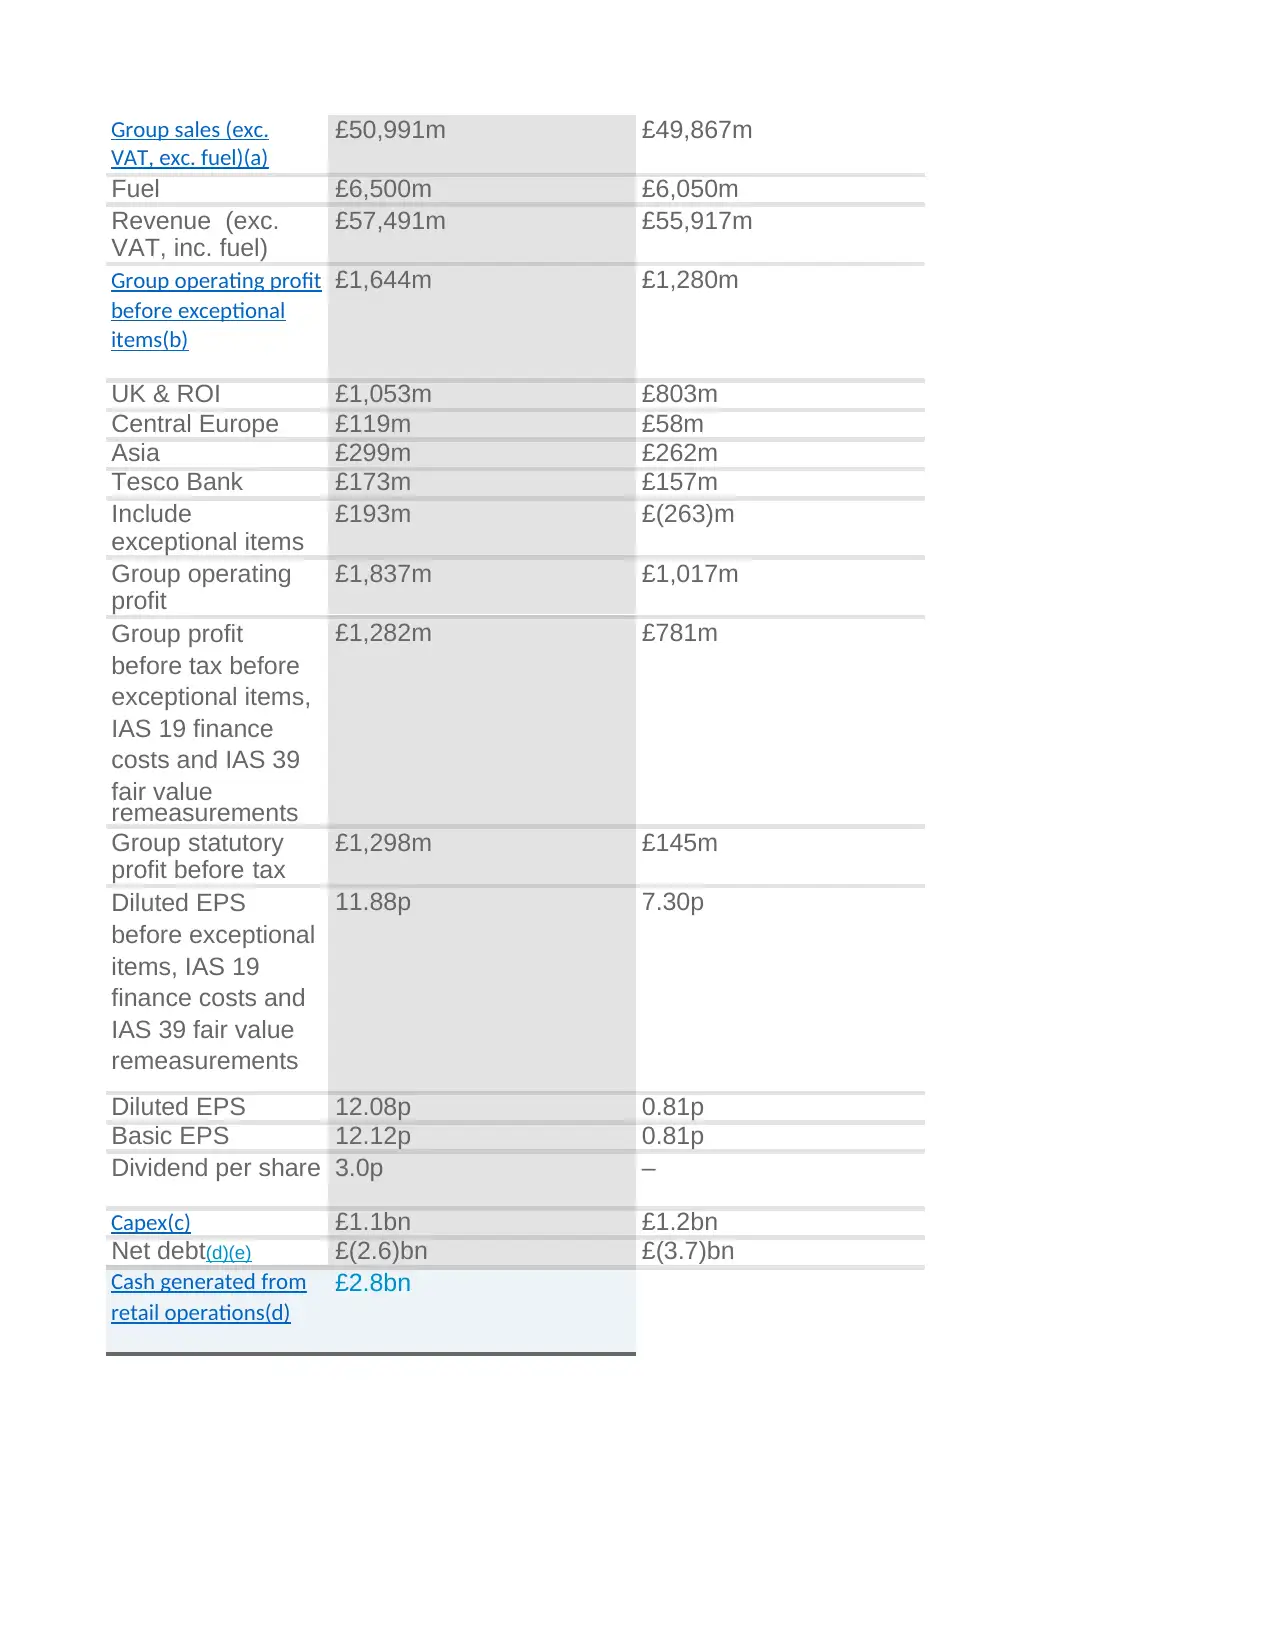
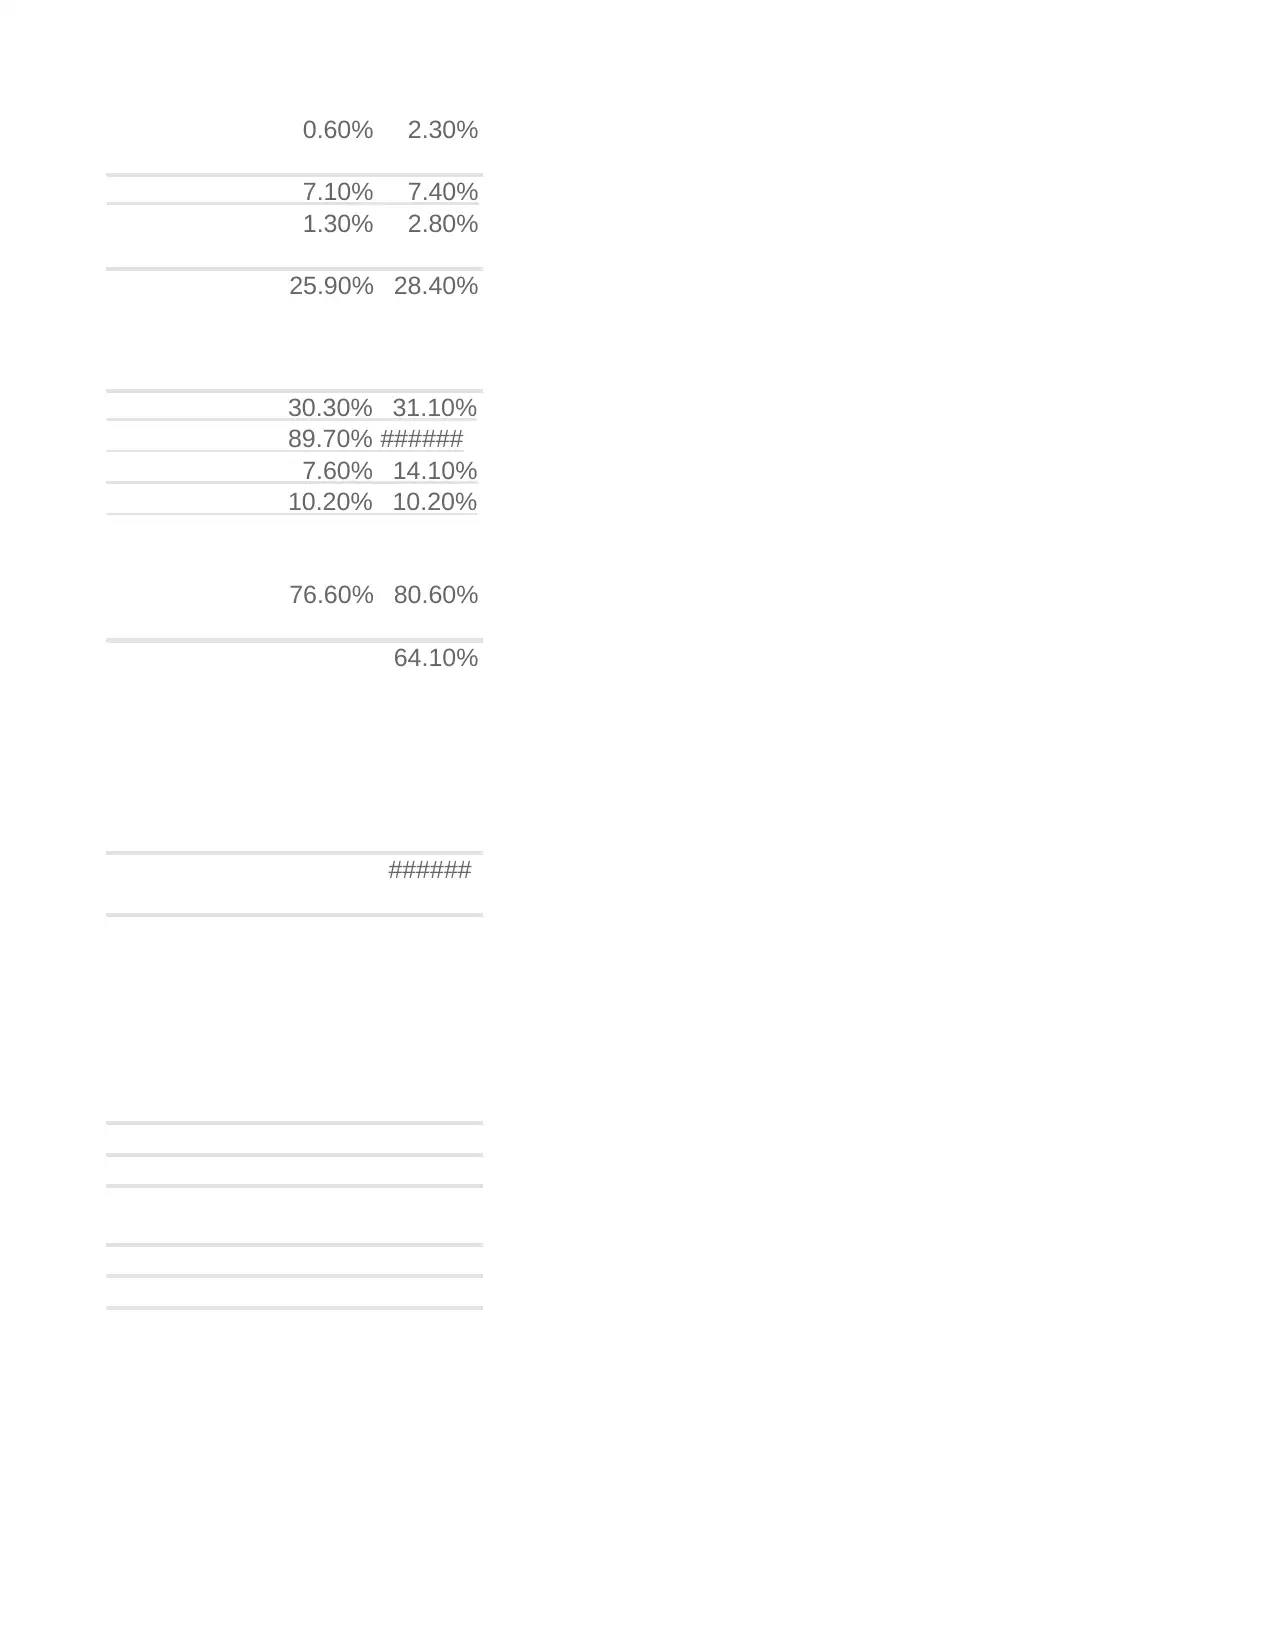
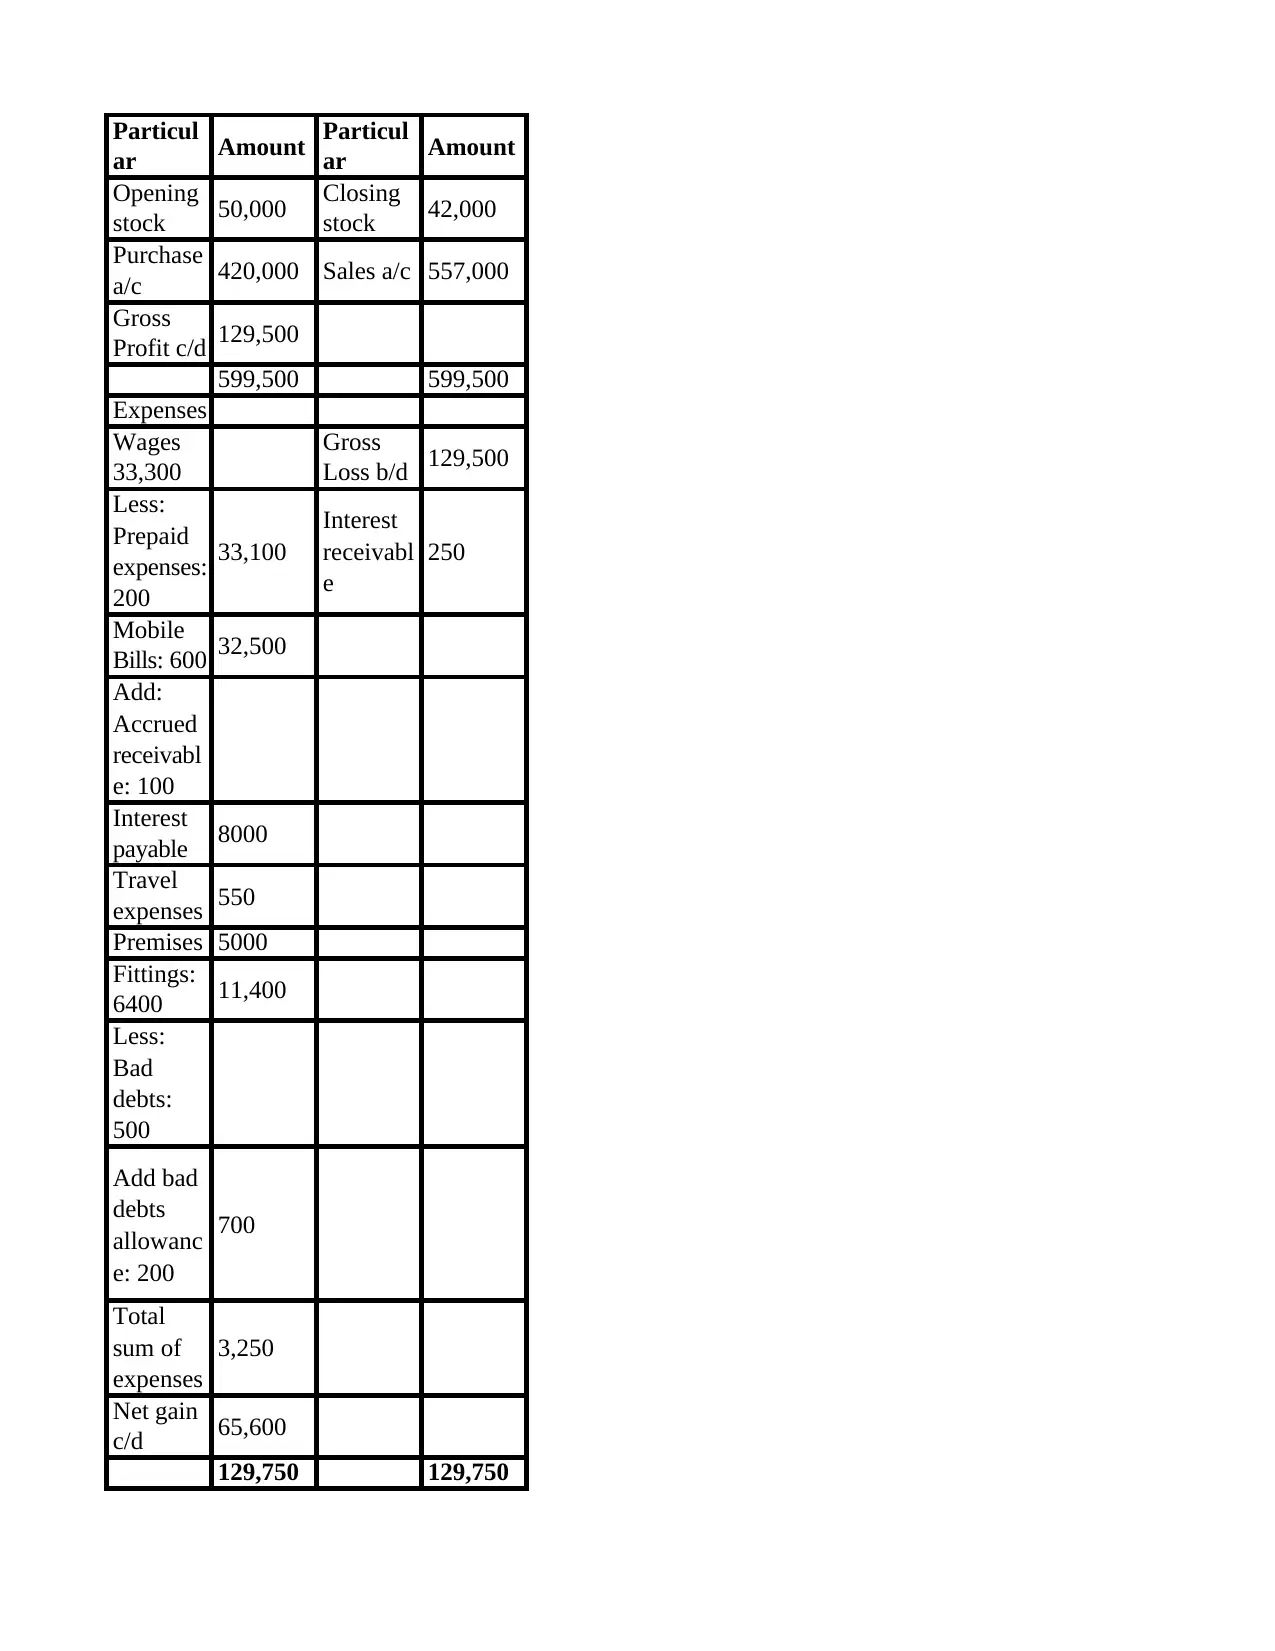
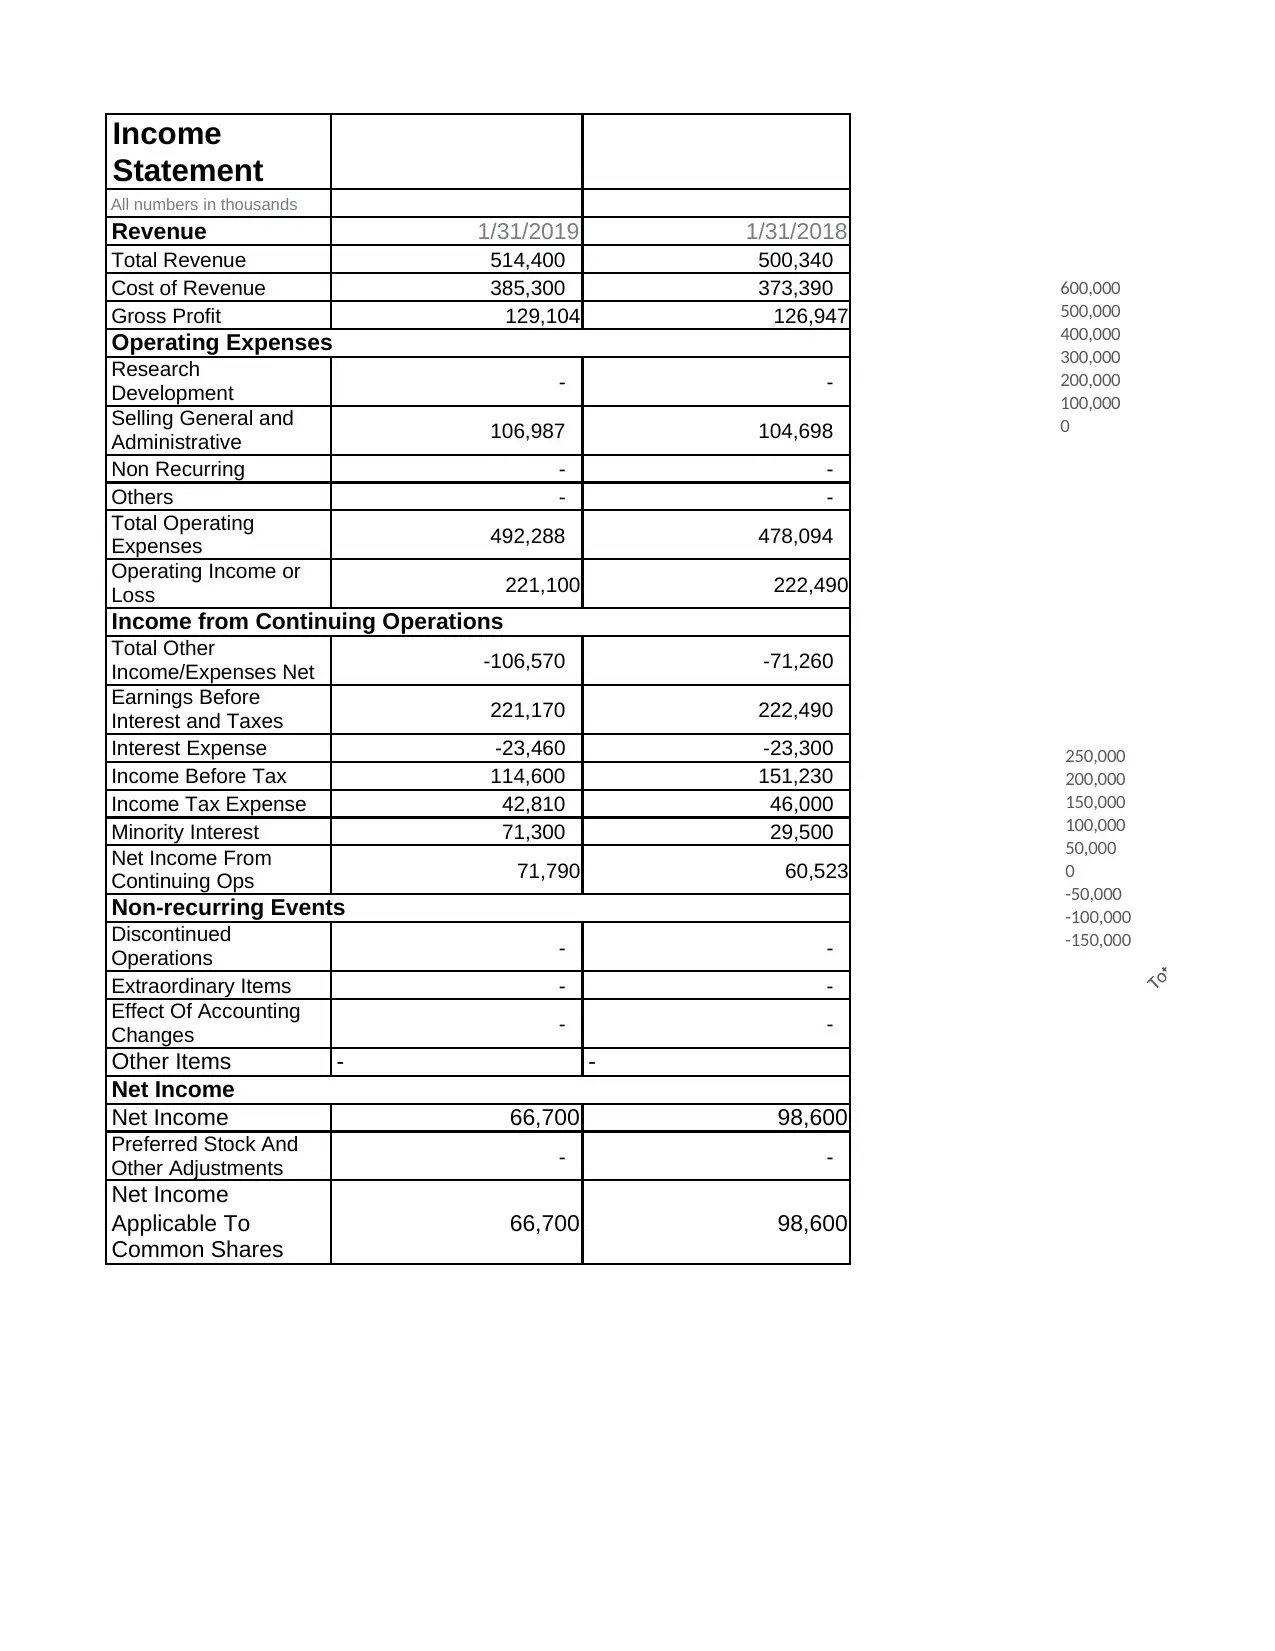
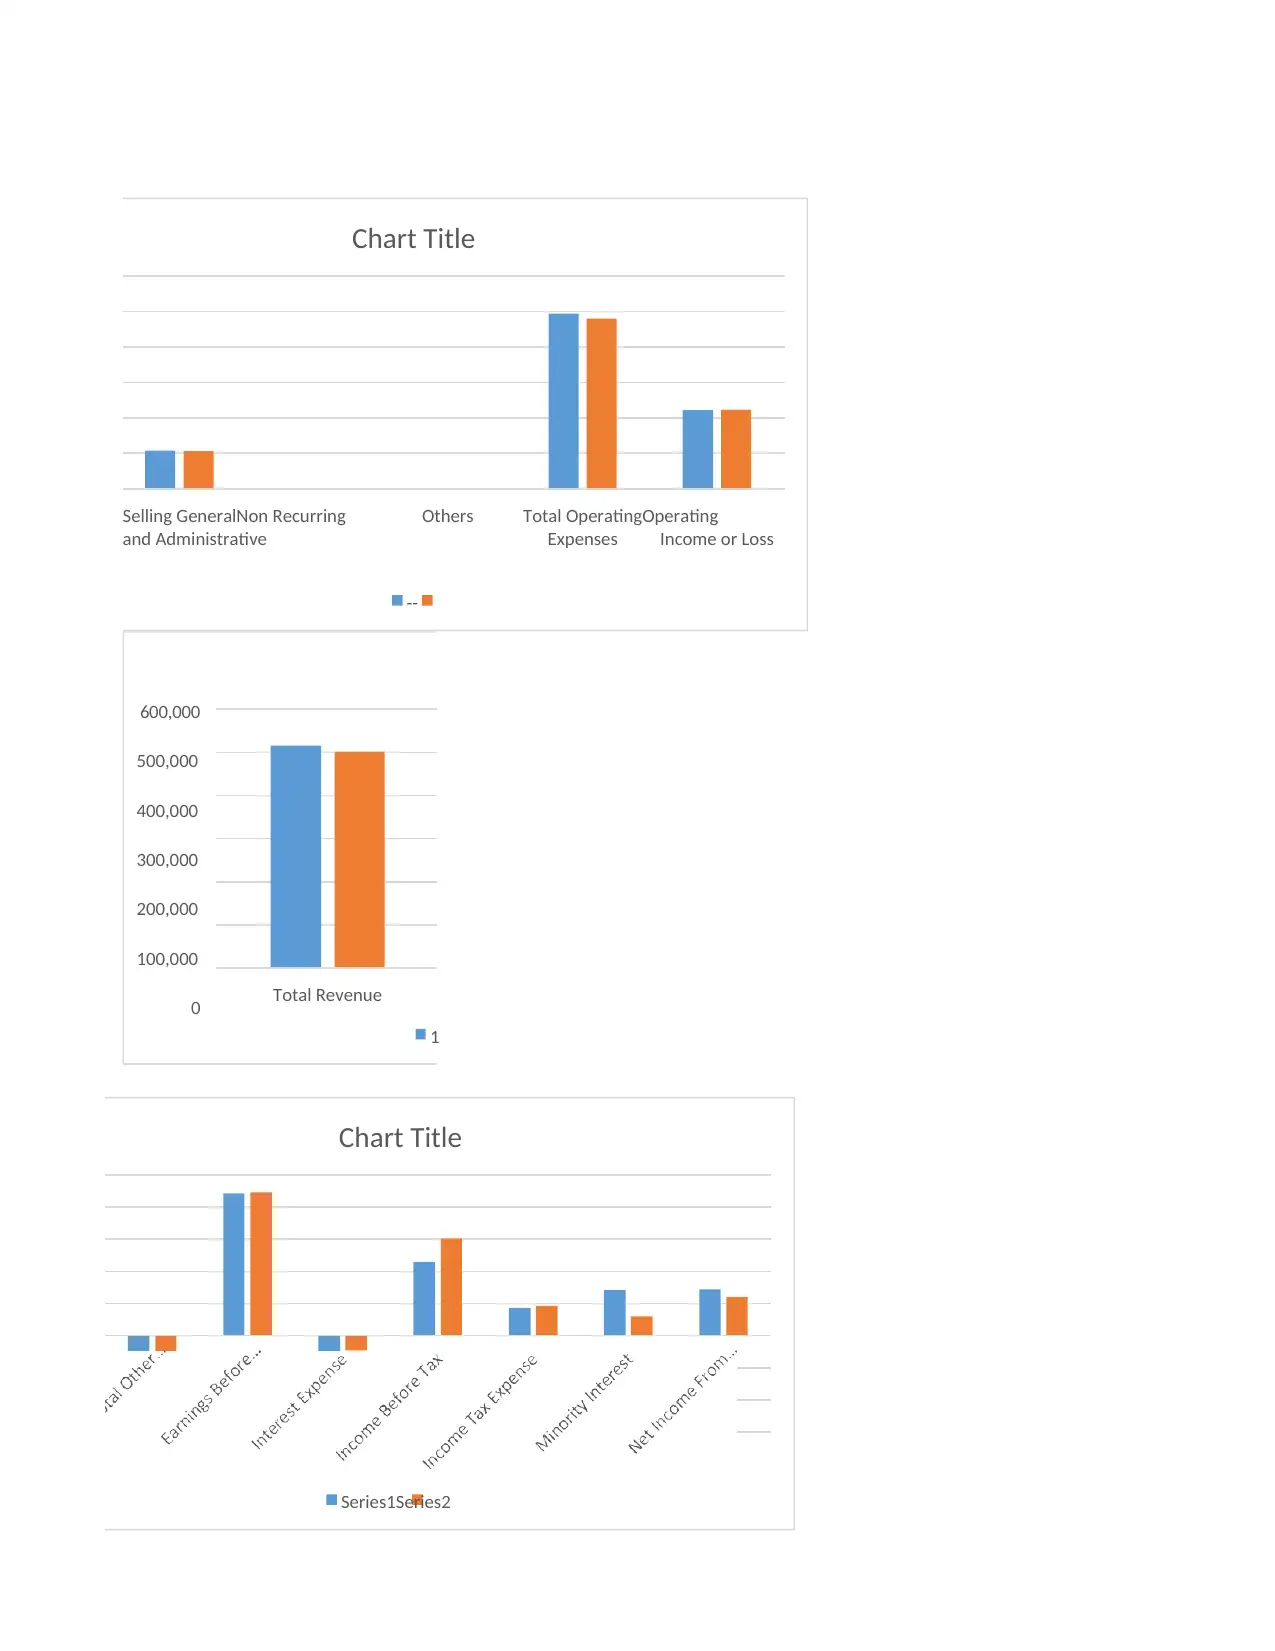
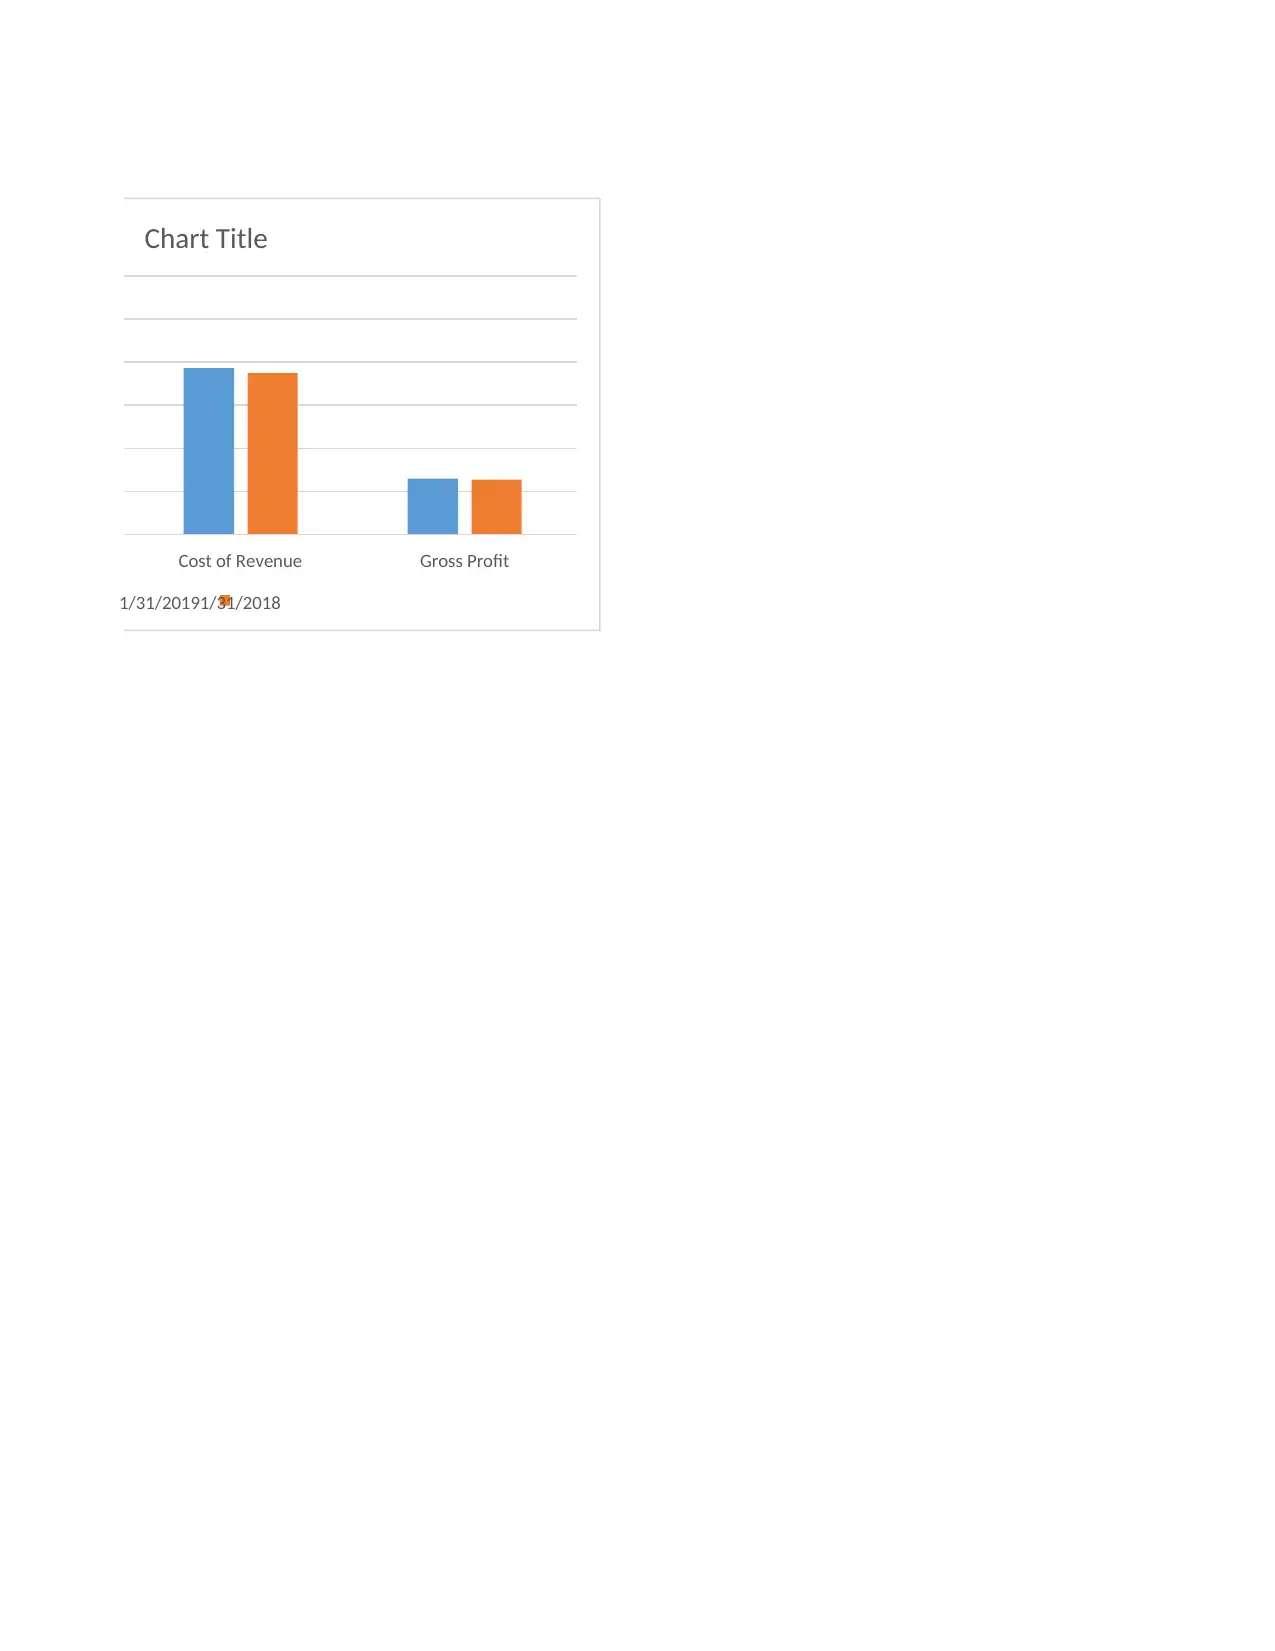
This assignment presents a comprehensive analysis of a business's financial and operational performance. It includes an examination of key performance indicators (KPIs) such as revenue, operating profit, and net income. The analysis involves reviewing financial statements, including income statements, balance sheets, and cash flow statements, to assess the company's financial health. The report also delves into various aspects of business operations, such as social media engagement, licensing, cultural differences, and legal barriers. Furthermore, it provides a comparative analysis of financial data from different periods, including 2018 and 2019, to identify trends and areas for improvement. The assignment also presents a series of charts and tables that visually represent the financial data and key metrics, facilitating an understanding of the company's performance. Overall, the assignment aims to provide a detailed assessment of the business's financial and operational status, highlighting strengths, weaknesses, and potential opportunities for growth.
Document Page
e
s 35
5

Licensing

Joint ventures
Reducing cultural differenc
Ye
No
Yes 28
No 12

Cultural
differenc
e
12

Legal
and
Regulator
y barriers
10

Foreign
governme
nt
considera
tion
10

Business
case
8

Increase
brand
recogniti
on and
trust
12

Enhance
customer
engagem
ent to
generate
high
revenue
18
tabler-icon-diamond-filled.svg

Paraphrase This Document

Need a fresh take? Get an instant paraphrase of this document with our AI Paraphraser
Document Page
15
13
Chart Title
Yes·No
12

Social
Media 14
You
Tube
Analytics
11

Google
Analytics 15
Yes 28
No 12
Document Page
Group sales (exc.
VAT, exc. fuel)(a)
£50,991m £49,867m
Fuel £6,500m £6,050m
Revenue (exc.
VAT, inc. fuel)
£57,491m £55,917m
Group operating profit
before exceptional
items(b)
£1,644m £1,280m
UK & ROI £1,053m £803m
Central Europe £119m £58m
Asia £299m £262m
Tesco Bank £173m £157m
Include
exceptional items
£193m £(263)m
Group operating
profit
£1,837m £1,017m
Group profit
before tax before
exceptional items,
IAS 19 finance
costs and IAS 39
fair value
remeasurements
£1,282m £781m
Group statutory
profit before tax
£1,298m £145m
Diluted EPS
before exceptional
items, IAS 19
finance costs and
IAS 39 fair value
remeasurements
11.88p 7.30p
Diluted EPS 12.08p 0.81p
Basic EPS 12.12p 0.81p
Dividend per share 3.0p
Capex(c) £1.1bn £1.2bn
Net debt(d)(e) £(2.6)bn £(3.7)bn
Cash generated from £2.8bn
retail operations(d)
Document Page
0.60% 2.30%
7.10% 7.40%
1.30% 2.80%
25.90% 28.40%
30.30% 31.10%
89.70% ######
7.60% 14.10%
10.20% 10.20%
76.60% 80.60%
64.10%
######
tabler-icon-diamond-filled.svg

Paraphrase This Document

Need a fresh take? Get an instant paraphrase of this document with our AI Paraphraser
Document Page
Particul
ar Amount Particul
ar Amount
Opening
stock 50,000 Closing
stock 42,000
Purchase
a/c 420,000 Sales a/c 557,000
Gross
Profit c/d 129,500
599,500 599,500
Expenses
Wages
33,300
Gross
Loss b/d 129,500
Less:
Prepaid
expenses:
200
33,100
Interest
receivabl
e
250
Mobile
Bills: 600 32,500
Add:
Accrued
receivabl
e: 100
Interest
payable 8000
Travel
expenses 550
Premises 5000
Fittings:
6400 11,400
Less:
Bad
debts:
500
Add bad
debts
allowanc
e: 200
700
Total
sum of
expenses
3,250
Net gain
c/d 65,600
129,750 129,750
Document Page
600,000
500,000
400,000
300,000
200,000
100,000
0
250,000
200,000
150,000
100,000
50,000
0
-50,000
-100,000
-150,000
Income
Statement
All numbers in thousands
Revenue 1/31/2019 1/31/2018
Total Revenue 514,400 500,340
Cost of Revenue 385,300 373,390
Gross Profit 129,104 126,947
Operating Expenses
Research
Development - -
Selling General and
Administrative 106,987 104,698
Non Recurring - -
Others - -
Total Operating
Expenses 492,288 478,094
Operating Income or
Loss 221,100 222,490
Income from Continuing Operations
Total Other
Income/Expenses Net -106,570 -71,260
Earnings Before
Interest and Taxes 221,170 222,490
Interest Expense -23,460 -23,300
Income Before Tax 114,600 151,230
Income Tax Expense 42,810 46,000
Minority Interest 71,300 29,500
Net Income From
Continuing Ops 71,790 60,523
Non-recurring Events
Discontinued
Operations - -
Extraordinary Items - -
Effect Of Accounting
Changes - -
Other Items - -
Net Income
Net Income 66,700 98,600
Preferred Stock And
Other Adjustments - -
Net Income
Applicable To
Common Shares
66,700 98,600
Document Page
Chart Title
Selling GeneralNon Recurring
and Administrative
Others Total OperatingOperating
Expenses Income or Loss
--
600,000
500,000
400,000
300,000
200,000
100,000
0 Total Revenue
1
Chart Title
Series1Series2
tabler-icon-diamond-filled.svg

Paraphrase This Document

Need a fresh take? Get an instant paraphrase of this document with our AI Paraphraser
Document Page
Chart Title
Cost of Revenue Gross Profit
1/31/20191/31/2018
chevron_up_icon
1 out of 8
circle_padding
hide_on_mobile
zoom_out_icon
[object Object]