Financial Performance Analysis of Gulf Stone Company SAOG (ECM05EKM)
VerifiedAdded on 2023/01/19
|21
|5218
|76
Report
AI Summary
This report presents a comprehensive financial analysis of Gulf Stone Company SAOG, a company listed on the Muscat Securities Market (MSM). The analysis begins with an evaluation of the company's financial performance over three years, utilizing horizontal and vertical analysis techniques on both the income statement and balance sheet to assess profitability and financial position. The report then delves into capital budgeting, applying the Internal Rate of Return (IRR) method to evaluate potential projects and provides recommendations based on literature reviews and non-financial factors. Finally, it conducts a cost-volume-profit (CVP) analysis to assess its role in business decision-making. The report incorporates literature reviews to support its findings and recommendations, offering a detailed examination of the company's financial health and potential investment strategies.
Page 1 of 21
Financial Analysis for Managers (ECM05EKM)
Financial Analysis for Managers (ECM05EKM)
Paraphrase This Document
Need a fresh take? Get an instant paraphrase of this document with our AI Paraphraser
Page 2 of 21
Contents
Introduction......................................................................................................................................3
Part 1: Evaluation of financial performance of a company listed in the Muscat Securities (MSM)
through using the trend analysis......................................................................................................4
Introduction..................................................................................................................................4
Task A: Comparative Income Statement and balance sheet for last 3 years through using
Horizontal and Vertical Analysis techniques...............................................................................4
A.1: Income Statement-Profitability Position..............................................................................4
A.1.1: Vertical Analysis of Income Statement............................................................................4
A.1.2: Horizontal Analysis of Income Statement........................................................................5
A.2: Balance sheet – financial position........................................................................................7
A.2.1: Vertical Analysis of Balance Sheet...................................................................................7
A.2.2: Horizontal Analysis of Balance Sheet..............................................................................9
Task B: Analysis and Literature Review...................................................................................12
B.1: Literature Review about Vertical and Horizontal Analysis...............................................12
B.2: Profitability Position..........................................................................................................12
B.3: Financial Position...............................................................................................................12
Summary....................................................................................................................................13
Part 2: Capital Budgeting...............................................................................................................14
Task A: Application of Internal Rate of Return in the given Scenario......................................14
Task B: Recommendations through using literature review......................................................15
B.1: Literature review of Internal Rate of Return......................................................................15
B.2: Recommendations based on calculations, LR and Non- financial factors.........................16
Task C: Analysis with literature review.....................................................................................16
C.1: Analysis based on Literature Review and other non-financial factors provided in the
scenario......................................................................................................................................16
C.2: Analysis based on literature review of other relevant non-financial factors......................17
Part 3: Cost-volume-profit analysis..............................................................................................18
Task A: Calculations..................................................................................................................18
Task B: Most Profitable Scenario..............................................................................................19
Task C: Evaluate the role of CVP analysis in taking business decisions..................................19
Page 3 of 21
References......................................................................................................................................20
References......................................................................................................................................20
⊘ This is a preview!⊘
Do you want full access?
Subscribe today to unlock all pages.
Trusted by 1+ million students worldwide
Page 4 of 21
Introduction
The present report has been developed for providing an understanding of the various
financial analytical and investment appraisal techniques that are used for developing an
understanding of the present as well as future growth prospects of a company. In this context, the
report has primarily carried out evaluation of the financial performance of a company listed in
the Muscat Securities Exchange (MSM). This is done by presenting a comparison of the income
statements and the balance sheet for 3 years with the use of horizontal and vertical analysis. This
is followed by analyzing the profitability and financial position of the selected company and
providing recommendations to improve its financial position. This is followed by presenting an
evaluation of the investment technique of Internal Rate of Return (IRR) for evaluating the
feasibility of projects planned to be undertaken by City Cinemas. Lastly, it has conducted a cost-
volume-profit analysis for presenting its usefulness in taking business decisions.
Paraphrase This Document
Need a fresh take? Get an instant paraphrase of this document with our AI Paraphraser
Page 5 of 21
Part 1: Evaluation of financial performance of a company listed in the Muscat Securities
(MSM) through using the trend analysis
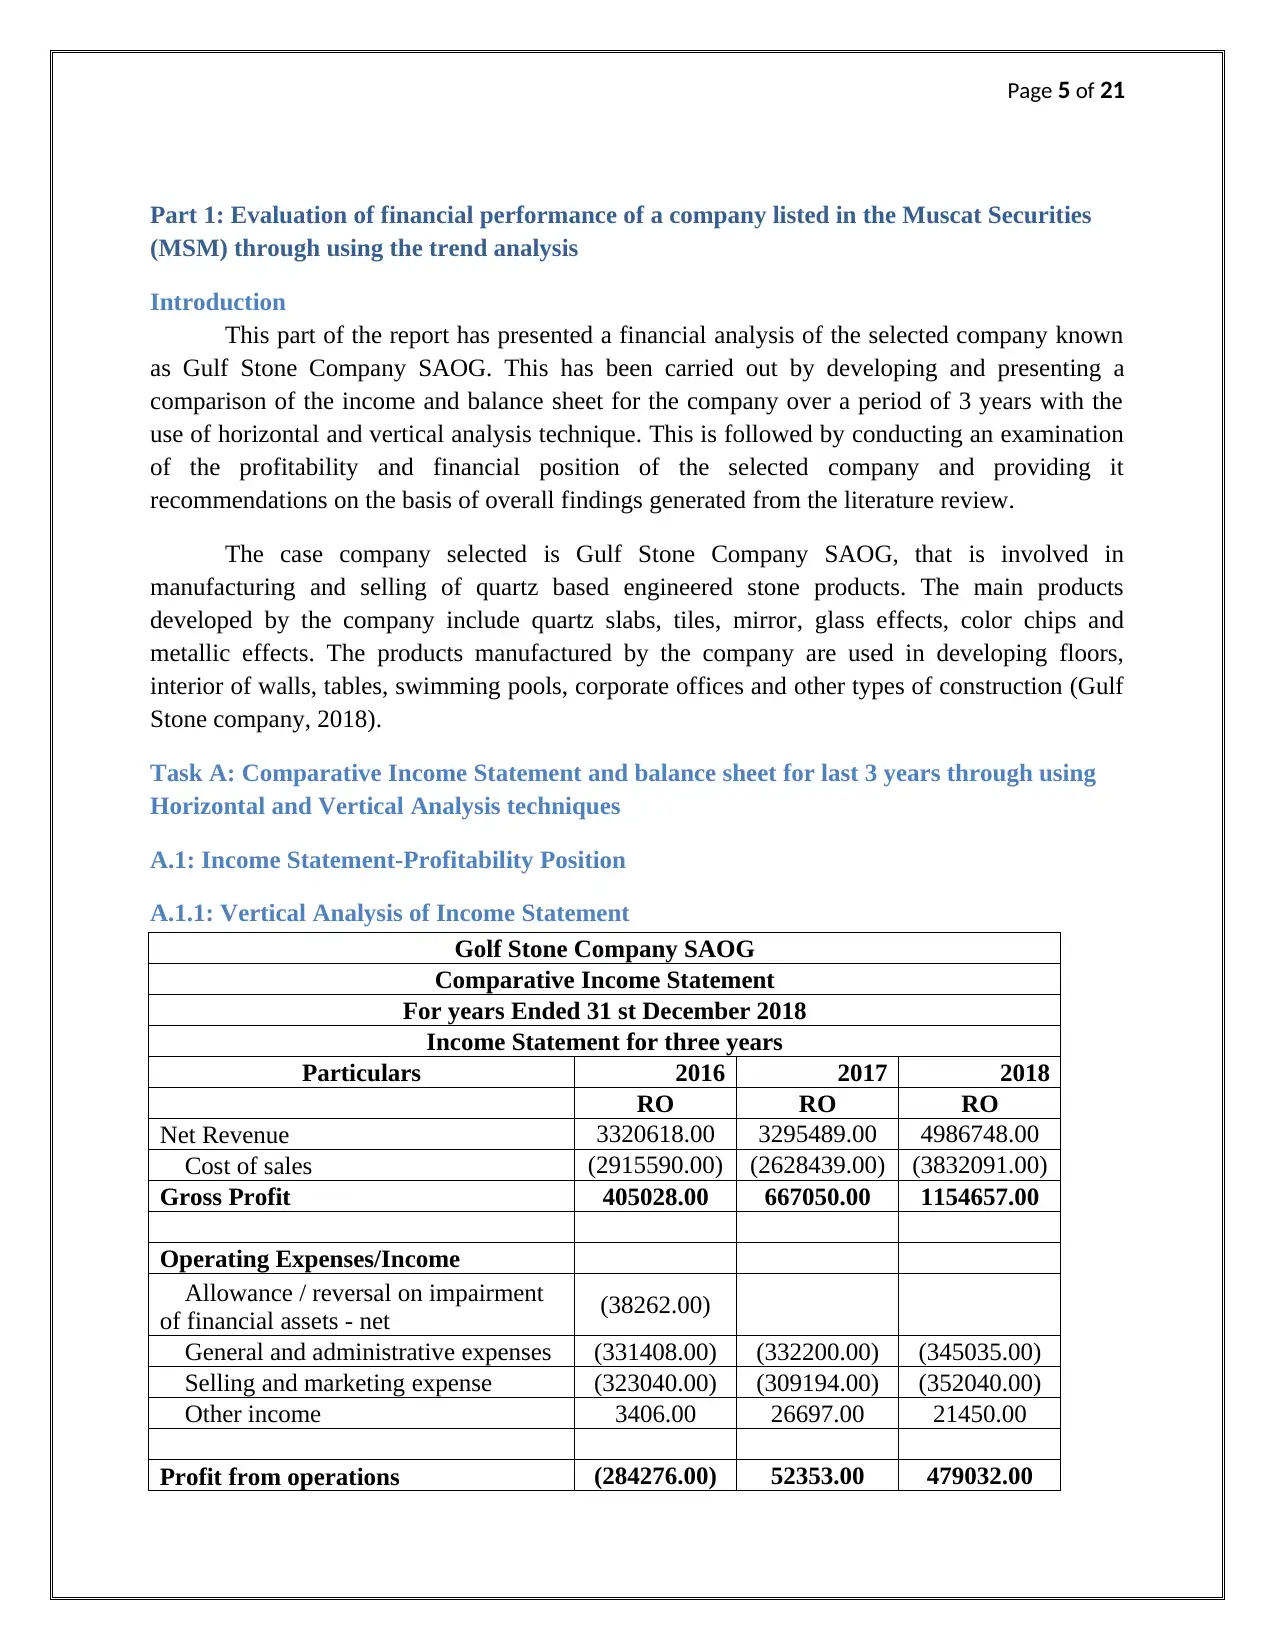
Introduction
This part of the report has presented a financial analysis of the selected company known
as Gulf Stone Company SAOG. This has been carried out by developing and presenting a
comparison of the income and balance sheet for the company over a period of 3 years with the
use of horizontal and vertical analysis technique. This is followed by conducting an examination
of the profitability and financial position of the selected company and providing it
recommendations on the basis of overall findings generated from the literature review.
The case company selected is Gulf Stone Company SAOG, that is involved in
manufacturing and selling of quartz based engineered stone products. The main products
developed by the company include quartz slabs, tiles, mirror, glass effects, color chips and
metallic effects. The products manufactured by the company are used in developing floors,
interior of walls, tables, swimming pools, corporate offices and other types of construction (Gulf
Stone company, 2018).
Task A: Comparative Income Statement and balance sheet for last 3 years through using
Horizontal and Vertical Analysis techniques
A.1: Income Statement-Profitability Position
A.1.1: Vertical Analysis of Income Statement
Golf Stone Company SAOG
Comparative Income Statement
For years Ended 31 st December 2018
Income Statement for three years
Particulars 2016 2017 2018
RO RO RO
Net Revenue 3320618.00 3295489.00 4986748.00
Cost of sales (2915590.00) (2628439.00) (3832091.00)
Gross Profit 405028.00 667050.00 1154657.00
Operating Expenses/Income
Allowance / reversal on impairment
of financial assets - net (38262.00)
General and administrative expenses (331408.00) (332200.00) (345035.00)
Selling and marketing expense (323040.00) (309194.00) (352040.00)
Other income 3406.00 26697.00 21450.00
Profit from operations (284276.00) 52353.00 479032.00
Part 1: Evaluation of financial performance of a company listed in the Muscat Securities
(MSM) through using the trend analysis
Introduction
This part of the report has presented a financial analysis of the selected company known
as Gulf Stone Company SAOG. This has been carried out by developing and presenting a
comparison of the income and balance sheet for the company over a period of 3 years with the
use of horizontal and vertical analysis technique. This is followed by conducting an examination
of the profitability and financial position of the selected company and providing it
recommendations on the basis of overall findings generated from the literature review.
The case company selected is Gulf Stone Company SAOG, that is involved in
manufacturing and selling of quartz based engineered stone products. The main products
developed by the company include quartz slabs, tiles, mirror, glass effects, color chips and
metallic effects. The products manufactured by the company are used in developing floors,
interior of walls, tables, swimming pools, corporate offices and other types of construction (Gulf
Stone company, 2018).
Task A: Comparative Income Statement and balance sheet for last 3 years through using
Horizontal and Vertical Analysis techniques
A.1: Income Statement-Profitability Position
A.1.1: Vertical Analysis of Income Statement
Golf Stone Company SAOG
Comparative Income Statement
For years Ended 31 st December 2018
Income Statement for three years
Particulars 2016 2017 2018
RO RO RO
Net Revenue 3320618.00 3295489.00 4986748.00
Cost of sales (2915590.00) (2628439.00) (3832091.00)
Gross Profit 405028.00 667050.00 1154657.00
Operating Expenses/Income
Allowance / reversal on impairment
of financial assets - net (38262.00)
General and administrative expenses (331408.00) (332200.00) (345035.00)
Selling and marketing expense (323040.00) (309194.00) (352040.00)
Other income 3406.00 26697.00 21450.00
Profit from operations (284276.00) 52353.00 479032.00
Page 6 of 21
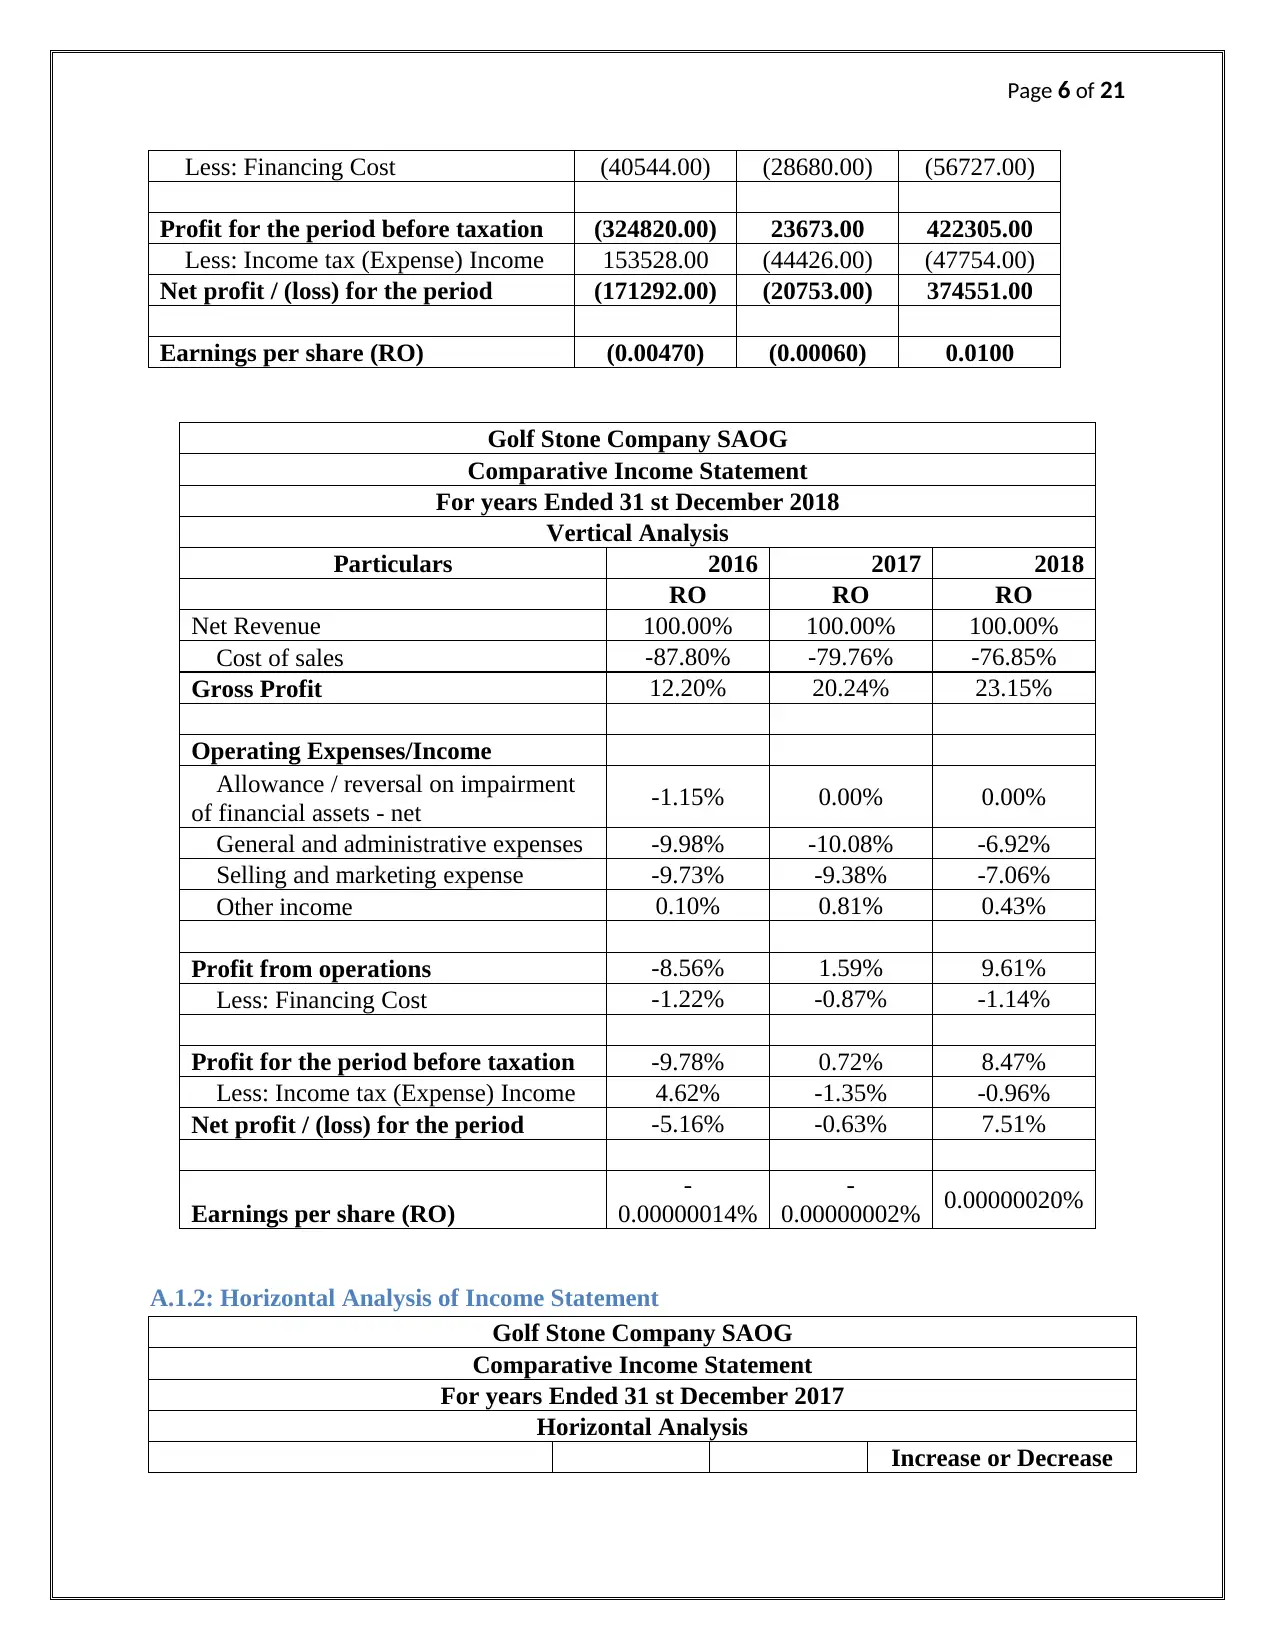
Less: Financing Cost (40544.00) (28680.00) (56727.00)
Profit for the period before taxation (324820.00) 23673.00 422305.00
Less: Income tax (Expense) Income 153528.00 (44426.00) (47754.00)
Net profit / (loss) for the period (171292.00) (20753.00) 374551.00
Earnings per share (RO) (0.00470) (0.00060) 0.0100
Golf Stone Company SAOG
Comparative Income Statement
For years Ended 31 st December 2018
Vertical Analysis
Particulars 2016 2017 2018
RO RO RO
Net Revenue 100.00% 100.00% 100.00%
Cost of sales -87.80% -79.76% -76.85%
Gross Profit 12.20% 20.24% 23.15%
Operating Expenses/Income
Allowance / reversal on impairment
of financial assets - net -1.15% 0.00% 0.00%
General and administrative expenses -9.98% -10.08% -6.92%
Selling and marketing expense -9.73% -9.38% -7.06%
Other income 0.10% 0.81% 0.43%
Profit from operations -8.56% 1.59% 9.61%
Less: Financing Cost -1.22% -0.87% -1.14%
Profit for the period before taxation -9.78% 0.72% 8.47%
Less: Income tax (Expense) Income 4.62% -1.35% -0.96%
Net profit / (loss) for the period -5.16% -0.63% 7.51%
Earnings per share (RO)
-
0.00000014%
-
0.00000002% 0.00000020%
A.1.2: Horizontal Analysis of Income Statement
Golf Stone Company SAOG
Comparative Income Statement
For years Ended 31 st December 2017
Horizontal Analysis
Increase or Decrease
⊘ This is a preview!⊘
Do you want full access?
Subscribe today to unlock all pages.
Trusted by 1+ million students worldwide
Page 7 of 21
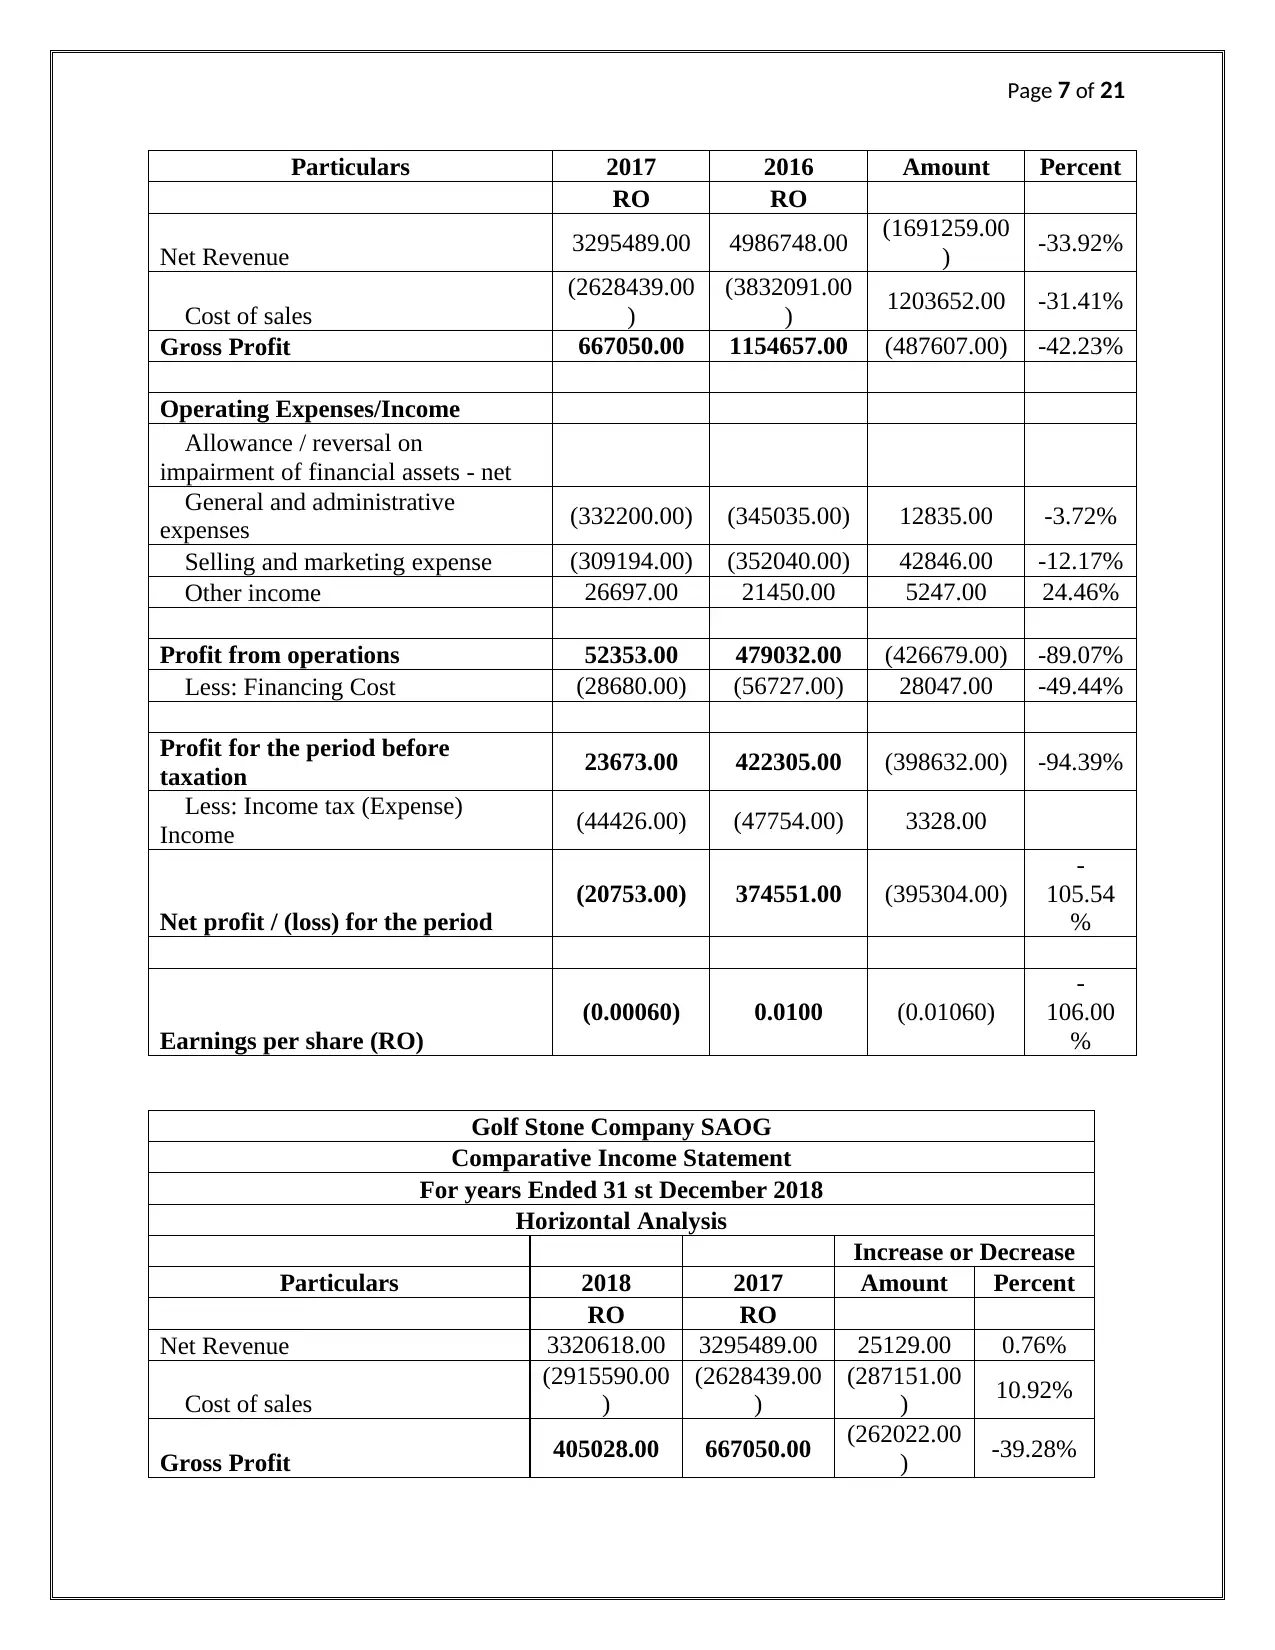
Particulars 2017 2016 Amount Percent
RO RO
Net Revenue 3295489.00 4986748.00 (1691259.00
) -33.92%
Cost of sales
(2628439.00
)
(3832091.00
) 1203652.00 -31.41%
Gross Profit 667050.00 1154657.00 (487607.00) -42.23%
Operating Expenses/Income
Allowance / reversal on
impairment of financial assets - net
General and administrative
expenses (332200.00) (345035.00) 12835.00 -3.72%
Selling and marketing expense (309194.00) (352040.00) 42846.00 -12.17%
Other income 26697.00 21450.00 5247.00 24.46%
Profit from operations 52353.00 479032.00 (426679.00) -89.07%
Less: Financing Cost (28680.00) (56727.00) 28047.00 -49.44%
Profit for the period before
taxation 23673.00 422305.00 (398632.00) -94.39%
Less: Income tax (Expense)
Income (44426.00) (47754.00) 3328.00
Net profit / (loss) for the period
(20753.00) 374551.00 (395304.00)
-
105.54
%
Earnings per share (RO)
(0.00060) 0.0100 (0.01060)
-
106.00
%
Golf Stone Company SAOG
Comparative Income Statement
For years Ended 31 st December 2018
Horizontal Analysis
Increase or Decrease
Particulars 2018 2017 Amount Percent
RO RO
Net Revenue 3320618.00 3295489.00 25129.00 0.76%
Cost of sales
(2915590.00
)
(2628439.00
)
(287151.00
) 10.92%
Gross Profit 405028.00 667050.00 (262022.00
) -39.28%
Paraphrase This Document
Need a fresh take? Get an instant paraphrase of this document with our AI Paraphraser
Page 8 of 21
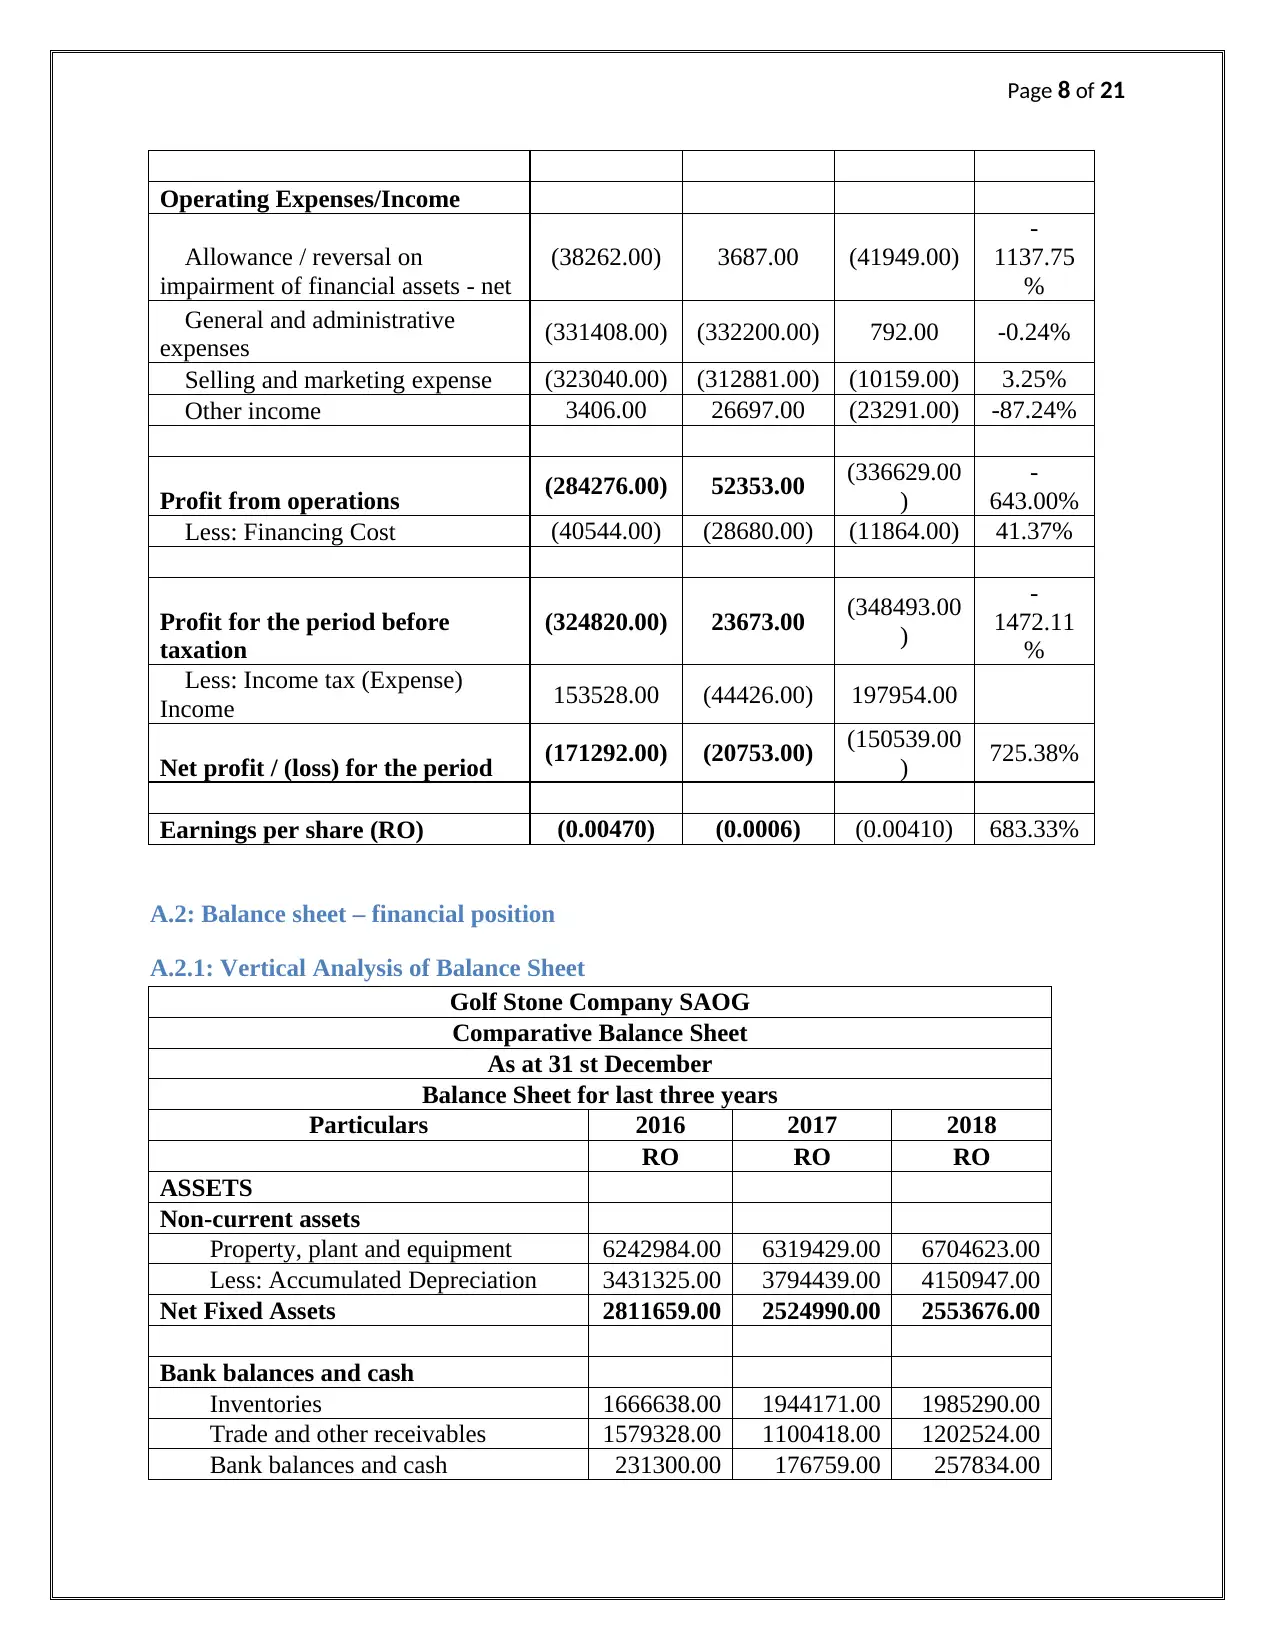
Operating Expenses/Income
Allowance / reversal on
impairment of financial assets - net
(38262.00) 3687.00 (41949.00)
-
1137.75
%
General and administrative
expenses (331408.00) (332200.00) 792.00 -0.24%
Selling and marketing expense (323040.00) (312881.00) (10159.00) 3.25%
Other income 3406.00 26697.00 (23291.00) -87.24%
Profit from operations (284276.00) 52353.00 (336629.00
)
-
643.00%
Less: Financing Cost (40544.00) (28680.00) (11864.00) 41.37%
Profit for the period before
taxation
(324820.00) 23673.00 (348493.00
)
-
1472.11
%
Less: Income tax (Expense)
Income 153528.00 (44426.00) 197954.00
Net profit / (loss) for the period (171292.00) (20753.00) (150539.00
) 725.38%
Earnings per share (RO) (0.00470) (0.0006) (0.00410) 683.33%
A.2: Balance sheet – financial position
A.2.1: Vertical Analysis of Balance Sheet
Golf Stone Company SAOG
Comparative Balance Sheet
As at 31 st December
Balance Sheet for last three years
Particulars 2016 2017 2018
RO RO RO
ASSETS
Non-current assets
Property, plant and equipment 6242984.00 6319429.00 6704623.00
Less: Accumulated Depreciation 3431325.00 3794439.00 4150947.00
Net Fixed Assets 2811659.00 2524990.00 2553676.00
Bank balances and cash
Inventories 1666638.00 1944171.00 1985290.00
Trade and other receivables 1579328.00 1100418.00 1202524.00
Bank balances and cash 231300.00 176759.00 257834.00
Page 9 of 21
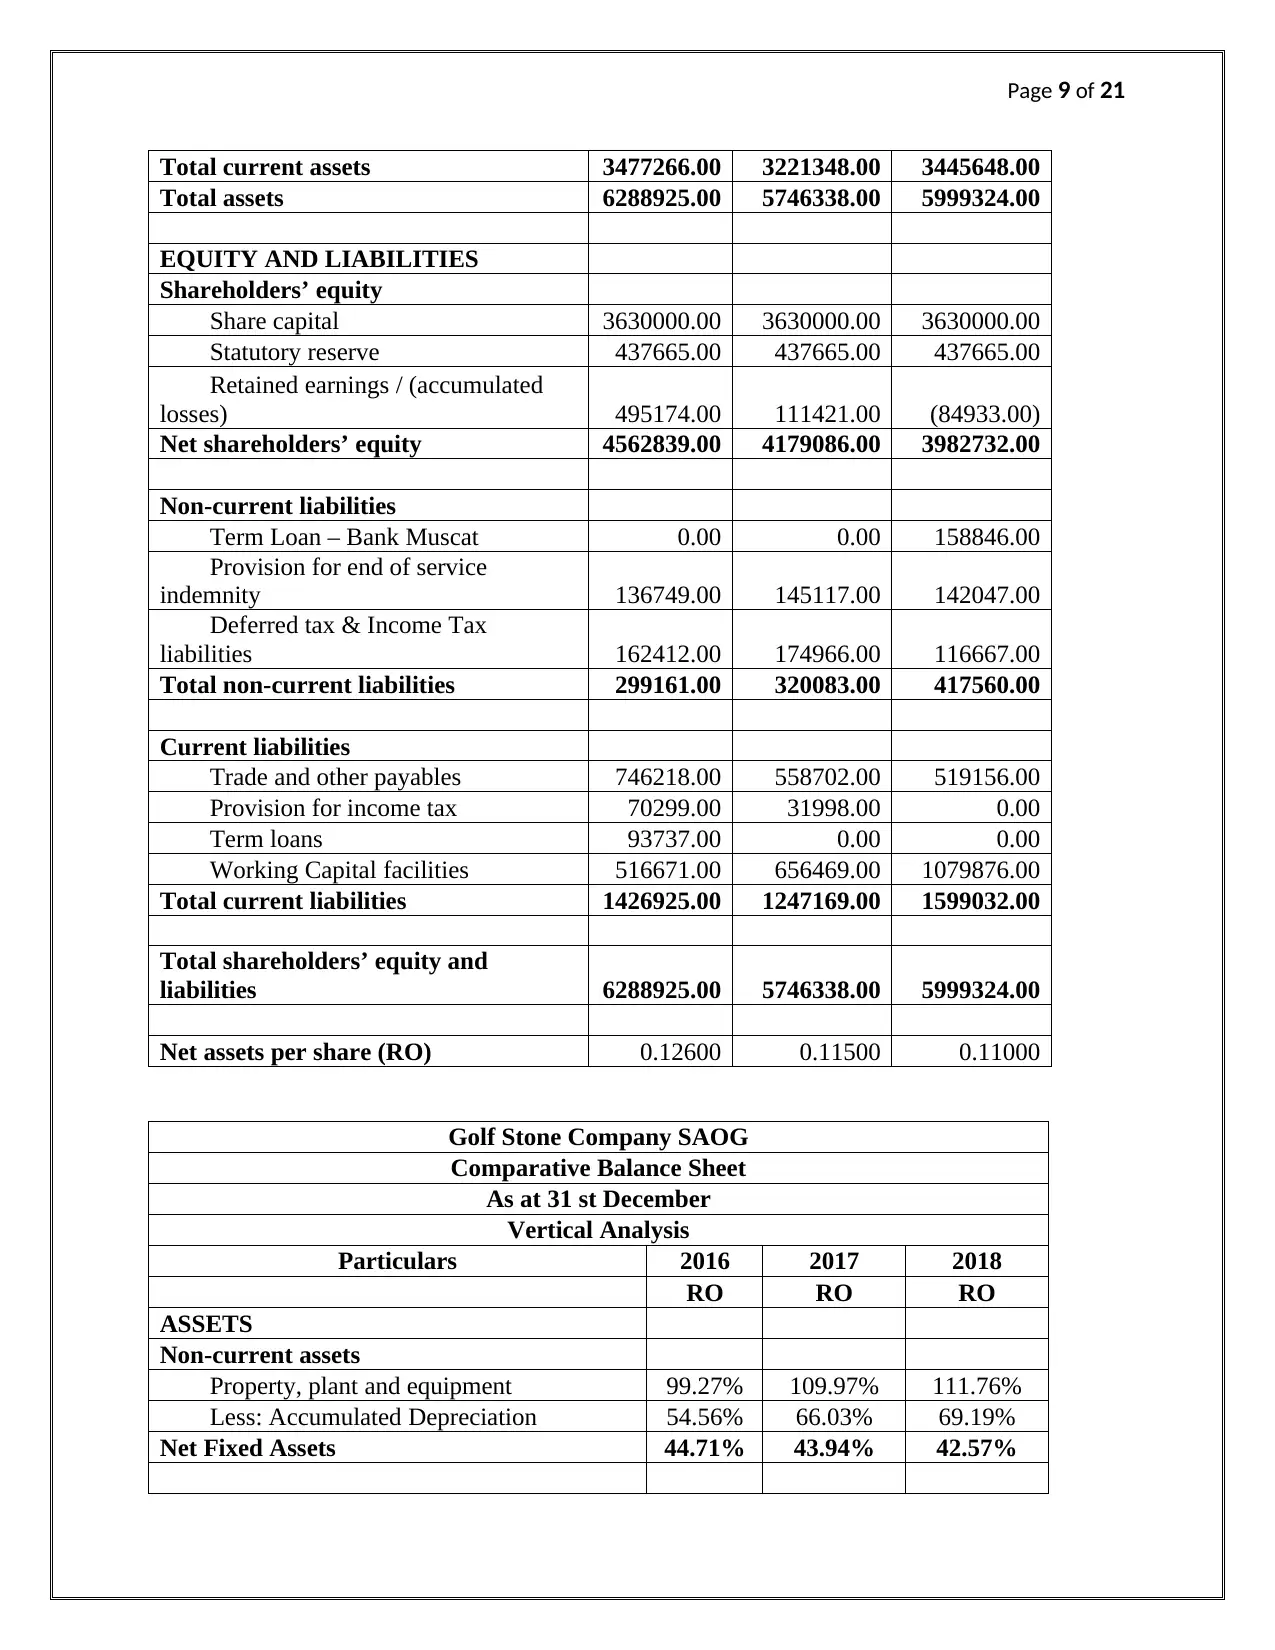
Total current assets 3477266.00 3221348.00 3445648.00
Total assets 6288925.00 5746338.00 5999324.00
EQUITY AND LIABILITIES
Shareholders’ equity
Share capital 3630000.00 3630000.00 3630000.00
Statutory reserve 437665.00 437665.00 437665.00
Retained earnings / (accumulated
losses) 495174.00 111421.00 (84933.00)
Net shareholders’ equity 4562839.00 4179086.00 3982732.00
Non-current liabilities
Term Loan – Bank Muscat 0.00 0.00 158846.00
Provision for end of service
indemnity 136749.00 145117.00 142047.00
Deferred tax & Income Tax
liabilities 162412.00 174966.00 116667.00
Total non-current liabilities 299161.00 320083.00 417560.00
Current liabilities
Trade and other payables 746218.00 558702.00 519156.00
Provision for income tax 70299.00 31998.00 0.00
Term loans 93737.00 0.00 0.00
Working Capital facilities 516671.00 656469.00 1079876.00
Total current liabilities 1426925.00 1247169.00 1599032.00
Total shareholders’ equity and
liabilities 6288925.00 5746338.00 5999324.00
Net assets per share (RO) 0.12600 0.11500 0.11000
Golf Stone Company SAOG
Comparative Balance Sheet
As at 31 st December
Vertical Analysis
Particulars 2016 2017 2018
RO RO RO
ASSETS
Non-current assets
Property, plant and equipment 99.27% 109.97% 111.76%
Less: Accumulated Depreciation 54.56% 66.03% 69.19%
Net Fixed Assets 44.71% 43.94% 42.57%
⊘ This is a preview!⊘
Do you want full access?
Subscribe today to unlock all pages.
Trusted by 1+ million students worldwide
Page 10 of 21
Bank balances and cash
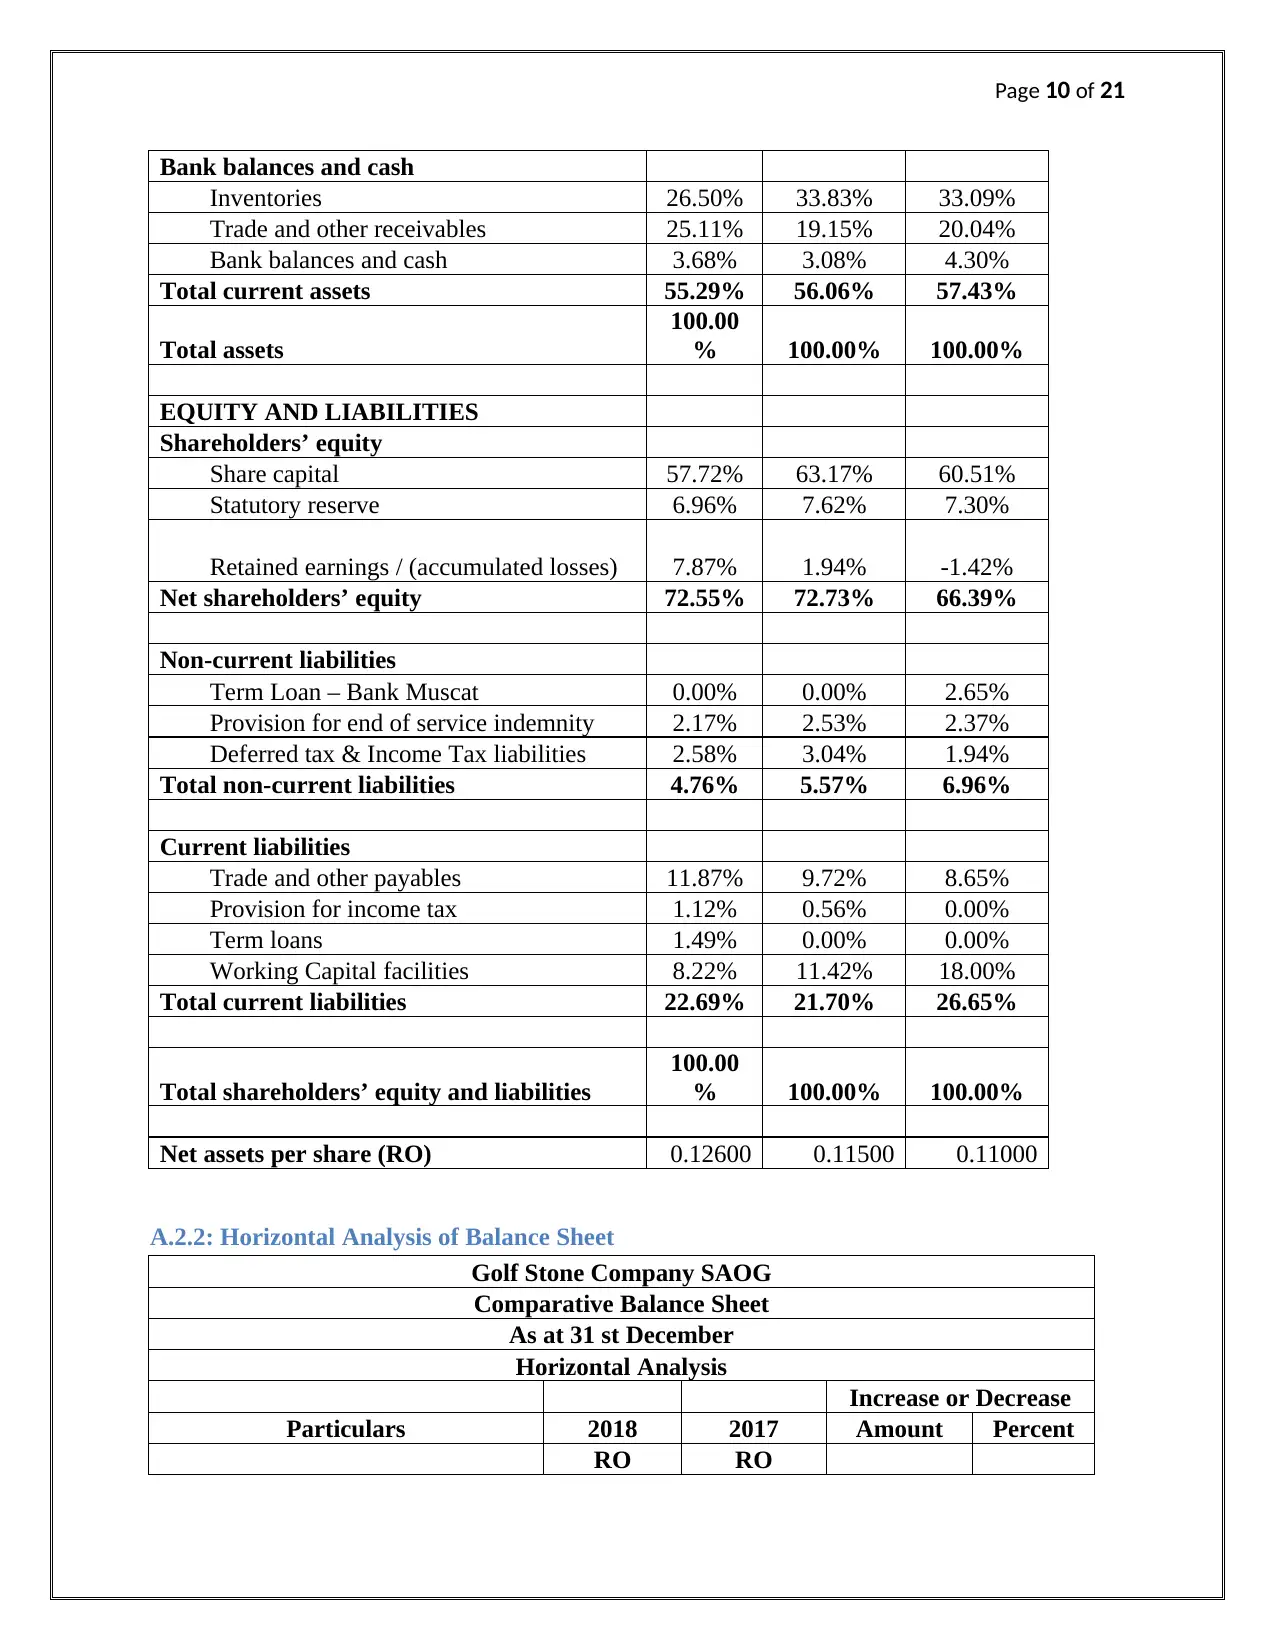
Inventories 26.50% 33.83% 33.09%
Trade and other receivables 25.11% 19.15% 20.04%
Bank balances and cash 3.68% 3.08% 4.30%
Total current assets 55.29% 56.06% 57.43%
Total assets
100.00
% 100.00% 100.00%
EQUITY AND LIABILITIES
Shareholders’ equity
Share capital 57.72% 63.17% 60.51%
Statutory reserve 6.96% 7.62% 7.30%
Retained earnings / (accumulated losses) 7.87% 1.94% -1.42%
Net shareholders’ equity 72.55% 72.73% 66.39%
Non-current liabilities
Term Loan – Bank Muscat 0.00% 0.00% 2.65%
Provision for end of service indemnity 2.17% 2.53% 2.37%
Deferred tax & Income Tax liabilities 2.58% 3.04% 1.94%
Total non-current liabilities 4.76% 5.57% 6.96%
Current liabilities
Trade and other payables 11.87% 9.72% 8.65%
Provision for income tax 1.12% 0.56% 0.00%
Term loans 1.49% 0.00% 0.00%
Working Capital facilities 8.22% 11.42% 18.00%
Total current liabilities 22.69% 21.70% 26.65%
Total shareholders’ equity and liabilities
100.00
% 100.00% 100.00%
Net assets per share (RO) 0.12600 0.11500 0.11000
A.2.2: Horizontal Analysis of Balance Sheet
Golf Stone Company SAOG
Comparative Balance Sheet
As at 31 st December
Horizontal Analysis
Increase or Decrease
Particulars 2018 2017 Amount Percent
RO RO
Bank balances and cash
Inventories 26.50% 33.83% 33.09%
Trade and other receivables 25.11% 19.15% 20.04%
Bank balances and cash 3.68% 3.08% 4.30%
Total current assets 55.29% 56.06% 57.43%
Total assets
100.00
% 100.00% 100.00%
EQUITY AND LIABILITIES
Shareholders’ equity
Share capital 57.72% 63.17% 60.51%
Statutory reserve 6.96% 7.62% 7.30%
Retained earnings / (accumulated losses) 7.87% 1.94% -1.42%
Net shareholders’ equity 72.55% 72.73% 66.39%
Non-current liabilities
Term Loan – Bank Muscat 0.00% 0.00% 2.65%
Provision for end of service indemnity 2.17% 2.53% 2.37%
Deferred tax & Income Tax liabilities 2.58% 3.04% 1.94%
Total non-current liabilities 4.76% 5.57% 6.96%
Current liabilities
Trade and other payables 11.87% 9.72% 8.65%
Provision for income tax 1.12% 0.56% 0.00%
Term loans 1.49% 0.00% 0.00%
Working Capital facilities 8.22% 11.42% 18.00%
Total current liabilities 22.69% 21.70% 26.65%
Total shareholders’ equity and liabilities
100.00
% 100.00% 100.00%
Net assets per share (RO) 0.12600 0.11500 0.11000
A.2.2: Horizontal Analysis of Balance Sheet
Golf Stone Company SAOG
Comparative Balance Sheet
As at 31 st December
Horizontal Analysis
Increase or Decrease
Particulars 2018 2017 Amount Percent
RO RO
Paraphrase This Document
Need a fresh take? Get an instant paraphrase of this document with our AI Paraphraser
Page 11 of 21
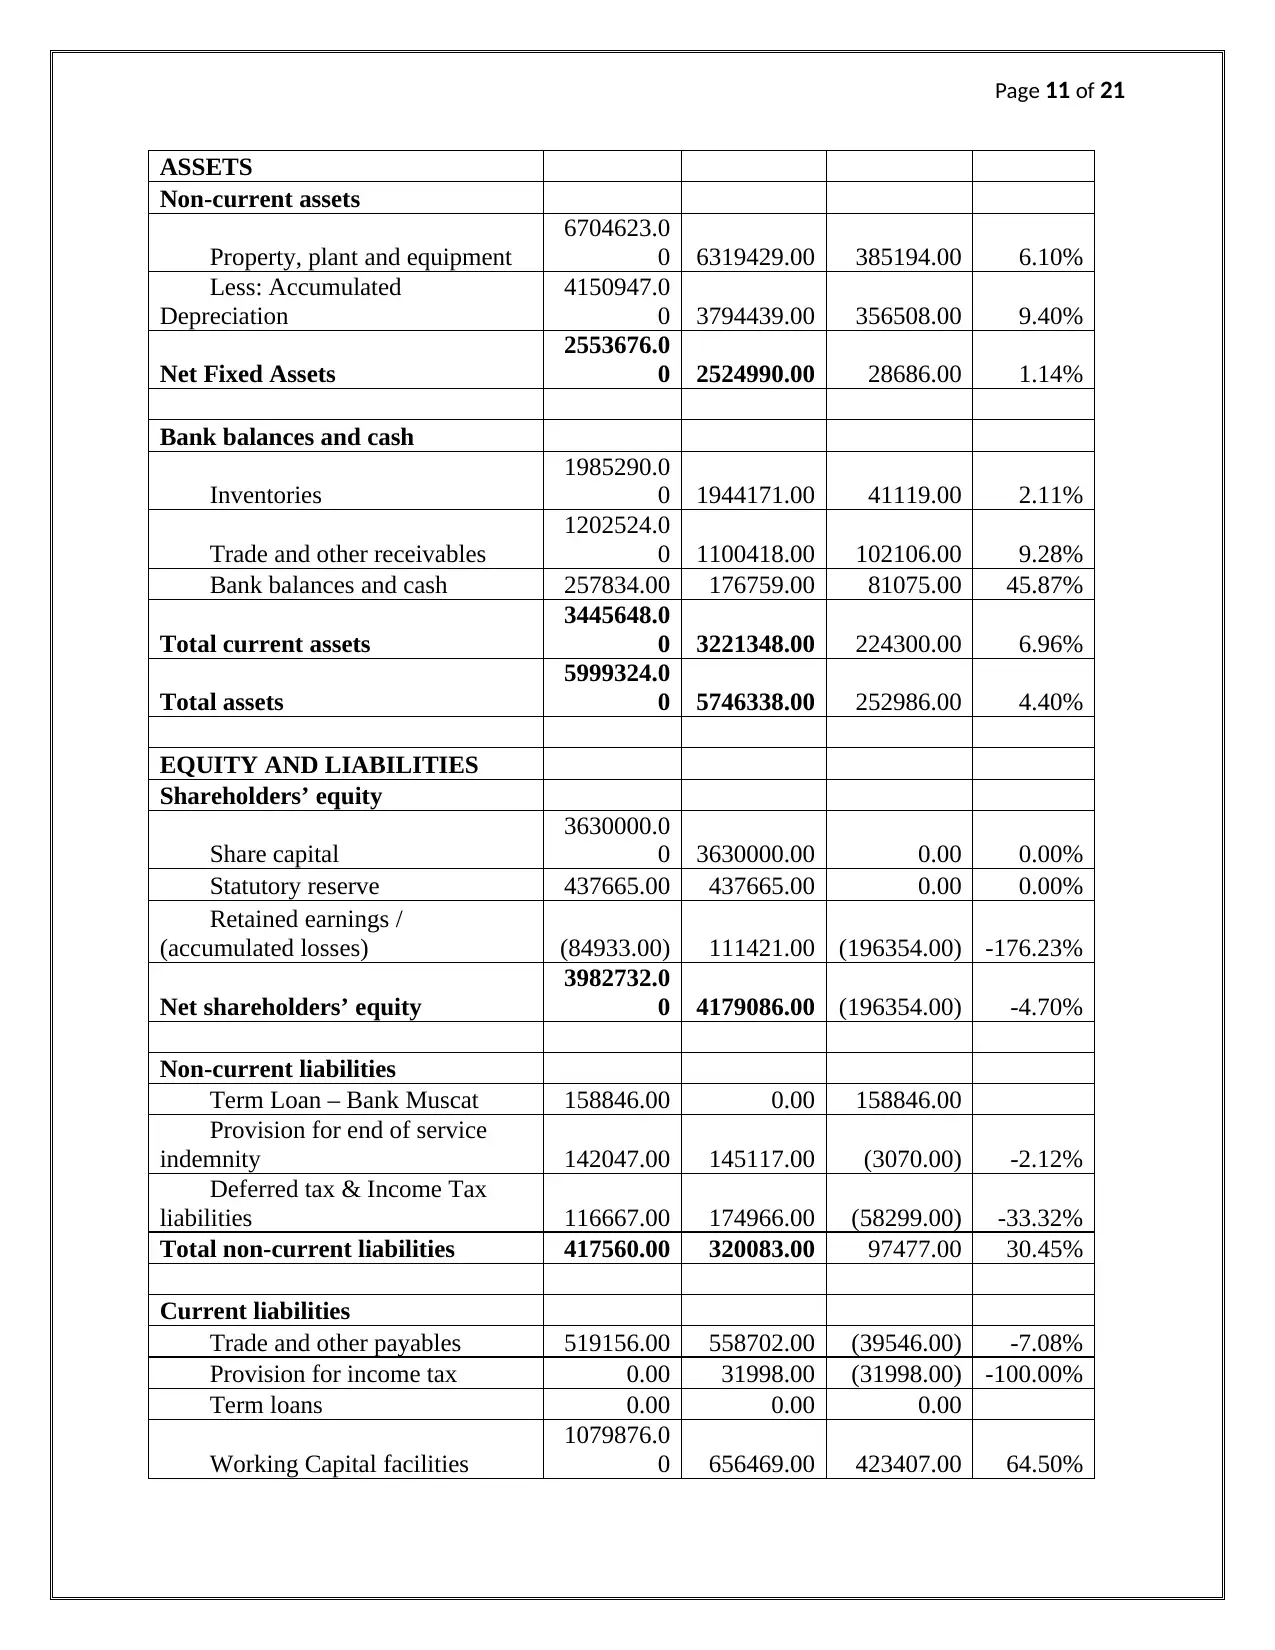
ASSETS
Non-current assets
Property, plant and equipment
6704623.0
0 6319429.00 385194.00 6.10%
Less: Accumulated
Depreciation
4150947.0
0 3794439.00 356508.00 9.40%
Net Fixed Assets
2553676.0
0 2524990.00 28686.00 1.14%
Bank balances and cash
Inventories
1985290.0
0 1944171.00 41119.00 2.11%
Trade and other receivables
1202524.0
0 1100418.00 102106.00 9.28%
Bank balances and cash 257834.00 176759.00 81075.00 45.87%
Total current assets
3445648.0
0 3221348.00 224300.00 6.96%
Total assets
5999324.0
0 5746338.00 252986.00 4.40%
EQUITY AND LIABILITIES
Shareholders’ equity
Share capital
3630000.0
0 3630000.00 0.00 0.00%
Statutory reserve 437665.00 437665.00 0.00 0.00%
Retained earnings /
(accumulated losses) (84933.00) 111421.00 (196354.00) -176.23%
Net shareholders’ equity
3982732.0
0 4179086.00 (196354.00) -4.70%
Non-current liabilities
Term Loan – Bank Muscat 158846.00 0.00 158846.00
Provision for end of service
indemnity 142047.00 145117.00 (3070.00) -2.12%
Deferred tax & Income Tax
liabilities 116667.00 174966.00 (58299.00) -33.32%
Total non-current liabilities 417560.00 320083.00 97477.00 30.45%
Current liabilities
Trade and other payables 519156.00 558702.00 (39546.00) -7.08%
Provision for income tax 0.00 31998.00 (31998.00) -100.00%
Term loans 0.00 0.00 0.00
Working Capital facilities
1079876.0
0 656469.00 423407.00 64.50%
Page 12 of 21
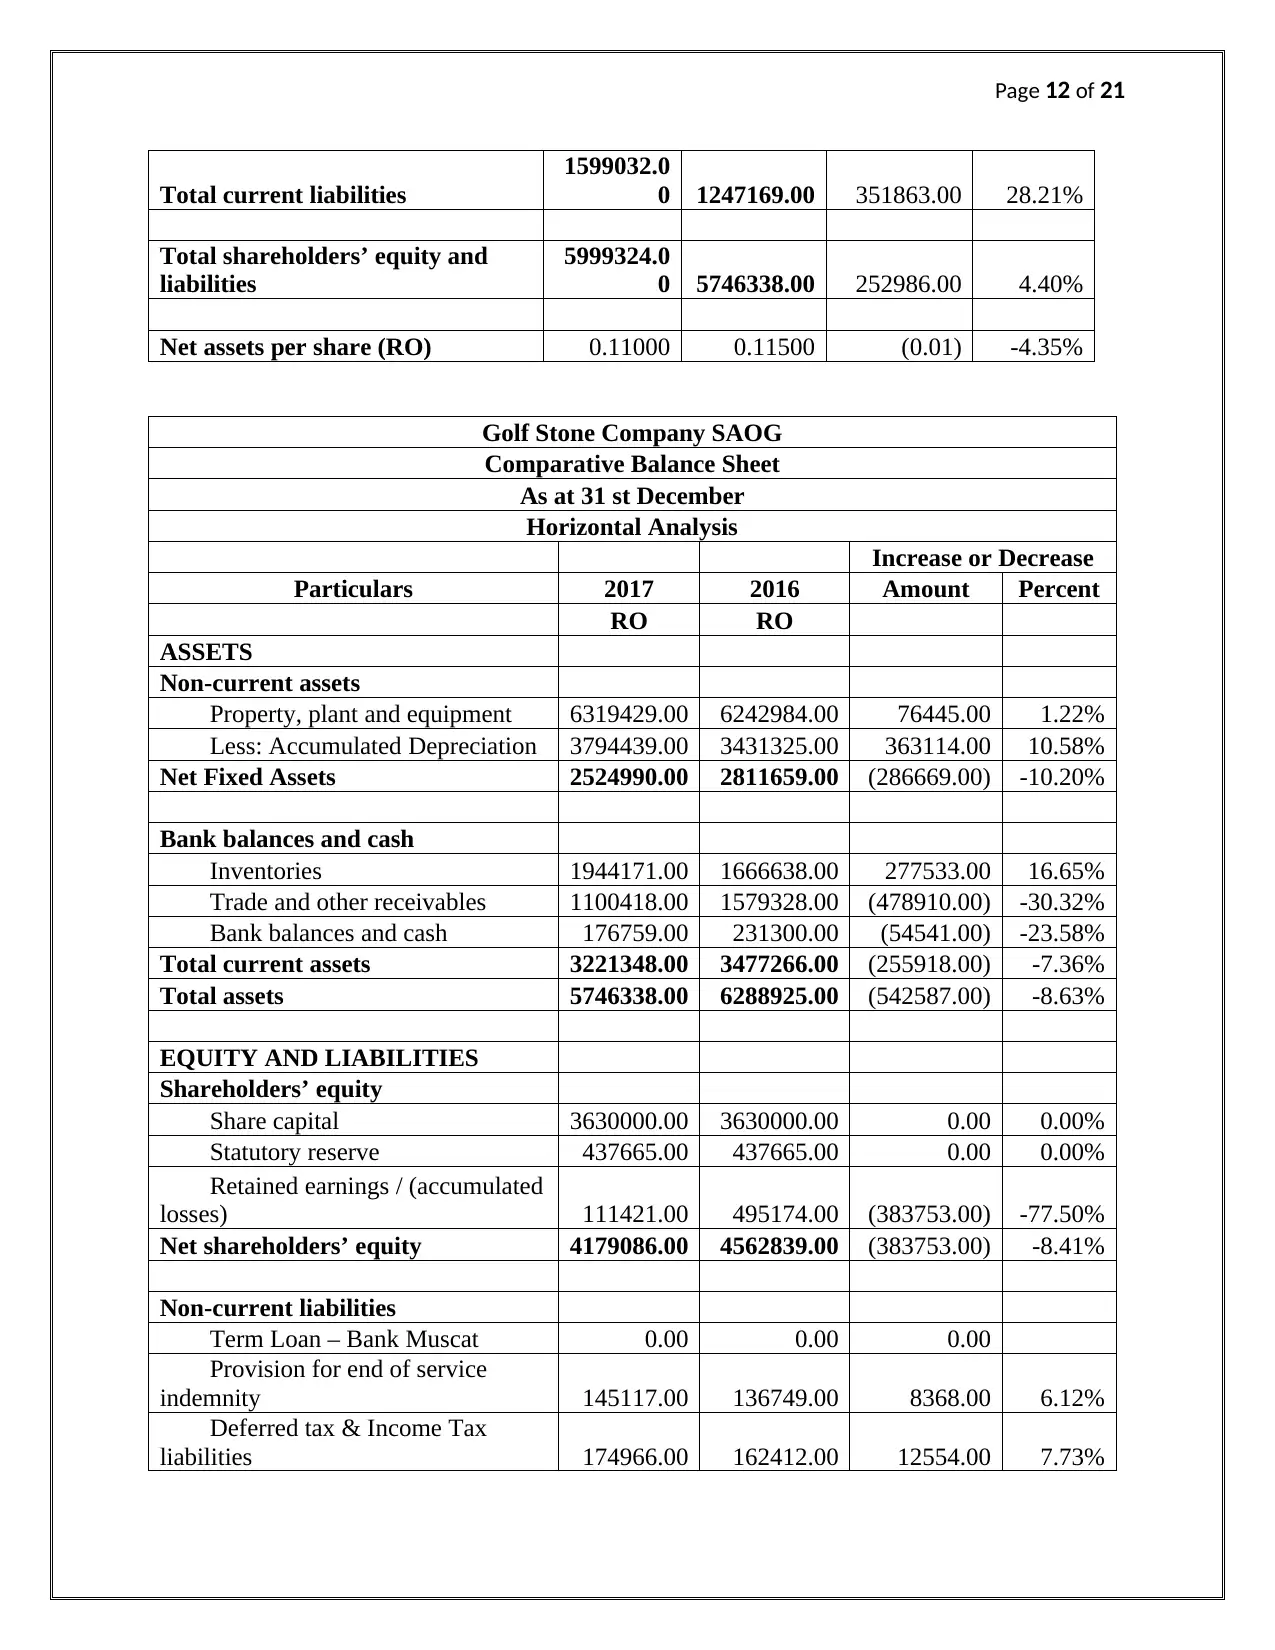
Total current liabilities
1599032.0
0 1247169.00 351863.00 28.21%
Total shareholders’ equity and
liabilities
5999324.0
0 5746338.00 252986.00 4.40%
Net assets per share (RO) 0.11000 0.11500 (0.01) -4.35%
Golf Stone Company SAOG
Comparative Balance Sheet
As at 31 st December
Horizontal Analysis
Increase or Decrease
Particulars 2017 2016 Amount Percent
RO RO
ASSETS
Non-current assets
Property, plant and equipment 6319429.00 6242984.00 76445.00 1.22%
Less: Accumulated Depreciation 3794439.00 3431325.00 363114.00 10.58%
Net Fixed Assets 2524990.00 2811659.00 (286669.00) -10.20%
Bank balances and cash
Inventories 1944171.00 1666638.00 277533.00 16.65%
Trade and other receivables 1100418.00 1579328.00 (478910.00) -30.32%
Bank balances and cash 176759.00 231300.00 (54541.00) -23.58%
Total current assets 3221348.00 3477266.00 (255918.00) -7.36%
Total assets 5746338.00 6288925.00 (542587.00) -8.63%
EQUITY AND LIABILITIES
Shareholders’ equity
Share capital 3630000.00 3630000.00 0.00 0.00%
Statutory reserve 437665.00 437665.00 0.00 0.00%
Retained earnings / (accumulated
losses) 111421.00 495174.00 (383753.00) -77.50%
Net shareholders’ equity 4179086.00 4562839.00 (383753.00) -8.41%
Non-current liabilities
Term Loan – Bank Muscat 0.00 0.00 0.00
Provision for end of service
indemnity 145117.00 136749.00 8368.00 6.12%
Deferred tax & Income Tax
liabilities 174966.00 162412.00 12554.00 7.73%
⊘ This is a preview!⊘
Do you want full access?
Subscribe today to unlock all pages.
Trusted by 1+ million students worldwide
1 out of 21
Related Documents


Your All-in-One AI-Powered Toolkit for Academic Success.
+13062052269
info@desklib.com
Available 24*7 on WhatsApp / Email
![[object Object]](/_next/static/media/star-bottom.7253800d.svg)
Unlock your academic potential
Copyright © 2020–2026 A2Z Services. All Rights Reserved. Developed and managed by ZUCOL.