Managerial Finance: Analysis of Financial Performance and Investment

Verified

Added on  2022/12/30

|20
|3756
|57
Report
AI Summary
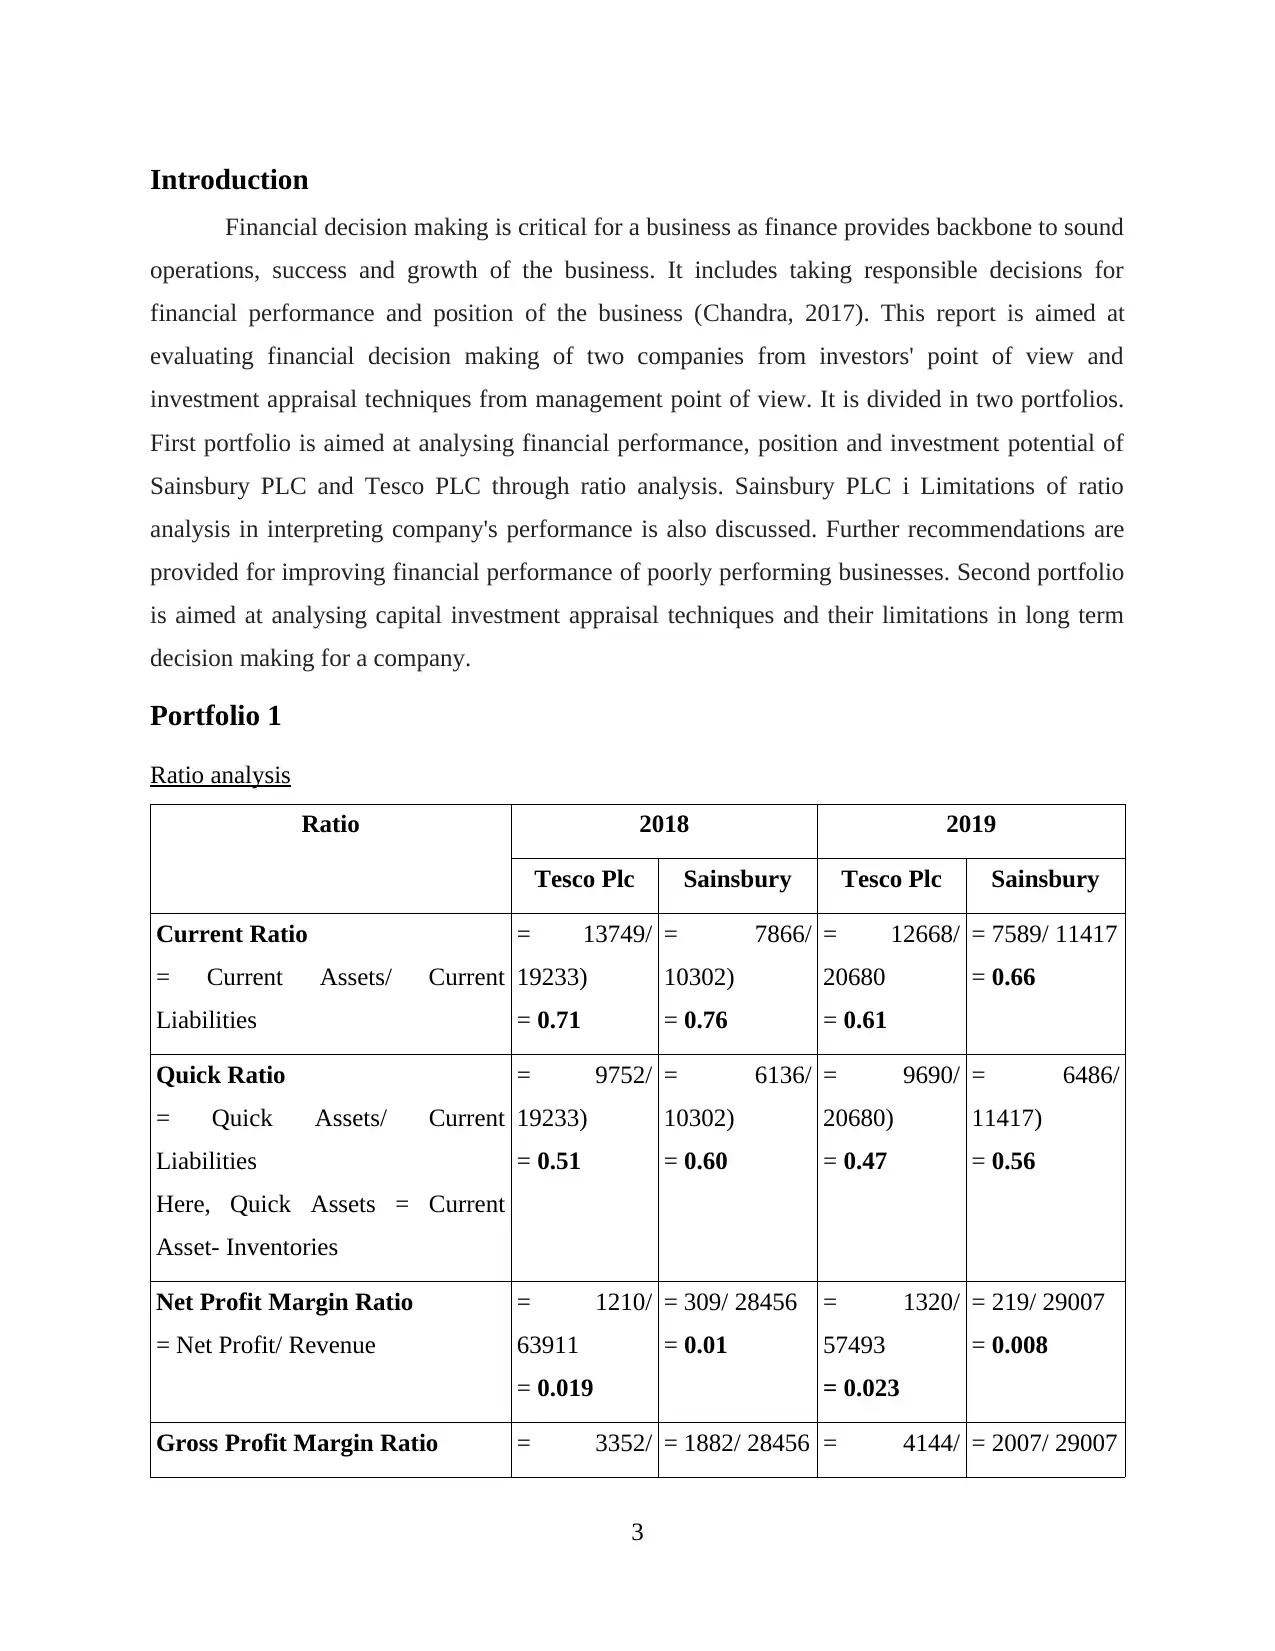
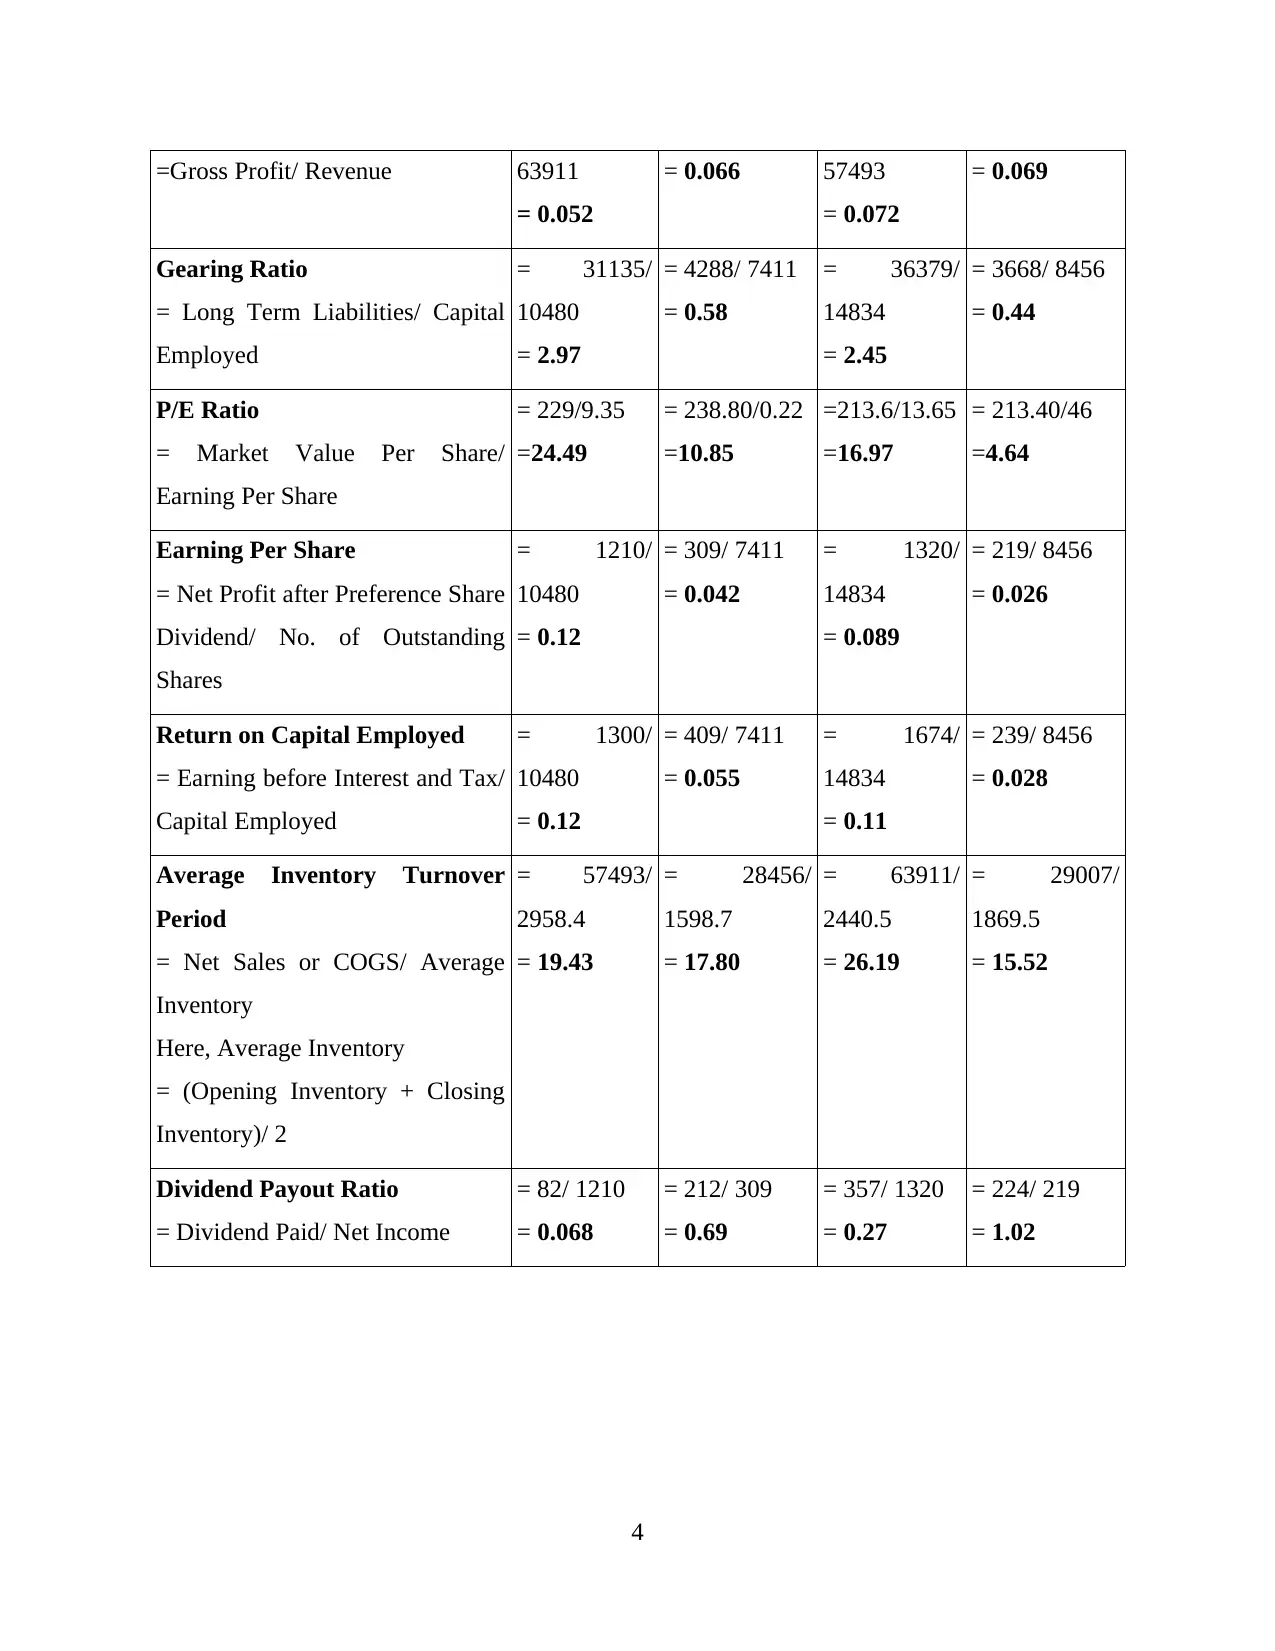
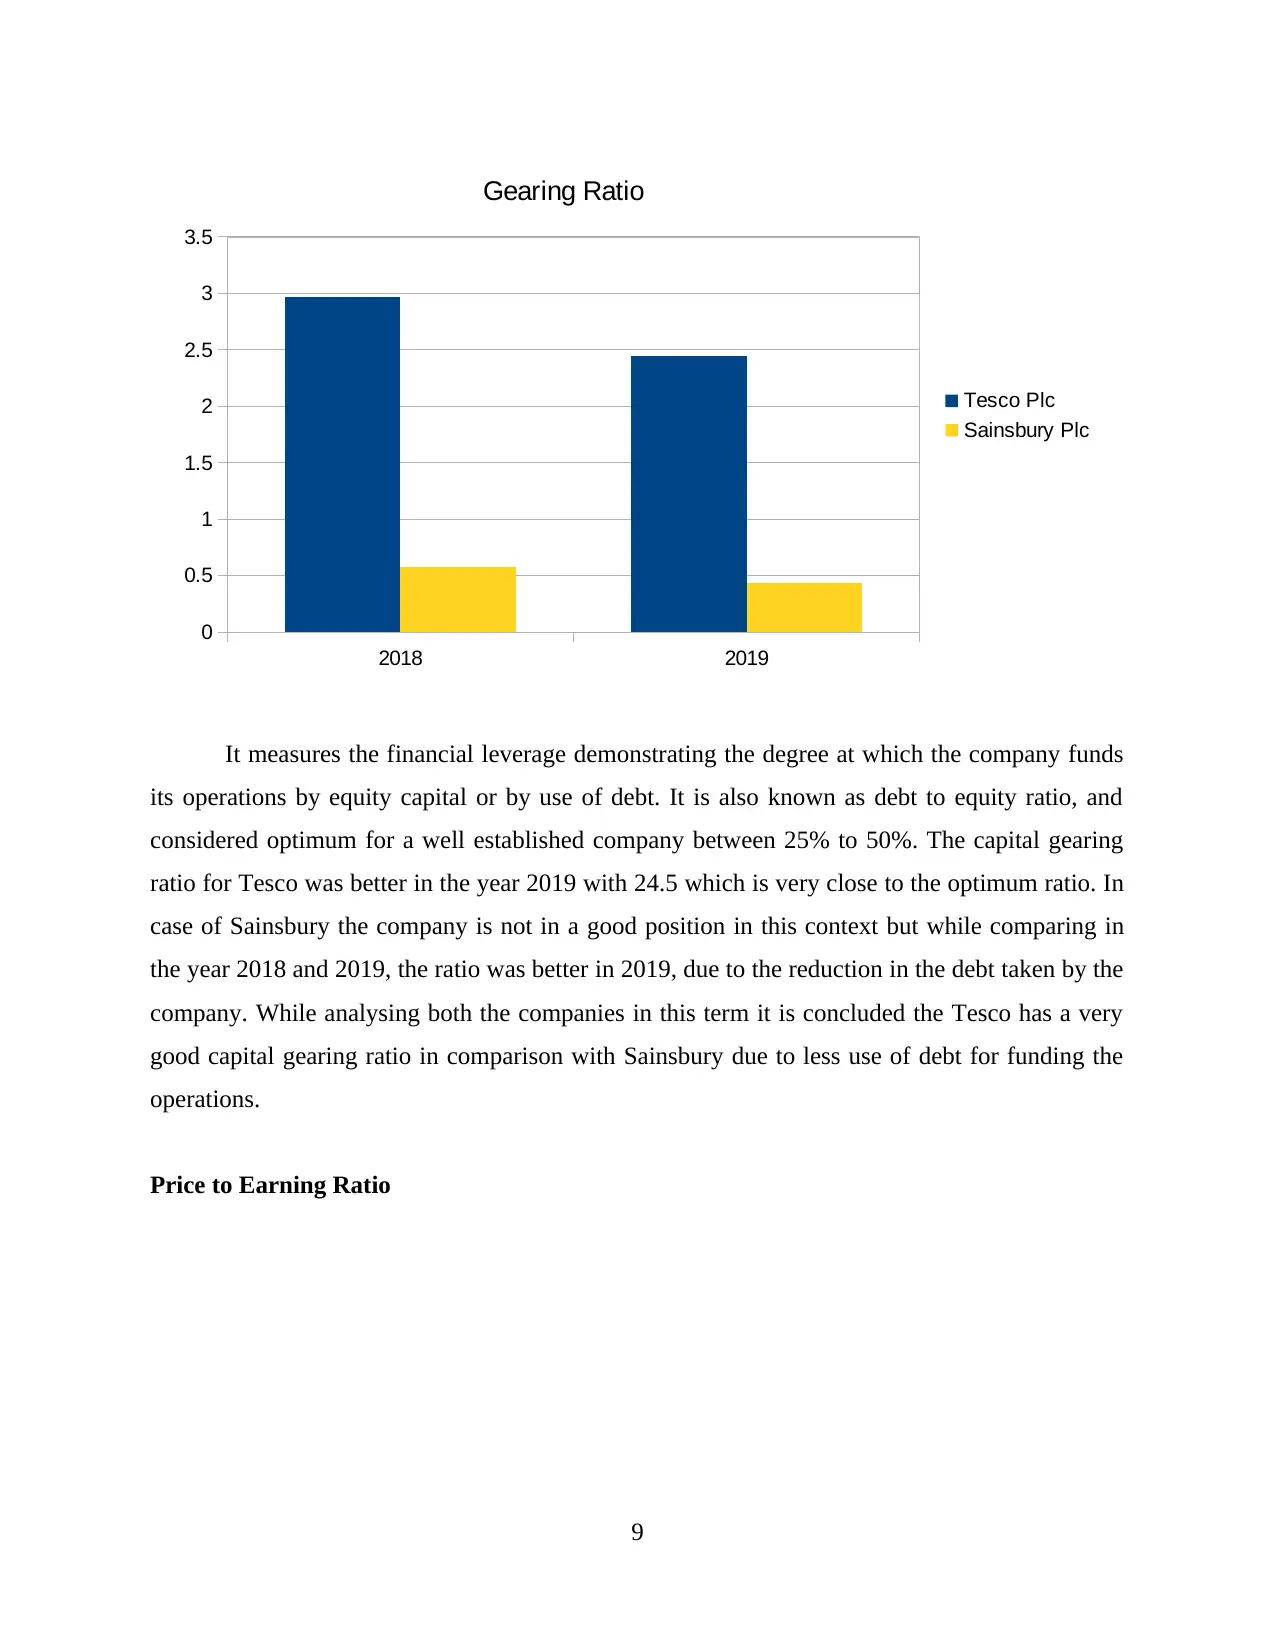
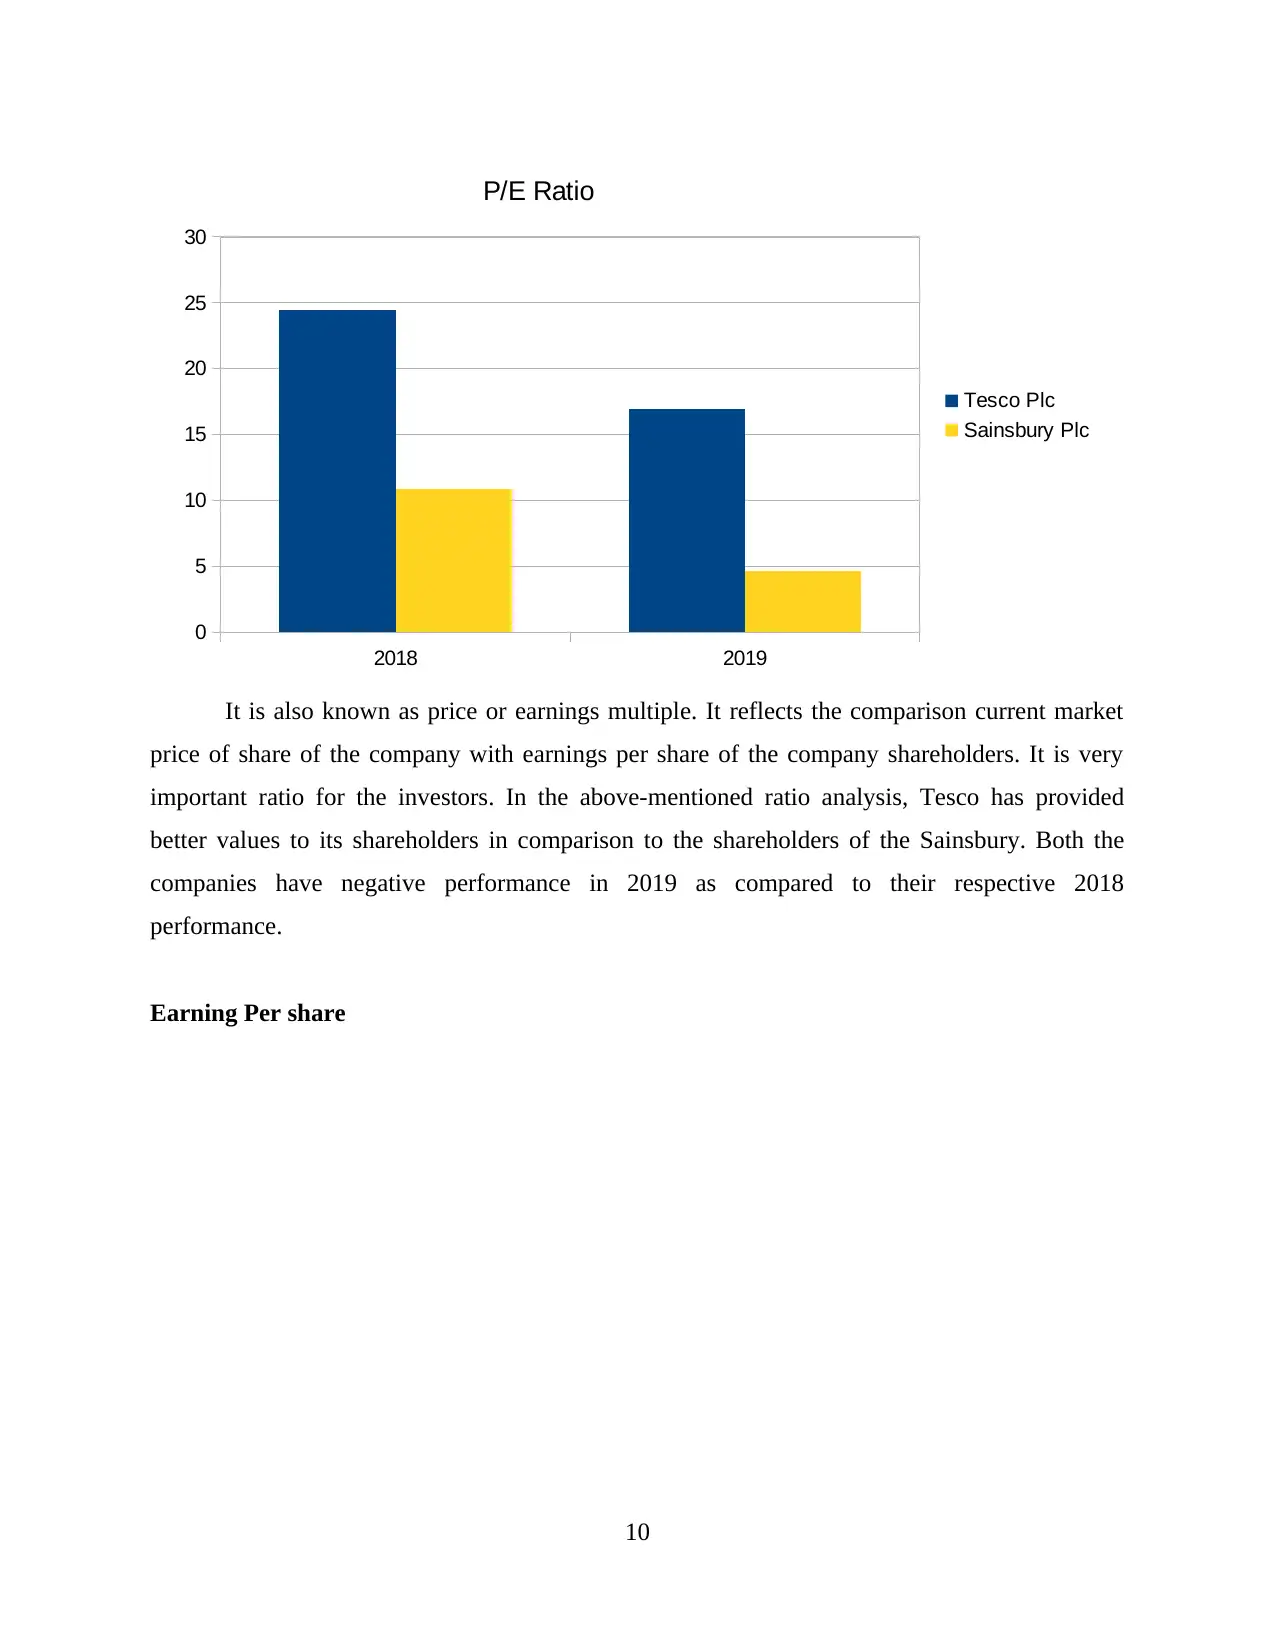
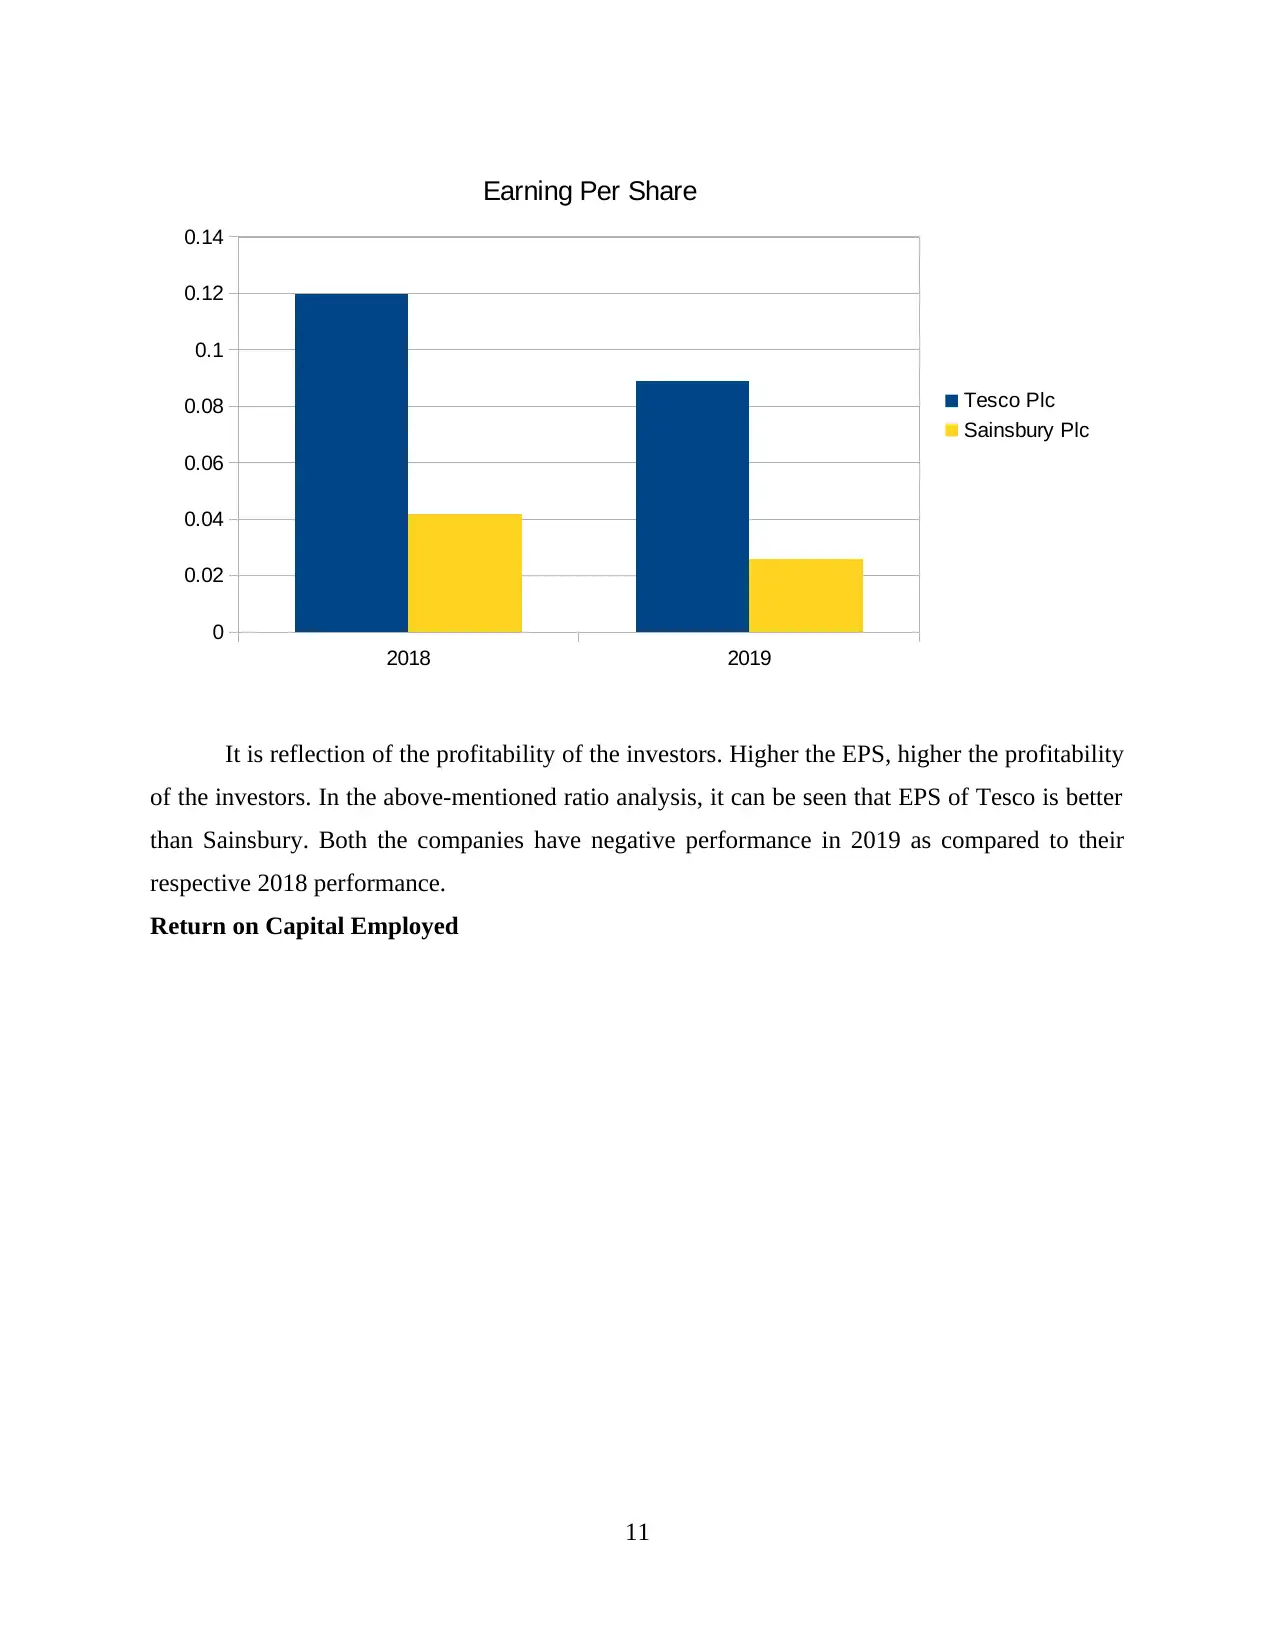
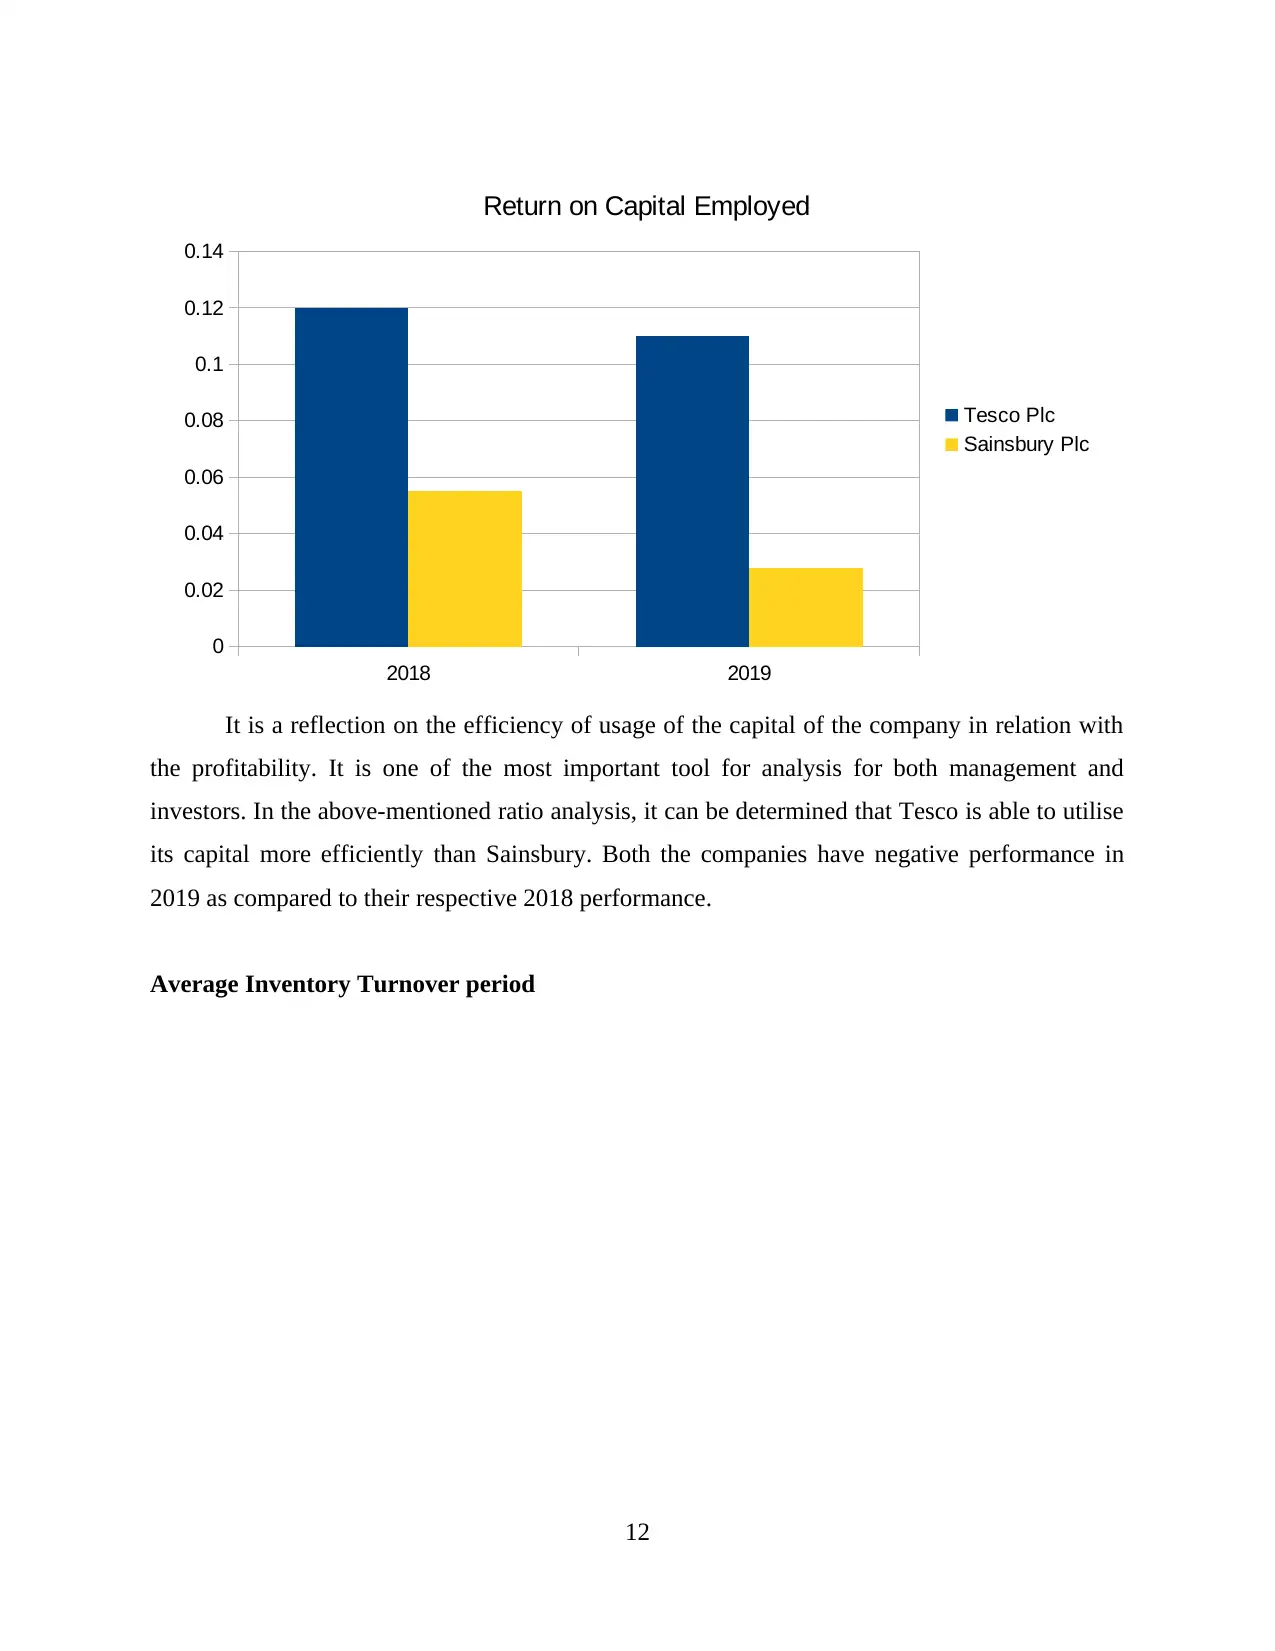
This report delves into managerial finance, evaluating financial decision-making from both investor and management perspectives. It comprises two portfolios: the first focuses on analyzing the financial performance, position, and investment potential of Sainsbury PLC and Tesco PLC using ratio analysis, including current, quick, net profit margin, gross profit margin, gearing, P/E, EPS, ROCE, inventory turnover, and dividend payout ratios. The analysis covers both 2018 and 2019 data, with graphical representations and comparisons. The report also offers recommendations for improving the financial performance of poorly performing businesses and discusses the limitations of relying solely on financial ratios. The second portfolio explores capital investment appraisal techniques and their limitations in long-term decision-making. The report concludes by synthesizing the findings and referencing relevant financial literature.
Document Page
Managerial finance
1
tabler-icon-diamond-filled.svg

Paraphrase This Document

Need a fresh take? Get an instant paraphrase of this document with our AI Paraphraser
Document Page
Table of Contents
Introduction......................................................................................................................................3
Portfolio 1........................................................................................................................................3
Ratio analysis..............................................................................................................................3
Analysis of financial performance, position and investment potential of both companies.........5
Recommendations on improving financial performance of poorly performing business.........13
Limitations of relying on financial ratios..................................................................................14
Portfolio 2......................................................................................................................................15
Investment Appraisal techniques..............................................................................................15
Limitations of using investment appraisal techniques in long term decision making..............16
Conclusion.....................................................................................................................................18
References......................................................................................................................................19
2
Document Page
Introduction
Financial decision making is critical for a business as finance provides backbone to sound
operations, success and growth of the business. It includes taking responsible decisions for
financial performance and position of the business (Chandra, 2017). This report is aimed at
evaluating financial decision making of two companies from investors' point of view and
investment appraisal techniques from management point of view. It is divided in two portfolios.
First portfolio is aimed at analysing financial performance, position and investment potential of
Sainsbury PLC and Tesco PLC through ratio analysis. Sainsbury PLC i Limitations of ratio
analysis in interpreting company's performance is also discussed. Further recommendations are
provided for improving financial performance of poorly performing businesses. Second portfolio
is aimed at analysing capital investment appraisal techniques and their limitations in long term
decision making for a company.
Portfolio 1
Ratio analysis
Ratio 2018 2019
Tesco Plc Sainsbury Tesco Plc Sainsbury
Current Ratio
= Current Assets/ Current
Liabilities
= 13749/
19233)
= 0.71
= 7866/
10302)
= 0.76
= 12668/
20680
= 0.61
= 7589/ 11417
= 0.66
Quick Ratio
= Quick Assets/ Current
Liabilities
Here, Quick Assets = Current
Asset- Inventories
= 9752/
19233)
= 0.51
= 6136/
10302)
= 0.60
= 9690/
20680)
= 0.47
= 6486/
11417)
= 0.56
Net Profit Margin Ratio
= Net Profit/ Revenue
= 1210/
63911
= 0.019
= 309/ 28456
= 0.01
= 1320/
57493
= 0.023
= 219/ 29007
= 0.008
Gross Profit Margin Ratio = 3352/ = 1882/ 28456 = 4144/ = 2007/ 29007
3
Document Page
=Gross Profit/ Revenue 63911
= 0.052
= 0.066 57493
= 0.072
= 0.069
Gearing Ratio
= Long Term Liabilities/ Capital
Employed
= 31135/
10480
= 2.97
= 4288/ 7411
= 0.58
= 36379/
14834
= 2.45
= 3668/ 8456
= 0.44
P/E Ratio
= Market Value Per Share/
Earning Per Share
= 229/9.35
=24.49
= 238.80/0.22
=10.85
=213.6/13.65
=16.97
= 213.40/46
=4.64
Earning Per Share
= Net Profit after Preference Share
Dividend/ No. of Outstanding
Shares
= 1210/
10480
= 0.12
= 309/ 7411
= 0.042
= 1320/
14834
= 0.089
= 219/ 8456
= 0.026
Return on Capital Employed
= Earning before Interest and Tax/
Capital Employed
= 1300/
10480
= 0.12
= 409/ 7411
= 0.055
= 1674/
14834
= 0.11
= 239/ 8456
= 0.028
Average Inventory Turnover
Period
= Net Sales or COGS/ Average
Inventory
Here, Average Inventory
= (Opening Inventory + Closing
Inventory)/ 2
= 57493/
2958.4
= 19.43
= 28456/
1598.7
= 17.80
= 63911/
2440.5
= 26.19
= 29007/
1869.5
= 15.52
Dividend Payout Ratio
= Dividend Paid/ Net Income
= 82/ 1210
= 0.068
= 212/ 309
= 0.69
= 357/ 1320
= 0.27
= 224/ 219
= 1.02
4
tabler-icon-diamond-filled.svg

Paraphrase This Document

Need a fresh take? Get an instant paraphrase of this document with our AI Paraphraser
Document Page
Analysis of financial performance, position and investment potential of both companies
Current Ratio
It is a liquidity ratio used to measure the firm's ability to pay off its short term liabilities.
The ideal current ratio is 2:1. The current ratio of Tesco has reduced to 0.61 in the year 2019, it
was due to increase in current liabilities of the organisation in that year. Also the ratio of
Sainsbury has also reduced from the previous year and is 0.66 in 2019. It is due to reduction in
the total current assets of the company. While comparing both the companies it can be concluded
that Tesco has a better current ratio them that of Sainsbury as it is more close to the ideal ratio.
Quick Ratio
5
2018 2019
0
0.1
0.2
0.3
0.4
0.5
0.6
0.7
0.8
Current Ratio
Tesco Plc
Sainsbury Plc
Document Page
It is also known as acid test ratio. It helps in measuring the firms ability as to how well it
can pay its current liabilities without the use of inventory and taking additional finance. The
higher the ratio is the better it is for the company's liquidity. The quick ratio of Tesco was better
in the year 2018, i.e. 0.51 an comparison with 0.46 in 2019. It was better for Sainsbury in the
year 2018 as compared to the year 2019, which was due to increase in current liabilities. By
comparing both the companies it can be summarised that Sainsbury has a better performance in
context of Quick ratio in comparison with Tesco.
Net Profit Margin Ratio
6
2018 2019
0
0.1
0.2
0.3
0.4
0.5
0.6
0.7
Quick Ratio
Tesco Plc
Sainsbury Plc
Document Page
It is the percentage of net profit or income generated to Revenue earned by the company.
Higher the net profit margin ratio the better it is for the company. The net profit margin for
Tesco has increased to 0.023 in the year 2019 due to higher revenues generated in that year.
Whereas the net profit margin for Sainsbury is higher in the year 2018. It was a result of
decreased net profit due to increased cost of operations. By comparing both the companies it is
concluded that Tesco has a better performance index then Sainsbury for the year 2019 due to its
increased revenues.
Gross Profit Margin
7
2018 2019
0
0.005
0.01
0.015
0.02
0.025
Net Profit Margin Ratio
Tesco Plc
Sainsbury Plc
tabler-icon-diamond-filled.svg

Paraphrase This Document

Need a fresh take? Get an instant paraphrase of this document with our AI Paraphraser
Document Page
It is a profitability ratio that compares the gross margin of the company with the revenue
earned . It shows the profit making capability of the organisation after paying for the cost of
goods sold. Higher the Gross profit margin better is the performance of the company. Tesco has
improved its GP margin in the year 2019 with 0.072 in comparison with the previous year 2018.
Also in case of Sainsbury there is an increment in the ratio for the year 2019 in comparison with
that of the year 2018. Sainsbury has a better gross profit margin in context with that of Tesco for
bout the years. This was due to low cost of goods sold of Sainsbury.
Gearing Ratio
8
2018 2019
0
0.01
0.02
0.03
0.04
0.05
0.06
0.07
0.08
Gross Profit Margin Ratio
Tesco Plc
Sainsbury Plc
Document Page
It measures the financial leverage demonstrating the degree at which the company funds
its operations by equity capital or by use of debt. It is also known as debt to equity ratio, and
considered optimum for a well established company between 25% to 50%. The capital gearing
ratio for Tesco was better in the year 2019 with 24.5 which is very close to the optimum ratio. In
case of Sainsbury the company is not in a good position in this context but while comparing in
the year 2018 and 2019, the ratio was better in 2019, due to the reduction in the debt taken by the
company. While analysing both the companies in this term it is concluded the Tesco has a very
good capital gearing ratio in comparison with Sainsbury due to less use of debt for funding the
operations.
Price to Earning Ratio
9
2018 2019
0
0.5
1
1.5
2
2.5
3
3.5
Gearing Ratio
Tesco Plc
Sainsbury Plc
Document Page
It is also known as price or earnings multiple. It reflects the comparison current market
price of share of the company with earnings per share of the company shareholders. It is very
important ratio for the investors. In the above-mentioned ratio analysis, Tesco has provided
better values to its shareholders in comparison to the shareholders of the Sainsbury. Both the
companies have negative performance in 2019 as compared to their respective 2018
performance.
Earning Per share
10
2018 2019
0
5
10
15
20
25
30
P/E Ratio
Tesco Plc
Sainsbury Plc
tabler-icon-diamond-filled.svg

Paraphrase This Document

Need a fresh take? Get an instant paraphrase of this document with our AI Paraphraser
Document Page
It is reflection of the profitability of the investors. Higher the EPS, higher the profitability
of the investors. In the above-mentioned ratio analysis, it can be seen that EPS of Tesco is better
than Sainsbury. Both the companies have negative performance in 2019 as compared to their
respective 2018 performance.
Return on Capital Employed
11
2018 2019
0
0.02
0.04
0.06
0.08
0.1
0.12
0.14
Earning Per Share
Tesco Plc
Sainsbury Plc
Document Page
It is a reflection on the efficiency of usage of the capital of the company in relation with
the profitability. It is one of the most important tool for analysis for both management and
investors. In the above-mentioned ratio analysis, it can be determined that Tesco is able to utilise
its capital more efficiently than Sainsbury. Both the companies have negative performance in
2019 as compared to their respective 2018 performance.
Average Inventory Turnover period
12
2018 2019
0
0.02
0.04
0.06
0.08
0.1
0.12
0.14
Return on Capital Employed
Tesco Plc
Sainsbury Plc
chevron_up_icon
1 out of 20
circle_padding
hide_on_mobile
zoom_out_icon
[object Object]