Financial Performance Analysis: Boral Ltd & Adelaide Brighton Ltd
VerifiedAdded on 2020/04/29
|36
|5955
|79
Report
AI Summary
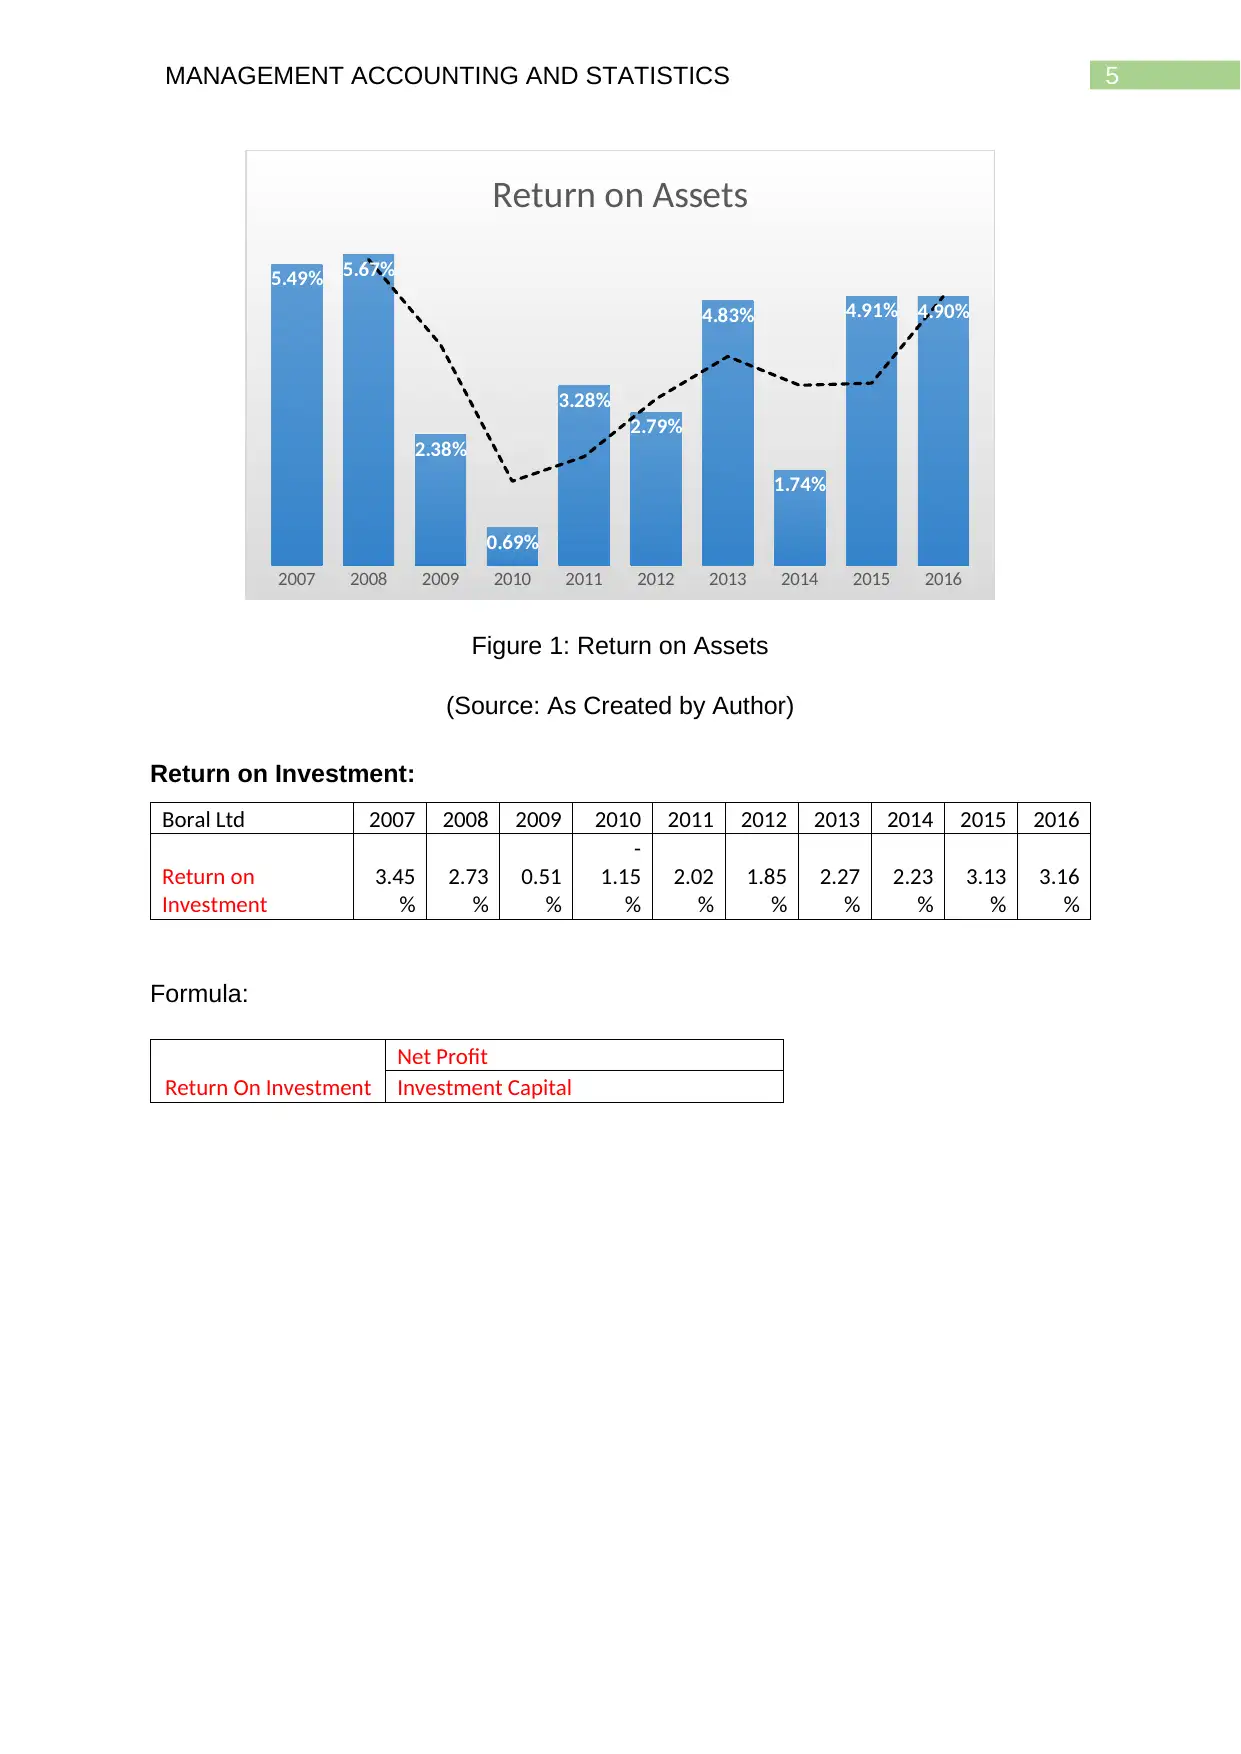
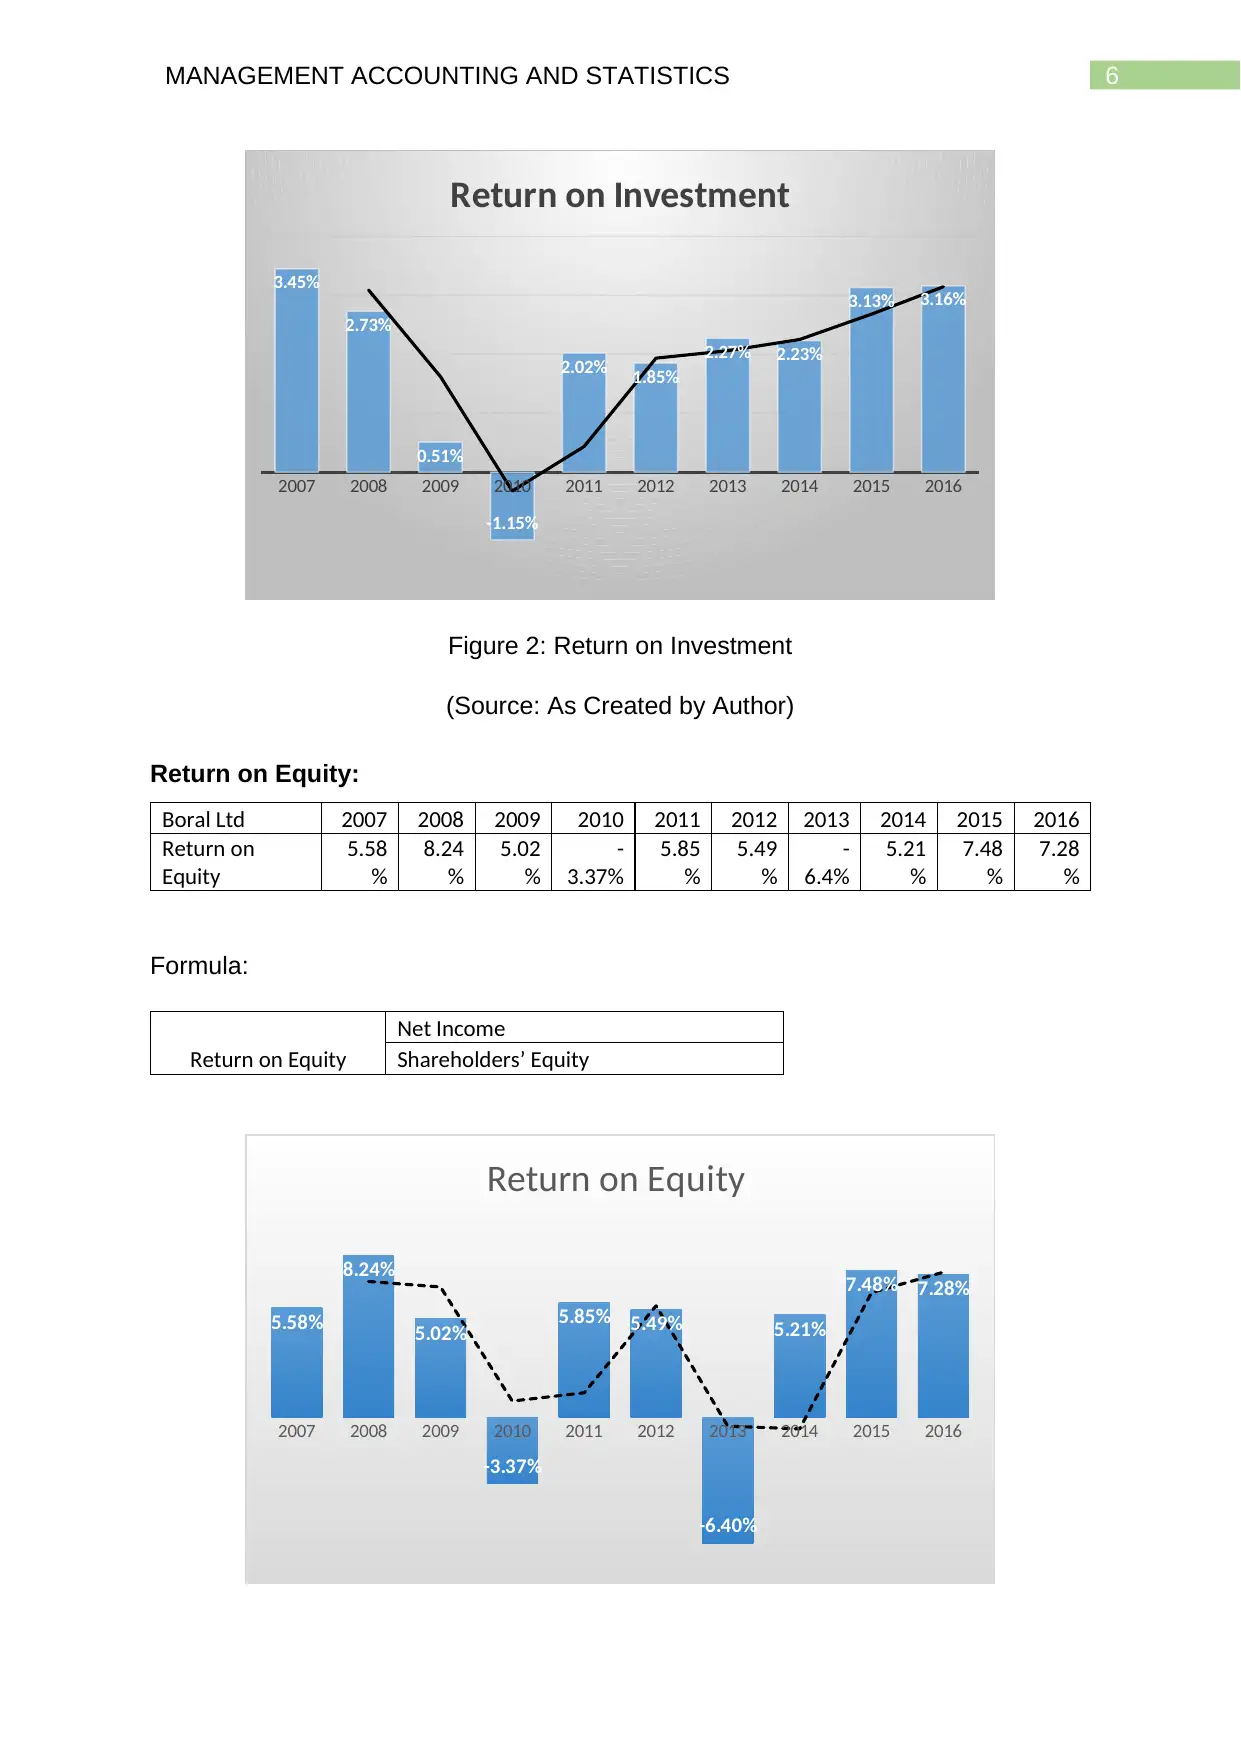
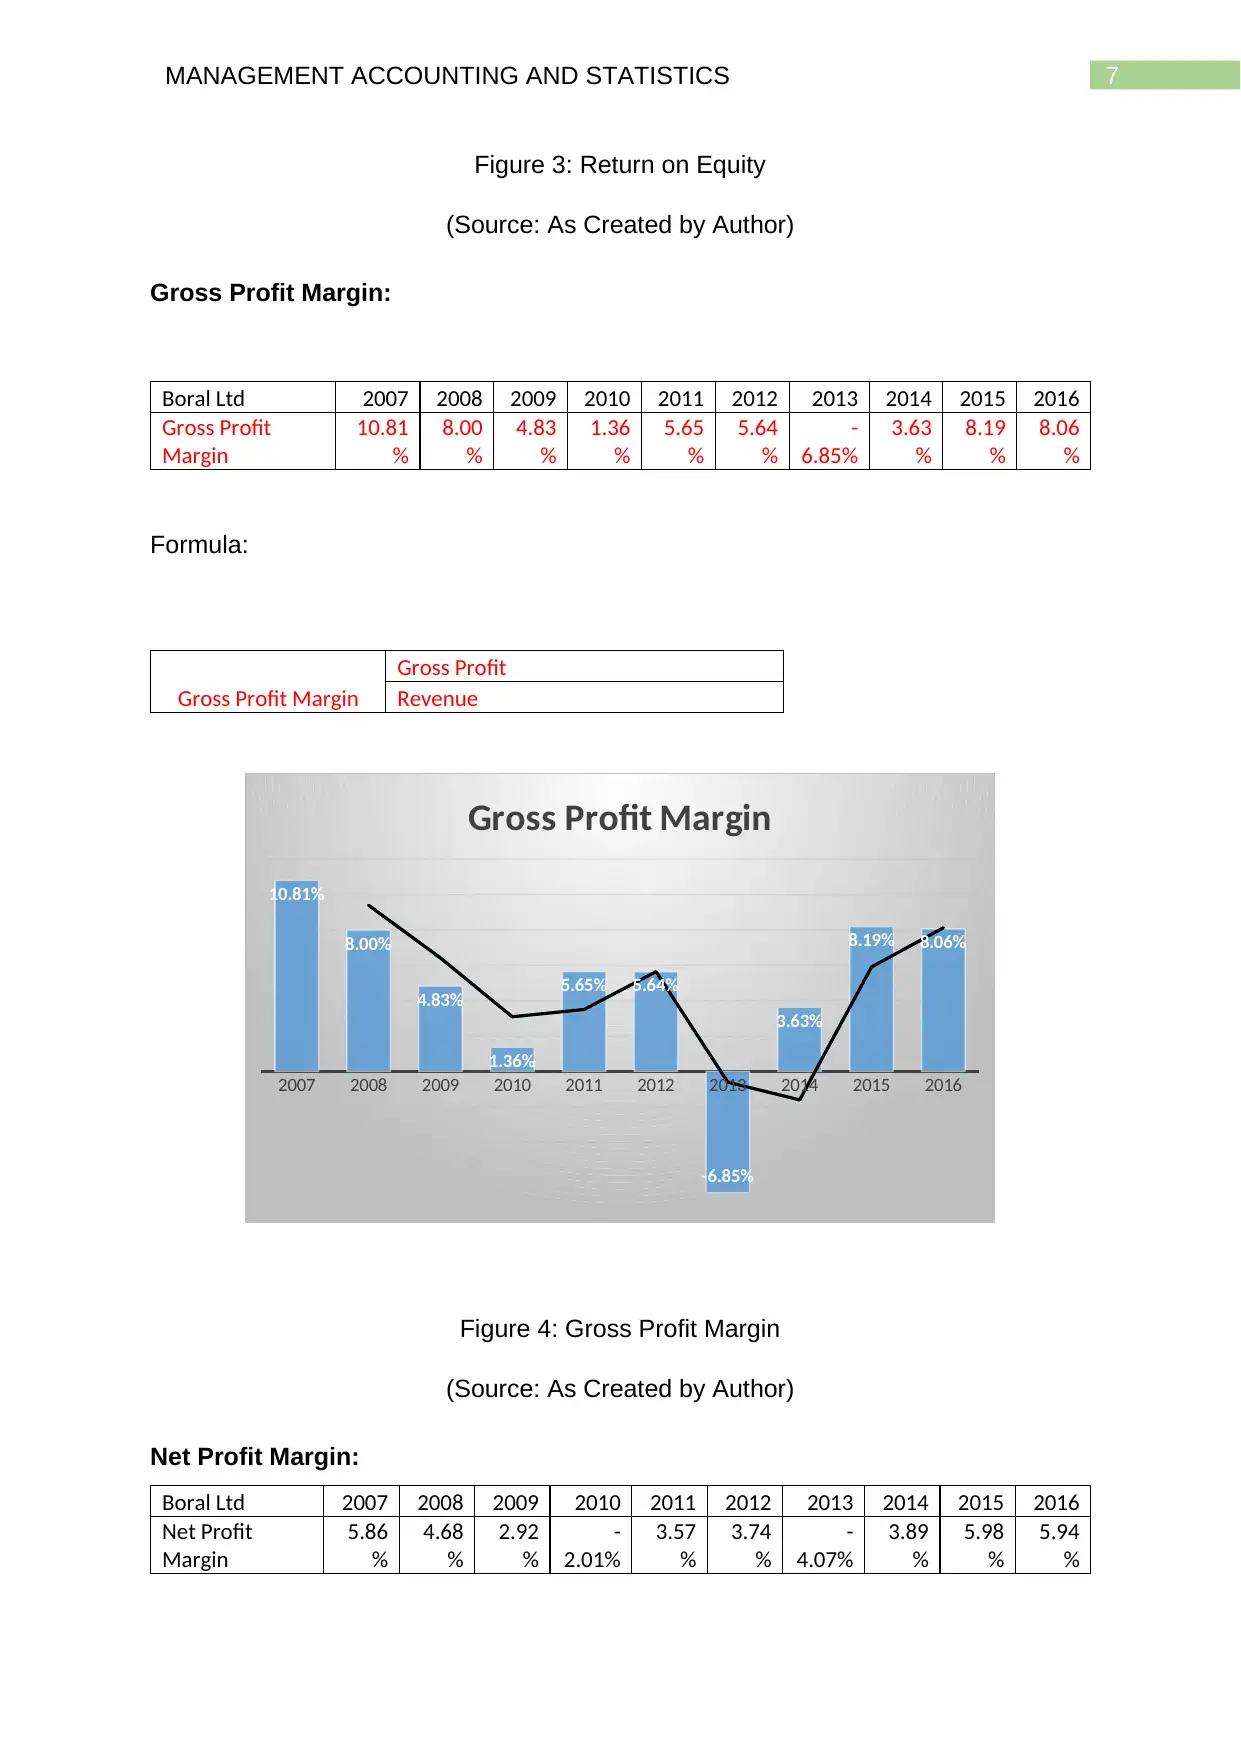
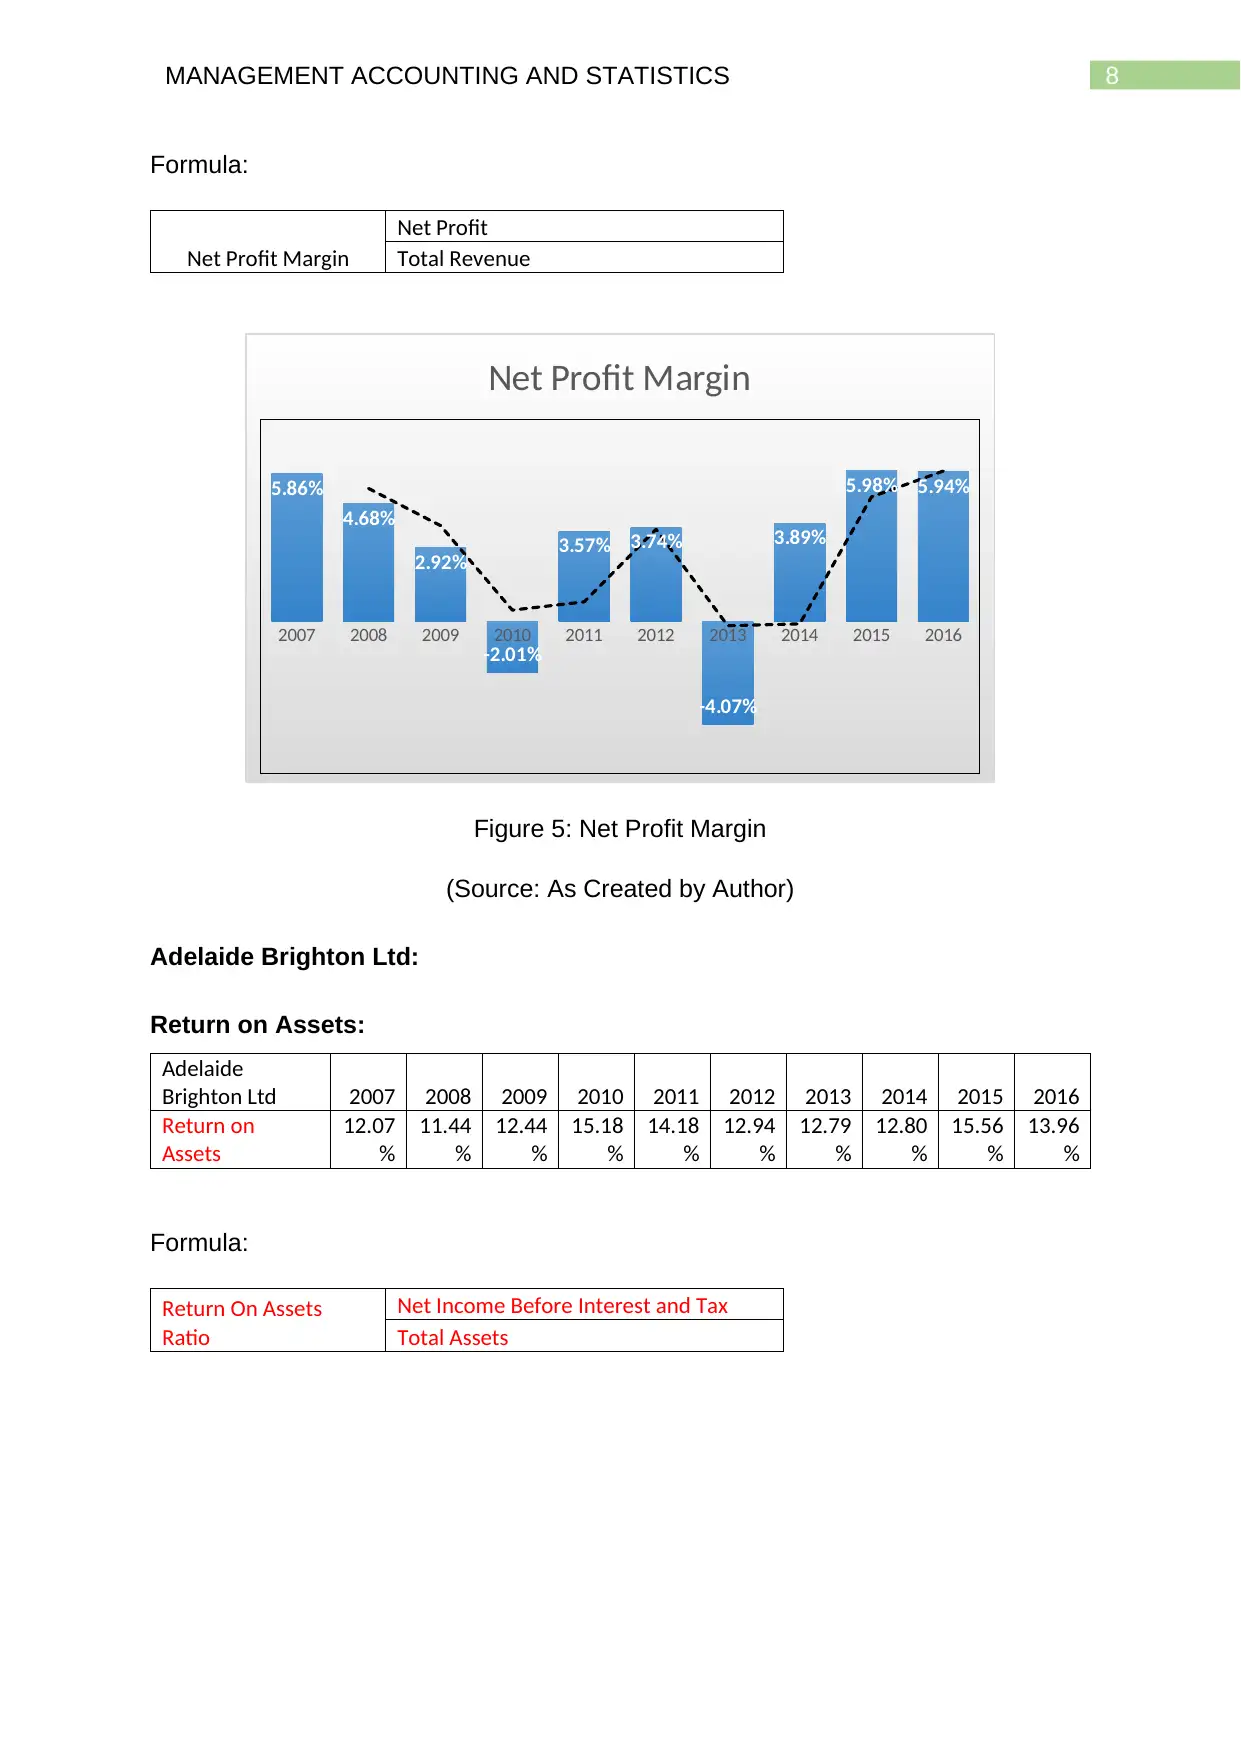
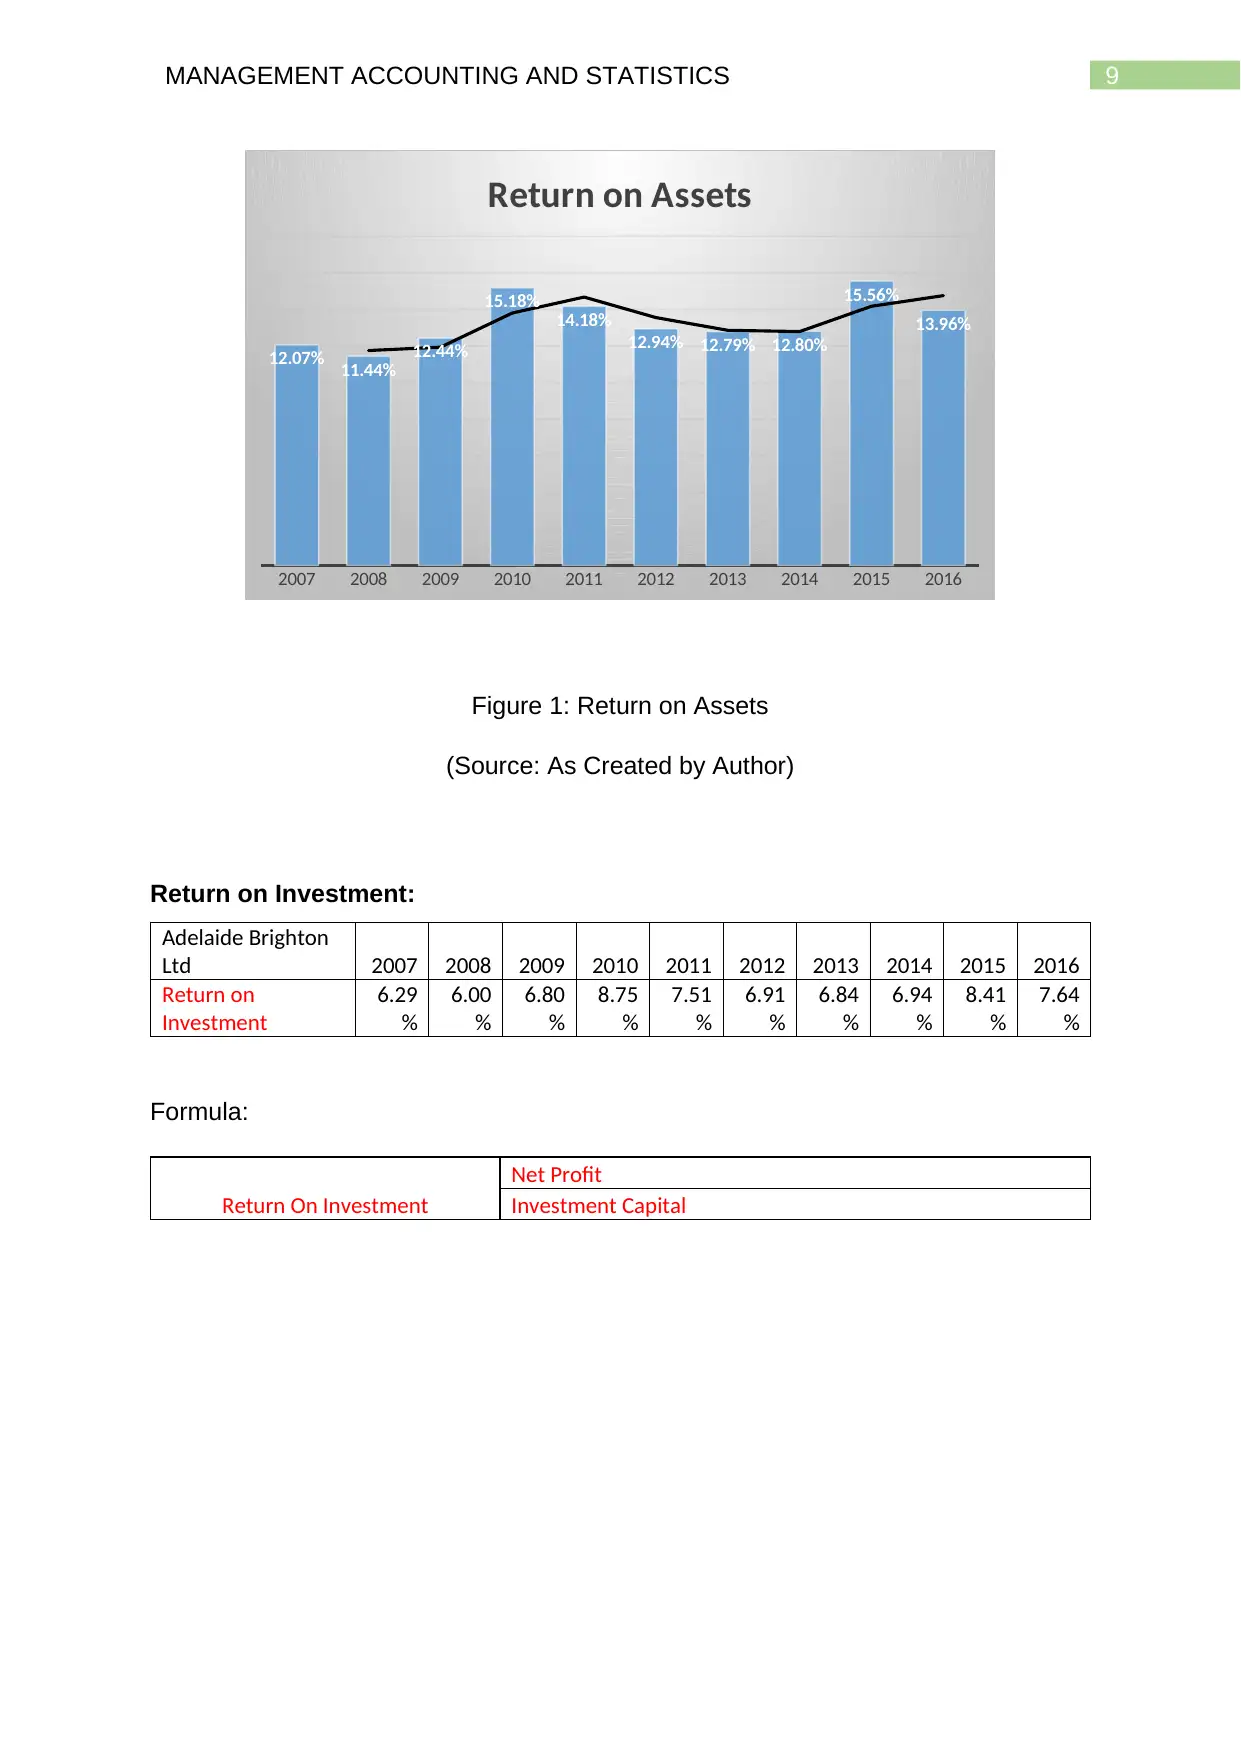
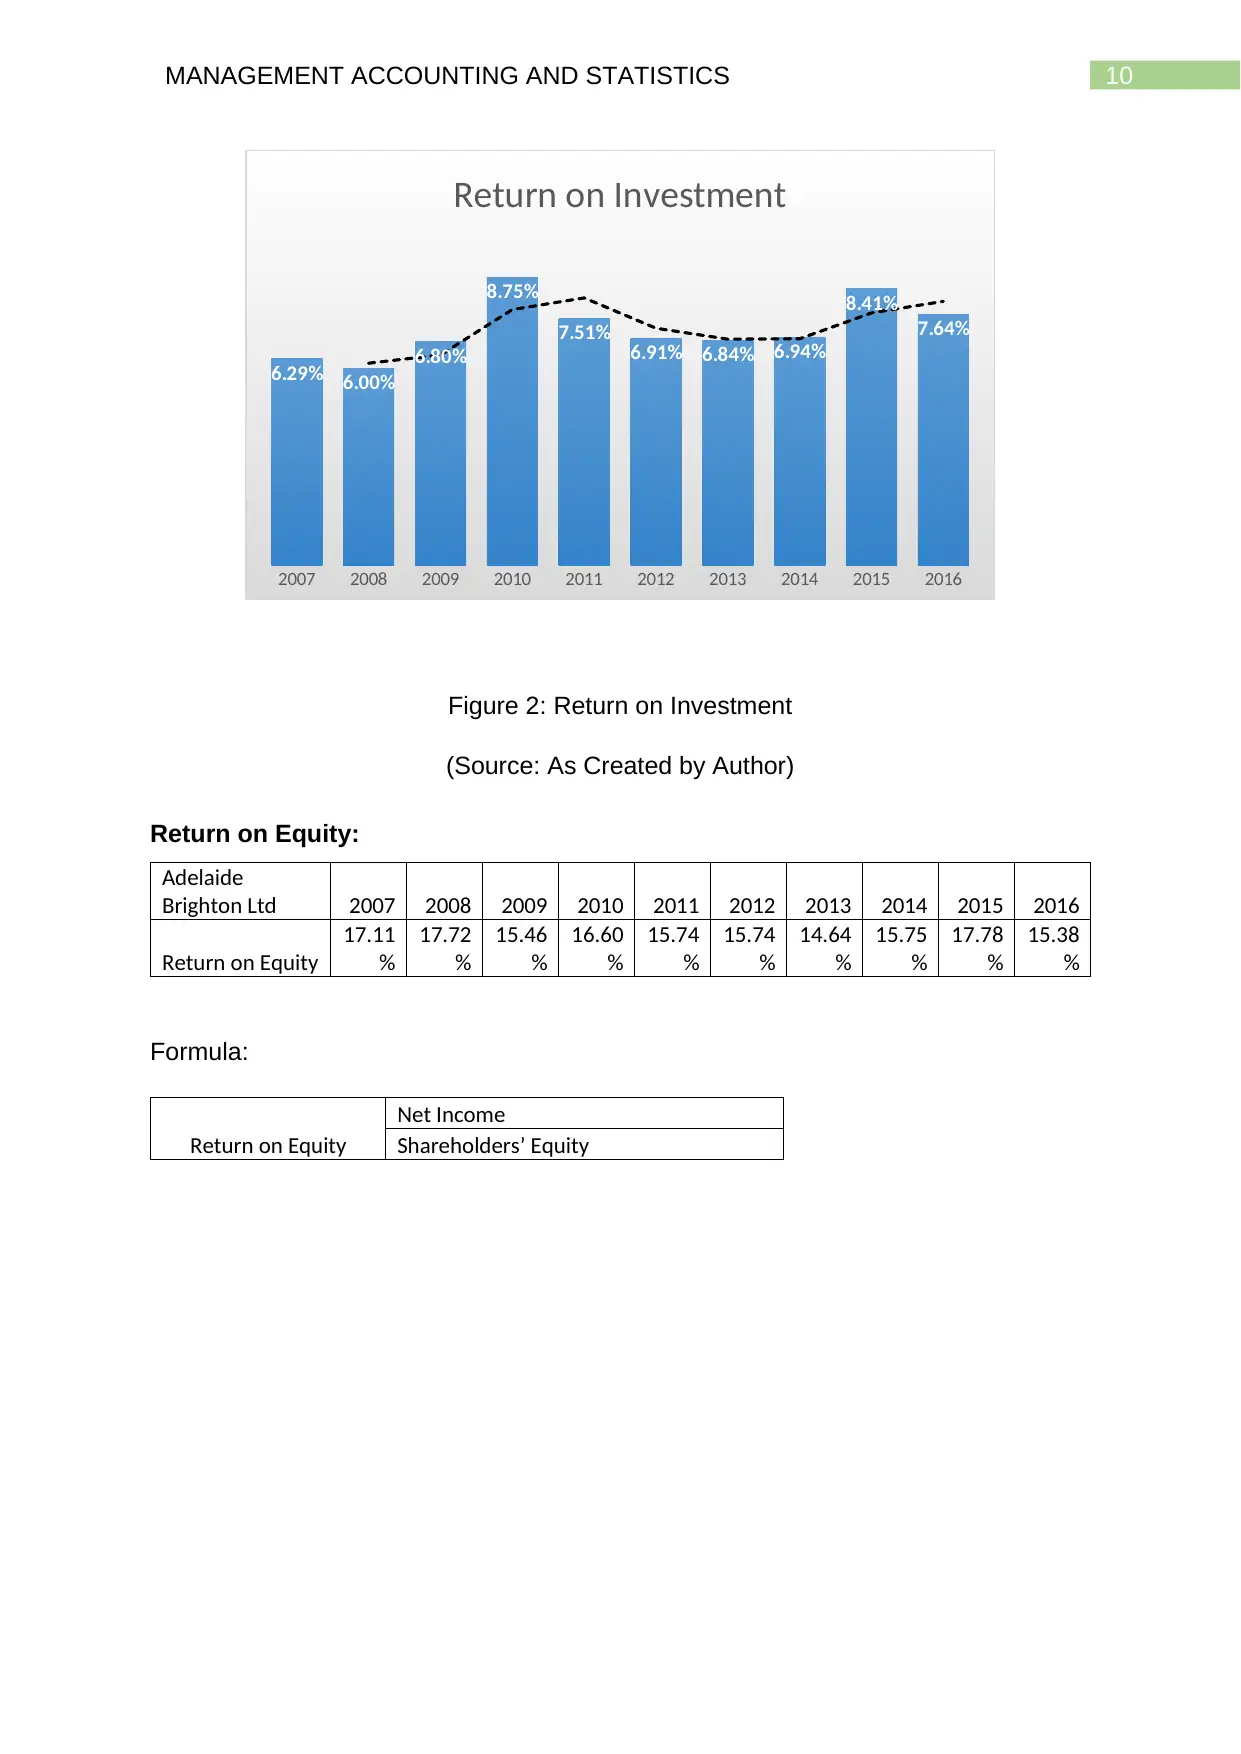
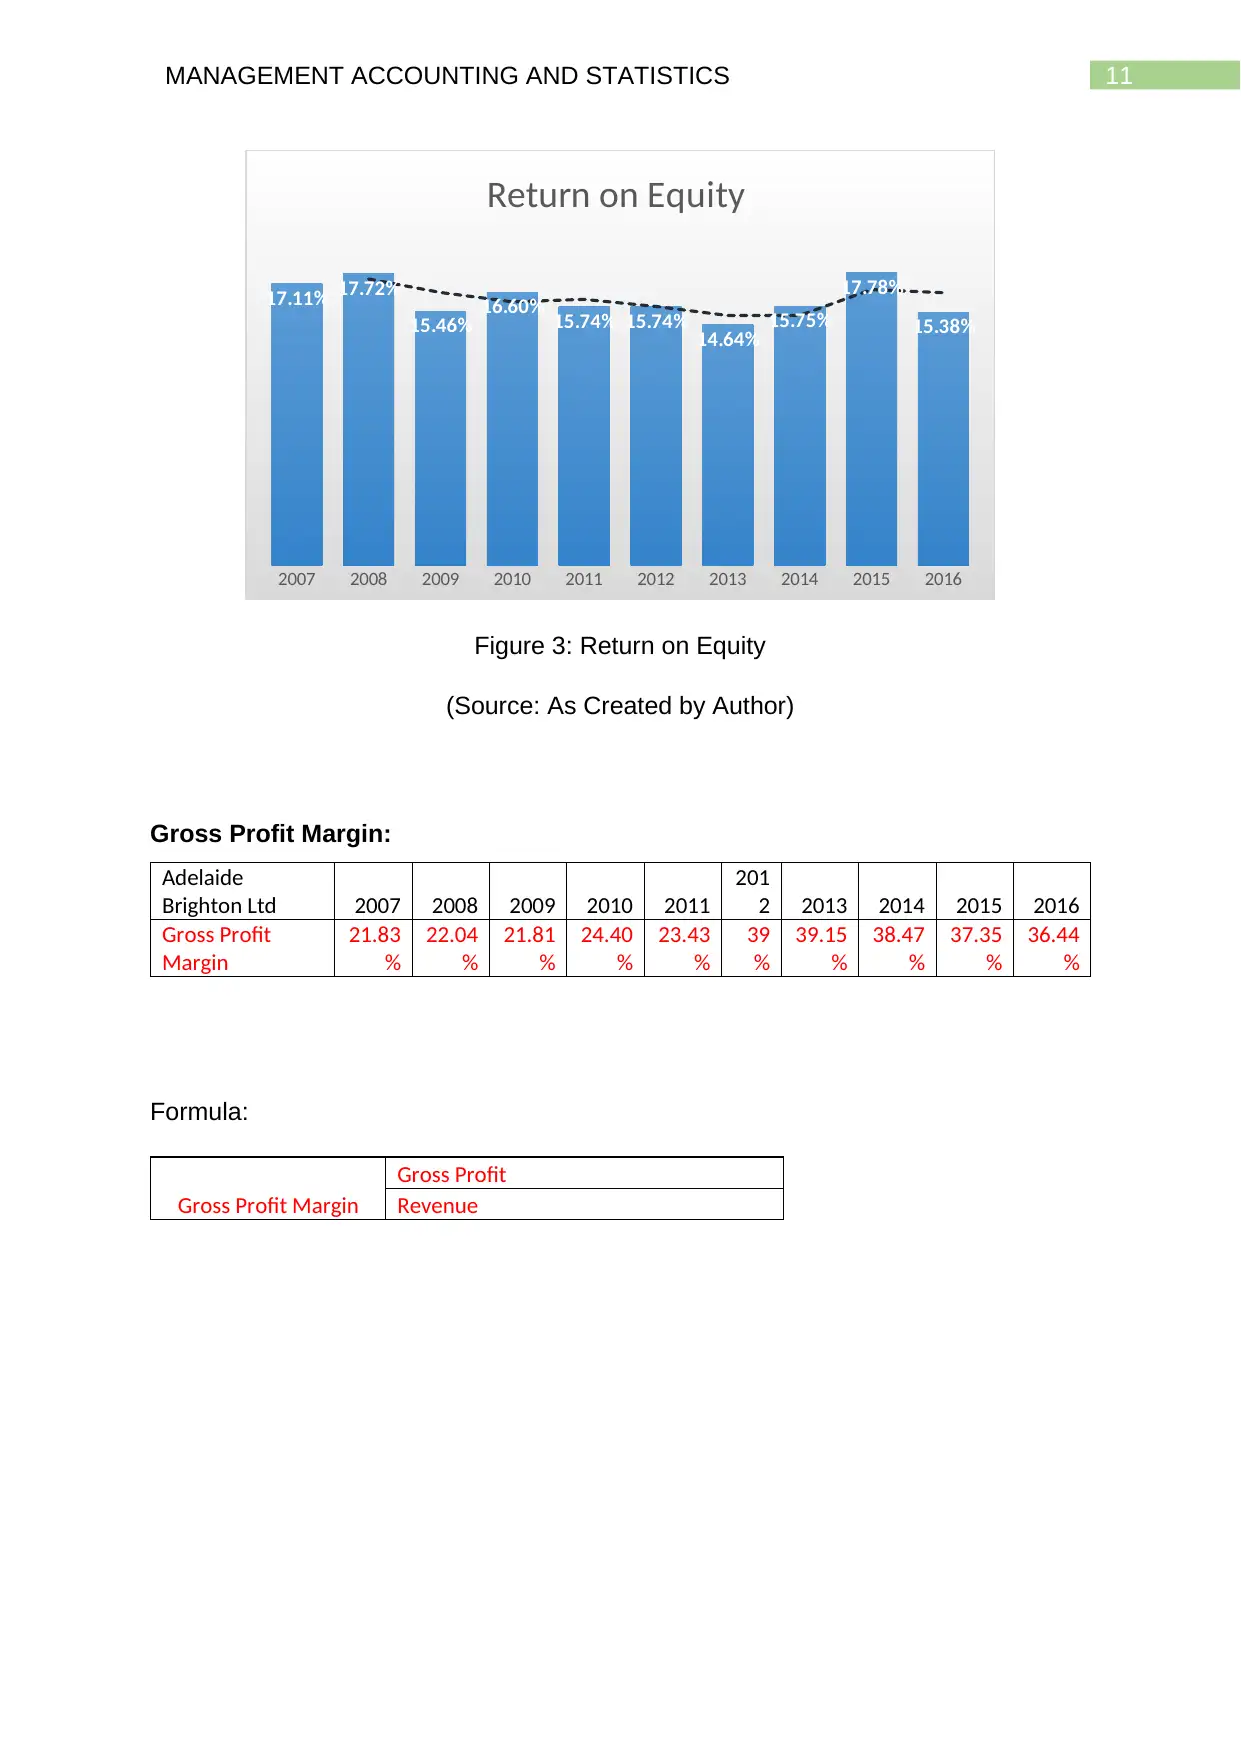
This report presents a comprehensive analysis of the financial performance of Boral Ltd and Adelaide Brighton Ltd over a ten-year period. It begins with an introduction outlining the study's objectives, which include assessing profitability and identifying trends. The report then provides detailed analyses of each company, including their missions, objectives, and strategic priorities. Graphical representations of key financial ratios such as Return on Assets, Return on Investment, Return on Equity, Gross Profit Margin, and Net Profit Margin are presented for both companies. The analysis delves into the financial performance of each company, highlighting revenue trends, profit margins, and return on equity. Comparative studies are conducted using ratio analysis to evaluate the financial positions of both companies. Descriptive statistics and correlation coefficients are also used to analyze variables from the financial statements. The report includes answers to specific questions regarding the financial data and concludes with a summary of the findings and references.

Running head: MANAGEMENT ACCOUNTING AND STATISTICS
Management Accounting and Statistics
Name of the University
Name of the Student
Authors Note
Course ID
Management Accounting and Statistics
Name of the University
Name of the Student
Authors Note
Course ID
Paraphrase This Document
Need a fresh take? Get an instant paraphrase of this document with our AI Paraphraser

1MANAGEMENT ACCOUNTING AND STATISTICS
Table of Contents
Part A:......................................................................................................................... 3
Introduction:................................................................................................................ 3
Outline of the mission, objectives, strategic priorities and operations:........................3
Graphical Representation of the Trend analysis of the profitability:............................4
Boral Ltd:.....................................................................................................................4
Return On Assets:.......................................................................................................4
Return on Investment:.................................................................................................5
Return on Equity:........................................................................................................ 6
Gross Profit Margin:.................................................................................................... 7
Net Profit Margin:........................................................................................................ 8
Adelaide Brighton Ltd:.................................................................................................9
Return on Assets:........................................................................................................9
Return on Investment:...............................................................................................10
Return on Equity:...................................................................................................... 11
Gross Profit Margin:.................................................................................................. 12
Net Profit Margin:...................................................................................................... 13
Analysis of the financial performance:.......................................................................14
Comparative study of Financial Position:..................................................................17
Part B:....................................................................................................................... 20
Answer to 1:.............................................................................................................. 20
Answer to 2:.............................................................................................................. 22
Answer to 3:.............................................................................................................. 24
Answer to 4............................................................................................................... 26
Answer to 5:.............................................................................................................. 29
Conclusion:............................................................................................................... 34
Reference..................................................................................................................36

2MANAGEMENT ACCOUNTING AND STATISTICS
⊘ This is a preview!⊘
Do you want full access?
Subscribe today to unlock all pages.

Trusted by 1+ million students worldwide

3MANAGEMENT ACCOUNTING AND STATISTICS
Part A:
Introduction:
The following study is based on the assessment of the financial performance
of the Boral Ltd and Adelaide Brighton Ltd by measuring the profitability of these
companies for a period of ten years. The study will further analyse the financial
performance of the companies throughout the period of ten years in order to
determine the success and failure of these companies.
The report will additionally gauge into the comparative results derived by
using the ratio analysis tools to comment on the overall strength of the companies
undertaken for research purpose. On the other hand, of the report a graphical
representation of the numerous variables derived from the financial statement of
both the companies will be provided. Additionally, descriptive statistics with
correlation coefficient will be performed on the number of variables extracted from
the data of the financial report.
Outline of the mission, objectives, strategic priorities and operations:
Boral ltd is the multinational company that is dealing in building and
constructions materials. The company was founded in Australian and its operations
extends to United States and Asia. The strategic intent of Boral Ltd is to be a value
and market determined, being focussed towards building and constructions material
supplier. The objective of the company is to exceed the weighted average cost of
capital with the help of sustainable methods through the building cycle.
The strategic priorities of Boral Ltd is to render improved financial results in
the comparable markets. Additionally the strategic intent and object of Boral Ltd is to
provide greater returns to the shareholder and achieving superior returns to the
shareholder. The operations priorities of Boral Ltd is to constantly implement the best
practices for achieving excellent performance including the areas of operational and
commercial excellence (Boral.com.au, 2017). The mission of Boral Ltd is to build a
business portfolio having balanced traditional and innovative products with more
flexible structure of cost.
Adelaide Brighton Ltd on the other hand is the leading Australian integrated
construction material and lime producing company. The operations of the company
Paraphrase This Document
Need a fresh take? Get an instant paraphrase of this document with our AI Paraphraser

4MANAGEMENT ACCOUNTING AND STATISTICS
is engaged in the manufacturing and supply of the variety of constructions material
products, infrastructure and processing of minerals into the markets throughout the
country. The principle objective of the Adelaide Brighton Ltd consists of the
production, importation and distribution of the cement, industrial lime, concrete of
premixed nature, cement and concrete products (Adelaidebrighton.com.au, 2017).
Adelaide Brighton Ltd continues to impose the long-term strategy of growing the
shareholder returns in three key areas. These includes improvement in the
operational efficiency of the business and cost reductions.
The company aims to achieve growth in the business of lime by aiming to
supply its resources in the areas of Western and Southern Australia. Adelaide
Brighton Ltd is focuses on the relevant and vertical integration in the downstream
aggregates, masonry, concrete and logistics. In applying the strategies of growth,
Adelaide Brighton Ltd aims to pay special attention on the business operations and
corporate level towards certain kind of important drivers for the long-term creation of
shareholder value.
Graphical Representation of the Trend analysis of the profitability:
Boral Ltd:
Return On Assets:
Boral Ltd 2007 2008 2009 2010 2011 2012 2013 2014 2015 2016
Return on
Assets
5.49
%
5.67
%
2.38
%
0.69
%
3.28
%
2.79
%
4.83
%
1.74
%
4.91
%
4.90
%
Formula:
Return On Assets
Ratio
Net Income Before Interest and Tax
Total Assets

5MANAGEMENT ACCOUNTING AND STATISTICS
2007 2008 2009 2010 2011 2012 2013 2014 2015 2016
5.49% 5.67%
2.38%
0.69%
3.28%
2.79%
4.83%
1.74%
4.91% 4.90%
Return on Assets
Figure 1: Return on Assets
(Source: As Created by Author)
Return on Investment:
Boral Ltd 2007 2008 2009 2010 2011 2012 2013 2014 2015 2016
Return on
Investment
3.45
%
2.73
%
0.51
%
-
1.15
%
2.02
%
1.85
%
2.27
%
2.23
%
3.13
%
3.16
%
Formula:
Return On Investment
Net Profit
Investment Capital
⊘ This is a preview!⊘
Do you want full access?
Subscribe today to unlock all pages.

Trusted by 1+ million students worldwide

6MANAGEMENT ACCOUNTING AND STATISTICS
2007 2008 2009 2010 2011 2012 2013 2014 2015 2016
3.45%
2.73%
0.51%
-1.15%
2.02% 1.85%
2.27% 2.23%
3.13% 3.16%
Return on Investment
Figure 2: Return on Investment
(Source: As Created by Author)
Return on Equity:
Boral Ltd 2007 2008 2009 2010 2011 2012 2013 2014 2015 2016
Return on
Equity
5.58
%
8.24
%
5.02
%
-
3.37%
5.85
%
5.49
%
-
6.4%
5.21
%
7.48
%
7.28
%
Formula:
Return on Equity
Net Income
Shareholders’ Equity
2007 2008 2009 2010 2011 2012 2013 2014 2015 2016
5.58%
8.24%
5.02%
-3.37%
5.85% 5.49%
-6.40%
5.21%
7.48% 7.28%
Return on Equity
2007 2008 2009 2010 2011 2012 2013 2014 2015 2016
3.45%
2.73%
0.51%
-1.15%
2.02% 1.85%
2.27% 2.23%
3.13% 3.16%
Return on Investment
Figure 2: Return on Investment
(Source: As Created by Author)
Return on Equity:
Boral Ltd 2007 2008 2009 2010 2011 2012 2013 2014 2015 2016
Return on
Equity
5.58
%
8.24
%
5.02
%
-
3.37%
5.85
%
5.49
%
-
6.4%
5.21
%
7.48
%
7.28
%
Formula:
Return on Equity
Net Income
Shareholders’ Equity
2007 2008 2009 2010 2011 2012 2013 2014 2015 2016
5.58%
8.24%
5.02%
-3.37%
5.85% 5.49%
-6.40%
5.21%
7.48% 7.28%
Return on Equity
Paraphrase This Document
Need a fresh take? Get an instant paraphrase of this document with our AI Paraphraser

7MANAGEMENT ACCOUNTING AND STATISTICS
Figure 3: Return on Equity
(Source: As Created by Author)
Gross Profit Margin:
Boral Ltd 2007 2008 2009 2010 2011 2012 2013 2014 2015 2016
Gross Profit
Margin
10.81
%
8.00
%
4.83
%
1.36
%
5.65
%
5.64
%
-
6.85%
3.63
%
8.19
%
8.06
%
Formula:
Gross Profit Margin
Gross Profit
Revenue
2007 2008 2009 2010 2011 2012 2013 2014 2015 2016
10.81%
8.00%
4.83%
1.36%
5.65% 5.64%
-6.85%
3.63%
8.19% 8.06%
Gross Profit Margin
Figure 4: Gross Profit Margin
(Source: As Created by Author)
Net Profit Margin:
Boral Ltd 2007 2008 2009 2010 2011 2012 2013 2014 2015 2016
Net Profit
Margin
5.86
%
4.68
%
2.92
%
-
2.01%
3.57
%
3.74
%
-
4.07%
3.89
%
5.98
%
5.94
%

8MANAGEMENT ACCOUNTING AND STATISTICS
Formula:
Net Profit Margin
Net Profit
Total Revenue
2007 2008 2009 2010 2011 2012 2013 2014 2015 2016
5.86%
4.68%
2.92%
-2.01%
3.57% 3.74%
-4.07%
3.89%
5.98% 5.94%
Net Profit Margin
Figure 5: Net Profit Margin
(Source: As Created by Author)
Adelaide Brighton Ltd:
Return on Assets:
Adelaide
Brighton Ltd 2007 2008 2009 2010 2011 2012 2013 2014 2015 2016
Return on
Assets
12.07
%
11.44
%
12.44
%
15.18
%
14.18
%
12.94
%
12.79
%
12.80
%
15.56
%
13.96
%
Formula:
Return On Assets
Ratio
Net Income Before Interest and Tax
Total Assets
Formula:
Net Profit Margin
Net Profit
Total Revenue
2007 2008 2009 2010 2011 2012 2013 2014 2015 2016
5.86%
4.68%
2.92%
-2.01%
3.57% 3.74%
-4.07%
3.89%
5.98% 5.94%
Net Profit Margin
Figure 5: Net Profit Margin
(Source: As Created by Author)
Adelaide Brighton Ltd:
Return on Assets:
Adelaide
Brighton Ltd 2007 2008 2009 2010 2011 2012 2013 2014 2015 2016
Return on
Assets
12.07
%
11.44
%
12.44
%
15.18
%
14.18
%
12.94
%
12.79
%
12.80
%
15.56
%
13.96
%
Formula:
Return On Assets
Ratio
Net Income Before Interest and Tax
Total Assets
⊘ This is a preview!⊘
Do you want full access?
Subscribe today to unlock all pages.

Trusted by 1+ million students worldwide

9MANAGEMENT ACCOUNTING AND STATISTICS
2007 2008 2009 2010 2011 2012 2013 2014 2015 2016
12.07% 11.44% 12.44%
15.18% 14.18%
12.94% 12.79% 12.80%
15.56%
13.96%
Return on Assets
Figure 1: Return on Assets
(Source: As Created by Author)
Return on Investment:
Adelaide Brighton
Ltd 2007 2008 2009 2010 2011 2012 2013 2014 2015 2016
Return on
Investment
6.29
%
6.00
%
6.80
%
8.75
%
7.51
%
6.91
%
6.84
%
6.94
%
8.41
%
7.64
%
Formula:
Return On Investment
Net Profit
Investment Capital
Paraphrase This Document
Need a fresh take? Get an instant paraphrase of this document with our AI Paraphraser

10MANAGEMENT ACCOUNTING AND STATISTICS
2007 2008 2009 2010 2011 2012 2013 2014 2015 2016
6.29% 6.00%
6.80%
8.75%
7.51% 6.91% 6.84% 6.94%
8.41%
7.64%
Return on Investment
Figure 2: Return on Investment
(Source: As Created by Author)
Return on Equity:
Adelaide
Brighton Ltd 2007 2008 2009 2010 2011 2012 2013 2014 2015 2016
Return on Equity
17.11
%
17.72
%
15.46
%
16.60
%
15.74
%
15.74
%
14.64
%
15.75
%
17.78
%
15.38
%
Formula:
Return on Equity
Net Income
Shareholders’ Equity
2007 2008 2009 2010 2011 2012 2013 2014 2015 2016
6.29% 6.00%
6.80%
8.75%
7.51% 6.91% 6.84% 6.94%
8.41%
7.64%
Return on Investment
Figure 2: Return on Investment
(Source: As Created by Author)
Return on Equity:
Adelaide
Brighton Ltd 2007 2008 2009 2010 2011 2012 2013 2014 2015 2016
Return on Equity
17.11
%
17.72
%
15.46
%
16.60
%
15.74
%
15.74
%
14.64
%
15.75
%
17.78
%
15.38
%
Formula:
Return on Equity
Net Income
Shareholders’ Equity

11MANAGEMENT ACCOUNTING AND STATISTICS
2007 2008 2009 2010 2011 2012 2013 2014 2015 2016
17.11% 17.72%
15.46% 16.60% 15.74% 15.74% 14.64% 15.75%
17.78%
15.38%
Return on Equity
Figure 3: Return on Equity
(Source: As Created by Author)
Gross Profit Margin:
Adelaide
Brighton Ltd 2007 2008 2009 2010 2011
201
2 2013 2014 2015 2016
Gross Profit
Margin
21.83
%
22.04
%
21.81
%
24.40
%
23.43
%
39
%
39.15
%
38.47
%
37.35
%
36.44
%
Formula:
Gross Profit Margin
Gross Profit
Revenue
2007 2008 2009 2010 2011 2012 2013 2014 2015 2016
17.11% 17.72%
15.46% 16.60% 15.74% 15.74% 14.64% 15.75%
17.78%
15.38%
Return on Equity
Figure 3: Return on Equity
(Source: As Created by Author)
Gross Profit Margin:
Adelaide
Brighton Ltd 2007 2008 2009 2010 2011
201
2 2013 2014 2015 2016
Gross Profit
Margin
21.83
%
22.04
%
21.81
%
24.40
%
23.43
%
39
%
39.15
%
38.47
%
37.35
%
36.44
%
Formula:
Gross Profit Margin
Gross Profit
Revenue
⊘ This is a preview!⊘
Do you want full access?
Subscribe today to unlock all pages.

Trusted by 1+ million students worldwide
1 out of 36
Related Documents

Your All-in-One AI-Powered Toolkit for Academic Success.
+13062052269
info@desklib.com
Available 24*7 on WhatsApp / Email
Unlock your academic potential
Copyright © 2020–2025 A2Z Services. All Rights Reserved. Developed and managed by ZUCOL.