Financial Performance and Valuation Analysis Report - BABS4 Module
VerifiedAdded on 2022/12/17
|16
|3639
|23
Report
AI Summary
This report, prepared for a Financial Management and Analysis module, provides a comprehensive analysis of a company's financial performance. It begins with a detailed profitability, liquidity, solvency, efficiency, and investment ratio analysis, comparing data over two years and interpreting the trends. The report then addresses the limitations of ratio analysis and offers recommendations for improvement. Furthermore, it delves into investment appraisal techniques, calculating payback periods, net present values (NPV), and internal rates of return (IRR) for different investment choices, ultimately recommending the best option. The report continues with a discussion of rights issues, calculating theoretical ex-rights prices, values of rights, and their impact on shareholder wealth. It also covers company valuation, using market capitalization, net asset value, and price-earnings ratios, alongside an analysis of dividend growth. Finally, the report examines systematic and unsystematic risk and their impact on businesses, and concludes with a recommendation to acquire a company based on price-earnings ratio. The assignment provides a detailed financial analysis and valuation, offering insights into various financial concepts.

FINANCIAL MANAGEMENT AND ANALYSIS
Paraphrase This Document
Need a fresh take? Get an instant paraphrase of this document with our AI Paraphraser
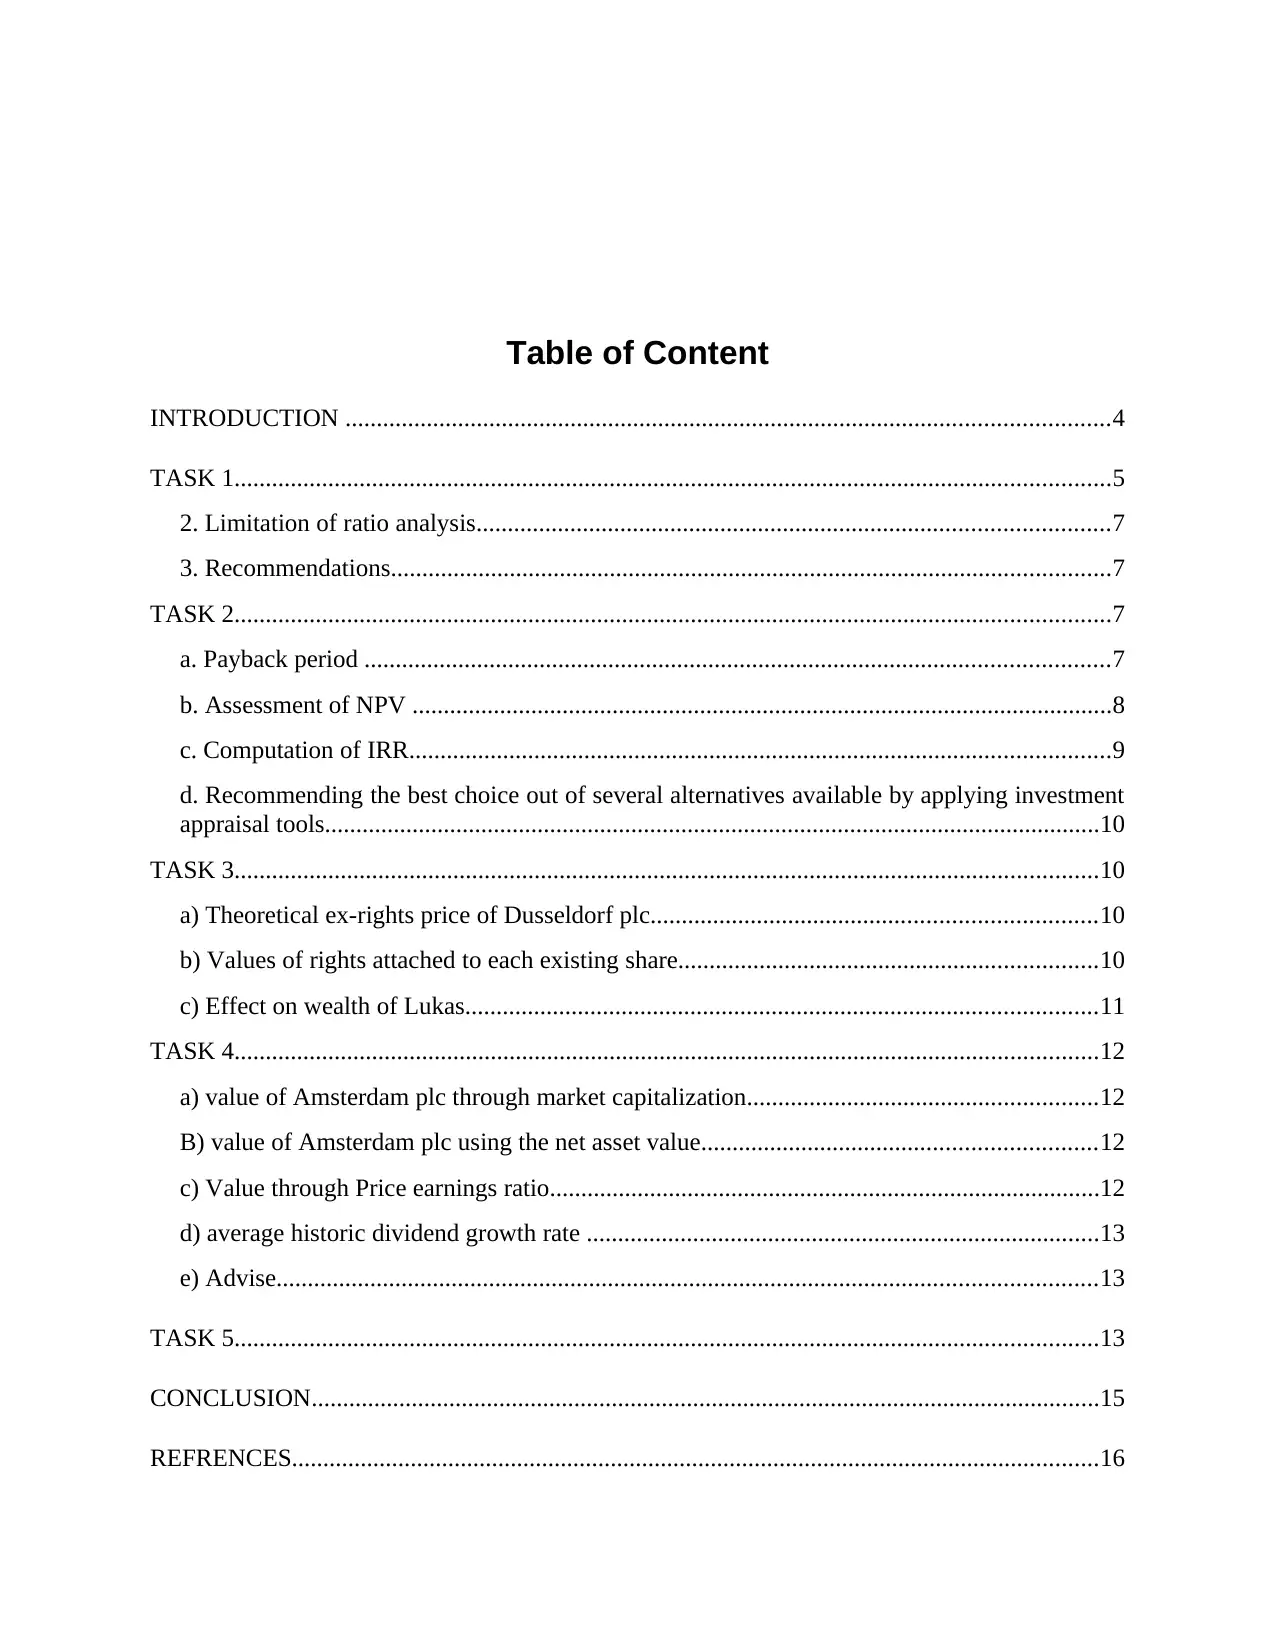
Table of Content
INTRODUCTION ..........................................................................................................................4
TASK 1............................................................................................................................................5
2. Limitation of ratio analysis.....................................................................................................7
3. Recommendations...................................................................................................................7
TASK 2............................................................................................................................................7
a. Payback period .......................................................................................................................7
b. Assessment of NPV ................................................................................................................8
c. Computation of IRR................................................................................................................9
d. Recommending the best choice out of several alternatives available by applying investment
appraisal tools............................................................................................................................10
TASK 3..........................................................................................................................................10
a) Theoretical ex-rights price of Dusseldorf plc.......................................................................10
b) Values of rights attached to each existing share...................................................................10
c) Effect on wealth of Lukas.....................................................................................................11
TASK 4..........................................................................................................................................12
a) value of Amsterdam plc through market capitalization........................................................12
B) value of Amsterdam plc using the net asset value...............................................................12
c) Value through Price earnings ratio........................................................................................12
d) average historic dividend growth rate ..................................................................................13
e) Advise...................................................................................................................................13
TASK 5..........................................................................................................................................13
CONCLUSION..............................................................................................................................15
REFRENCES.................................................................................................................................16
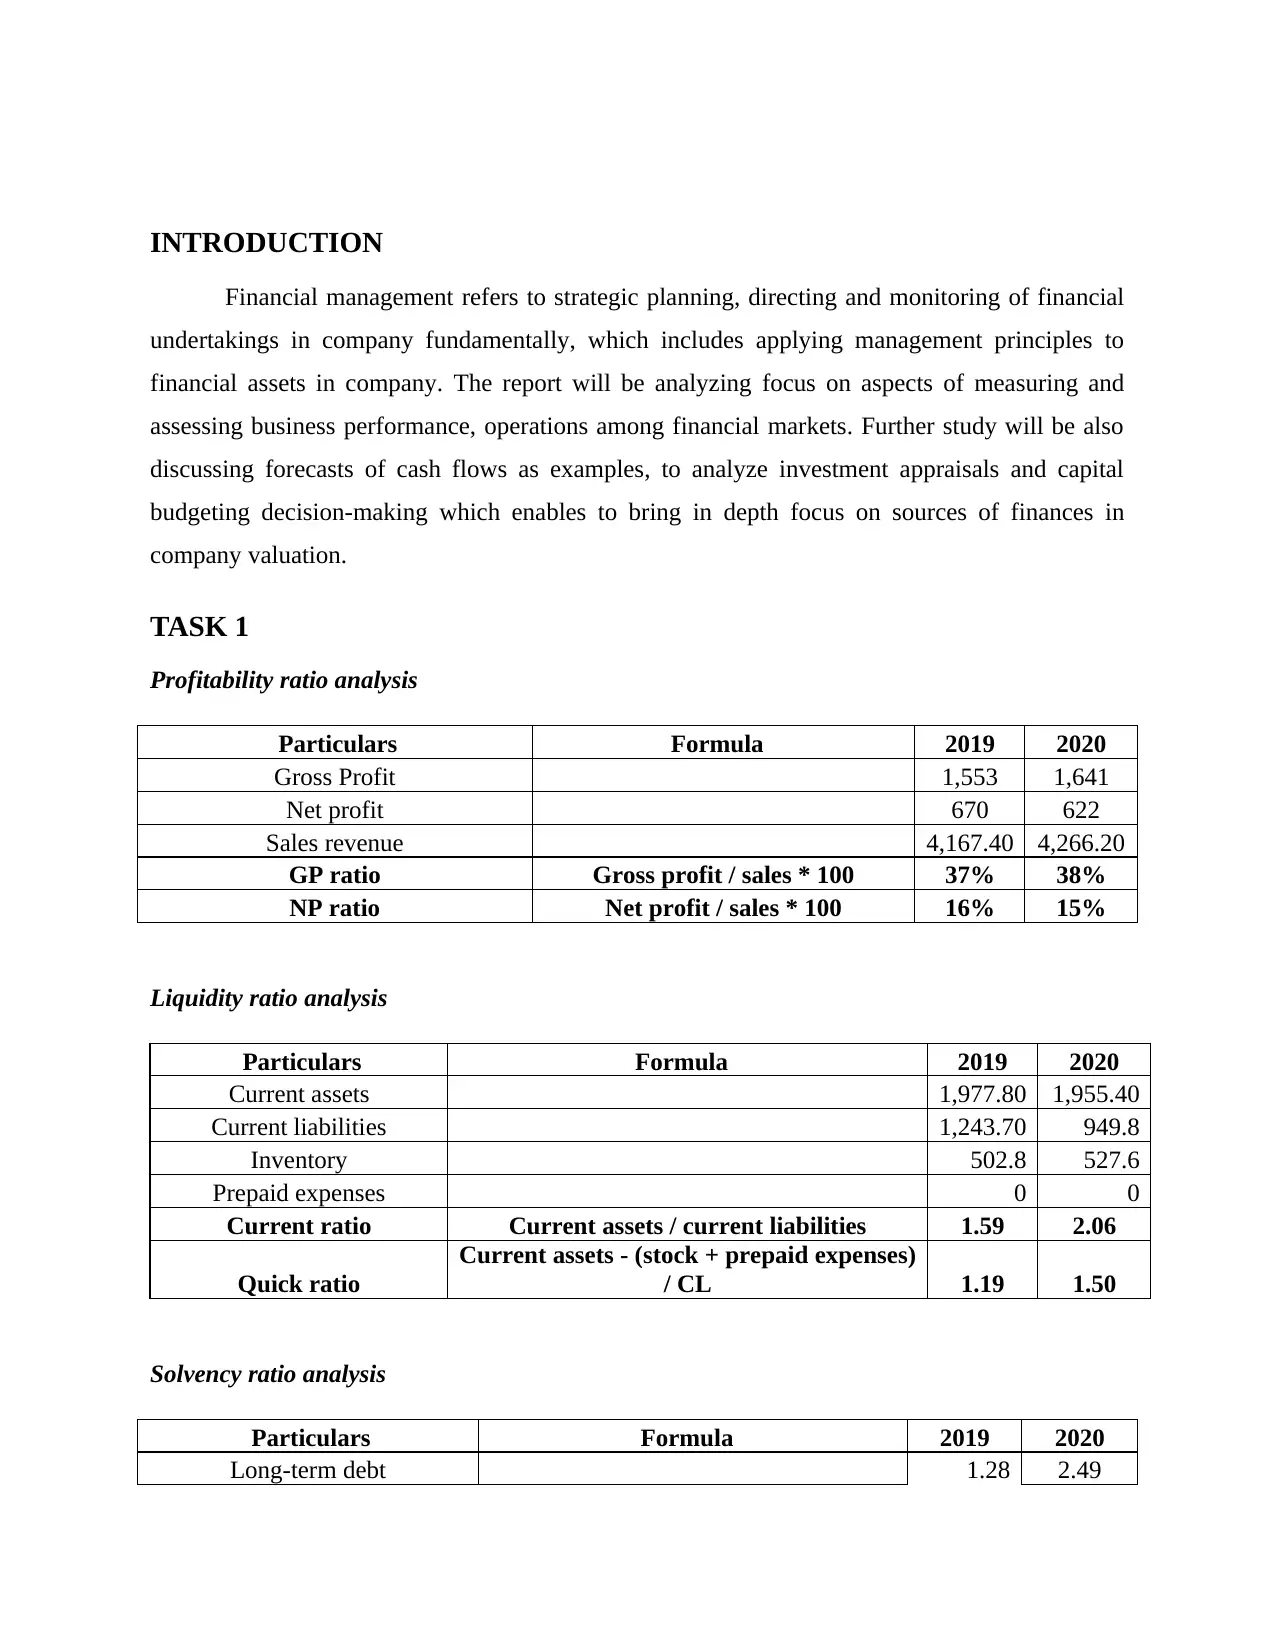
INTRODUCTION
Financial management refers to strategic planning, directing and monitoring of financial
undertakings in company fundamentally, which includes applying management principles to
financial assets in company. The report will be analyzing focus on aspects of measuring and
assessing business performance, operations among financial markets. Further study will be also
discussing forecasts of cash flows as examples, to analyze investment appraisals and capital
budgeting decision-making which enables to bring in depth focus on sources of finances in
company valuation.
TASK 1
Profitability ratio analysis
Particulars Formula 2019 2020
Gross Profit 1,553 1,641
Net profit 670 622
Sales revenue 4,167.40 4,266.20
GP ratio Gross profit / sales * 100 37% 38%
NP ratio Net profit / sales * 100 16% 15%
Liquidity ratio analysis
Particulars Formula 2019 2020
Current assets 1,977.80 1,955.40
Current liabilities 1,243.70 949.8
Inventory 502.8 527.6
Prepaid expenses 0 0
Current ratio Current assets / current liabilities 1.59 2.06
Quick ratio
Current assets - (stock + prepaid expenses)
/ CL 1.19 1.50
Solvency ratio analysis
Particulars Formula 2019 2020
Long-term debt 1.28 2.49
⊘ This is a preview!⊘
Do you want full access?
Subscribe today to unlock all pages.
Trusted by 1+ million students worldwide
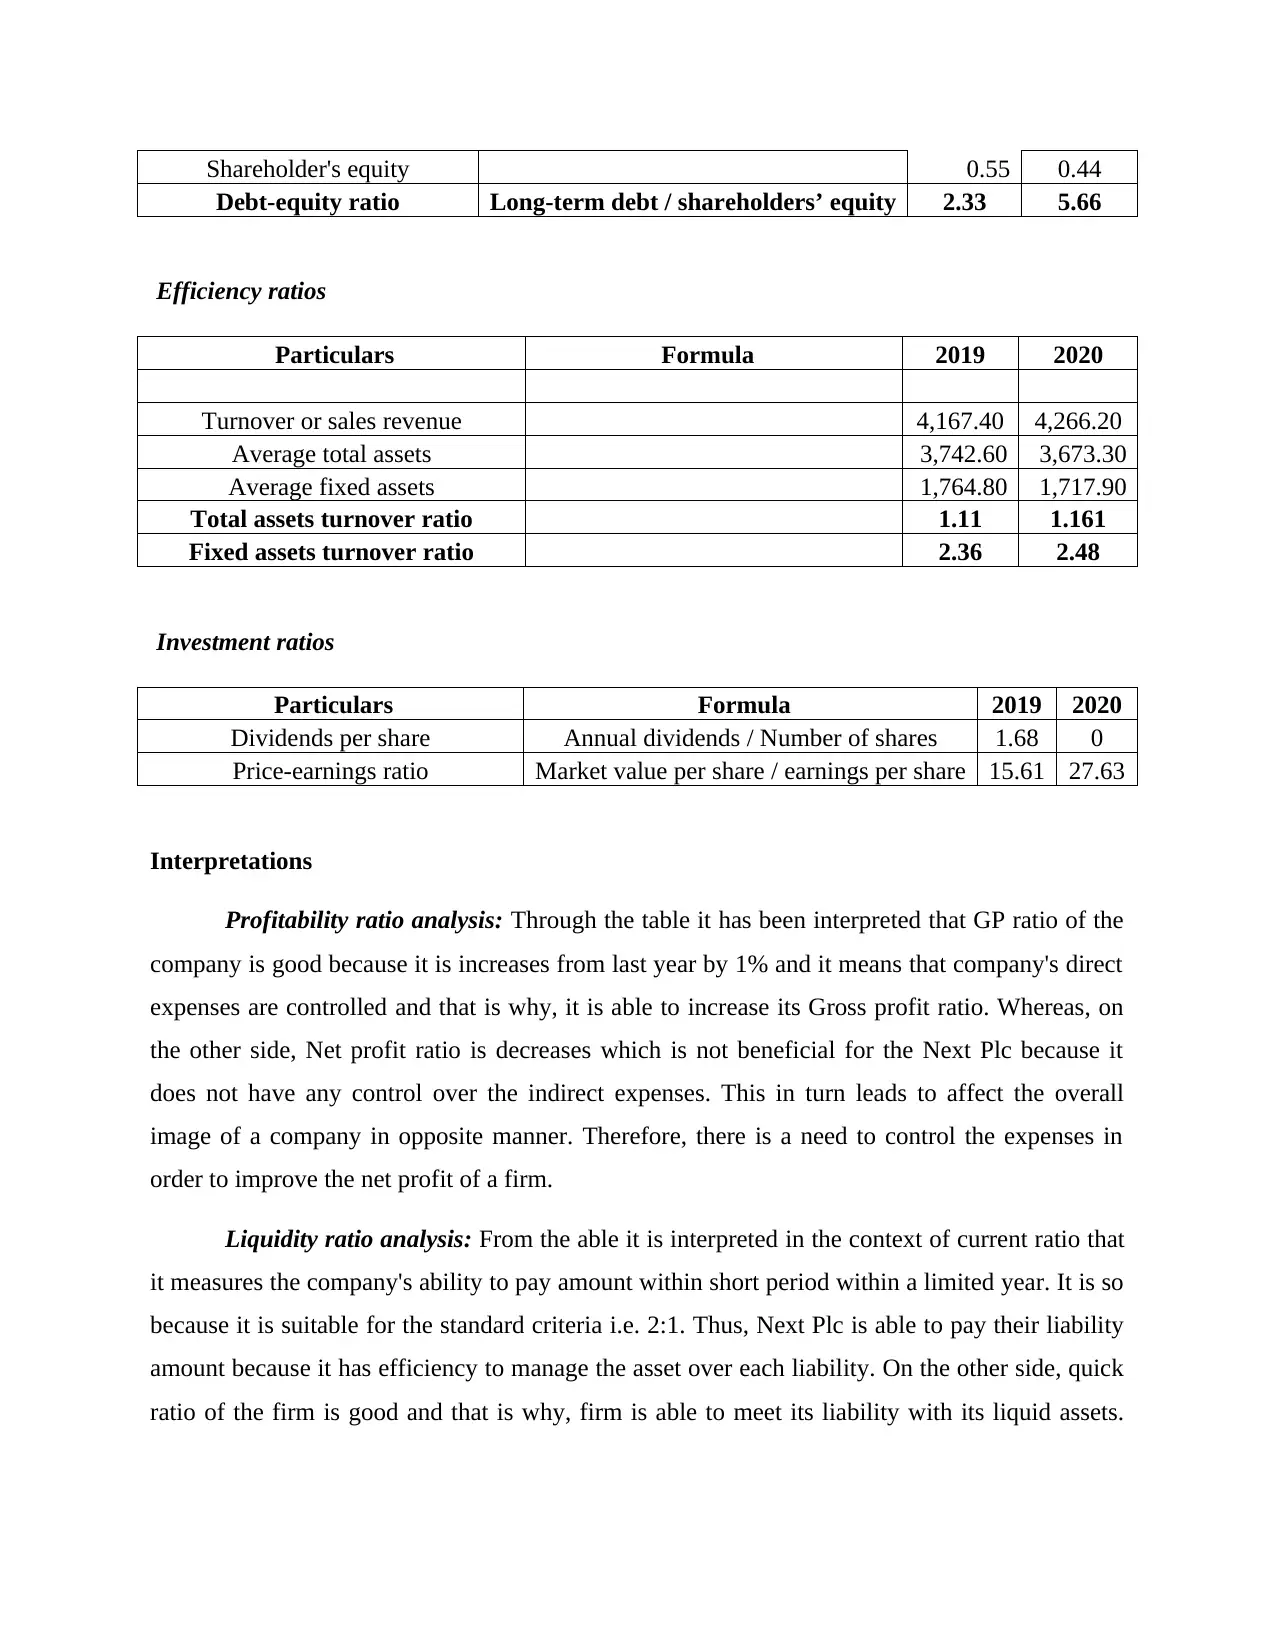
Shareholder's equity 0.55 0.44
Debt-equity ratio Long-term debt / shareholders’ equity 2.33 5.66
Efficiency ratios
Particulars Formula 2019 2020
Turnover or sales revenue 4,167.40 4,266.20
Average total assets 3,742.60 3,673.30
Average fixed assets 1,764.80 1,717.90
Total assets turnover ratio 1.11 1.161
Fixed assets turnover ratio 2.36 2.48
Investment ratios
Particulars Formula 2019 2020
Dividends per share Annual dividends / Number of shares 1.68 0
Price-earnings ratio Market value per share / earnings per share 15.61 27.63
Interpretations
Profitability ratio analysis: Through the table it has been interpreted that GP ratio of the
company is good because it is increases from last year by 1% and it means that company's direct
expenses are controlled and that is why, it is able to increase its Gross profit ratio. Whereas, on
the other side, Net profit ratio is decreases which is not beneficial for the Next Plc because it
does not have any control over the indirect expenses. This in turn leads to affect the overall
image of a company in opposite manner. Therefore, there is a need to control the expenses in
order to improve the net profit of a firm.
Liquidity ratio analysis: From the able it is interpreted in the context of current ratio that
it measures the company's ability to pay amount within short period within a limited year. It is so
because it is suitable for the standard criteria i.e. 2:1. Thus, Next Plc is able to pay their liability
amount because it has efficiency to manage the asset over each liability. On the other side, quick
ratio of the firm is good and that is why, firm is able to meet its liability with its liquid assets.
Paraphrase This Document
Need a fresh take? Get an instant paraphrase of this document with our AI Paraphraser
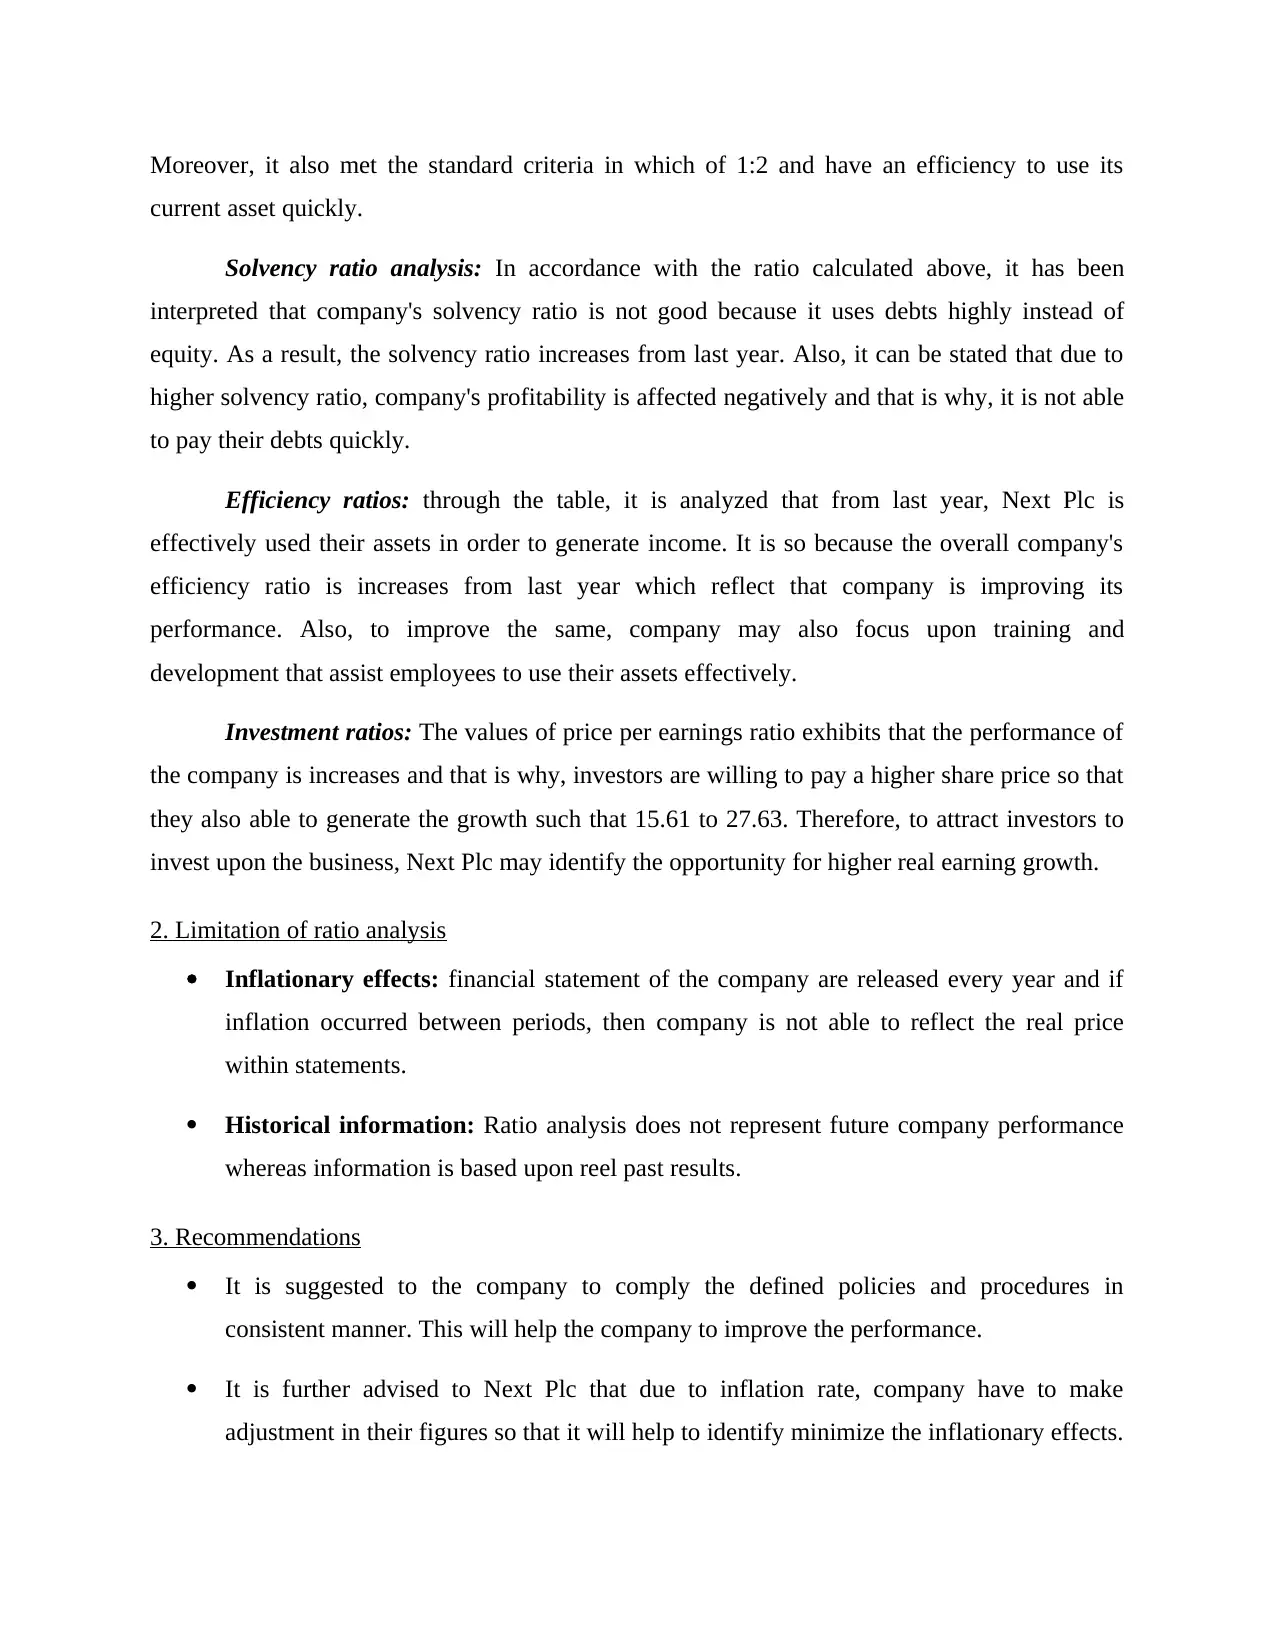
Moreover, it also met the standard criteria in which of 1:2 and have an efficiency to use its
current asset quickly.
Solvency ratio analysis: In accordance with the ratio calculated above, it has been
interpreted that company's solvency ratio is not good because it uses debts highly instead of
equity. As a result, the solvency ratio increases from last year. Also, it can be stated that due to
higher solvency ratio, company's profitability is affected negatively and that is why, it is not able
to pay their debts quickly.
Efficiency ratios: through the table, it is analyzed that from last year, Next Plc is
effectively used their assets in order to generate income. It is so because the overall company's
efficiency ratio is increases from last year which reflect that company is improving its
performance. Also, to improve the same, company may also focus upon training and
development that assist employees to use their assets effectively.
Investment ratios: The values of price per earnings ratio exhibits that the performance of
the company is increases and that is why, investors are willing to pay a higher share price so that
they also able to generate the growth such that 15.61 to 27.63. Therefore, to attract investors to
invest upon the business, Next Plc may identify the opportunity for higher real earning growth.
2. Limitation of ratio analysis
Inflationary effects: financial statement of the company are released every year and if
inflation occurred between periods, then company is not able to reflect the real price
within statements.
Historical information: Ratio analysis does not represent future company performance
whereas information is based upon reel past results.
3. Recommendations
It is suggested to the company to comply the defined policies and procedures in
consistent manner. This will help the company to improve the performance.
It is further advised to Next Plc that due to inflation rate, company have to make
adjustment in their figures so that it will help to identify minimize the inflationary effects.
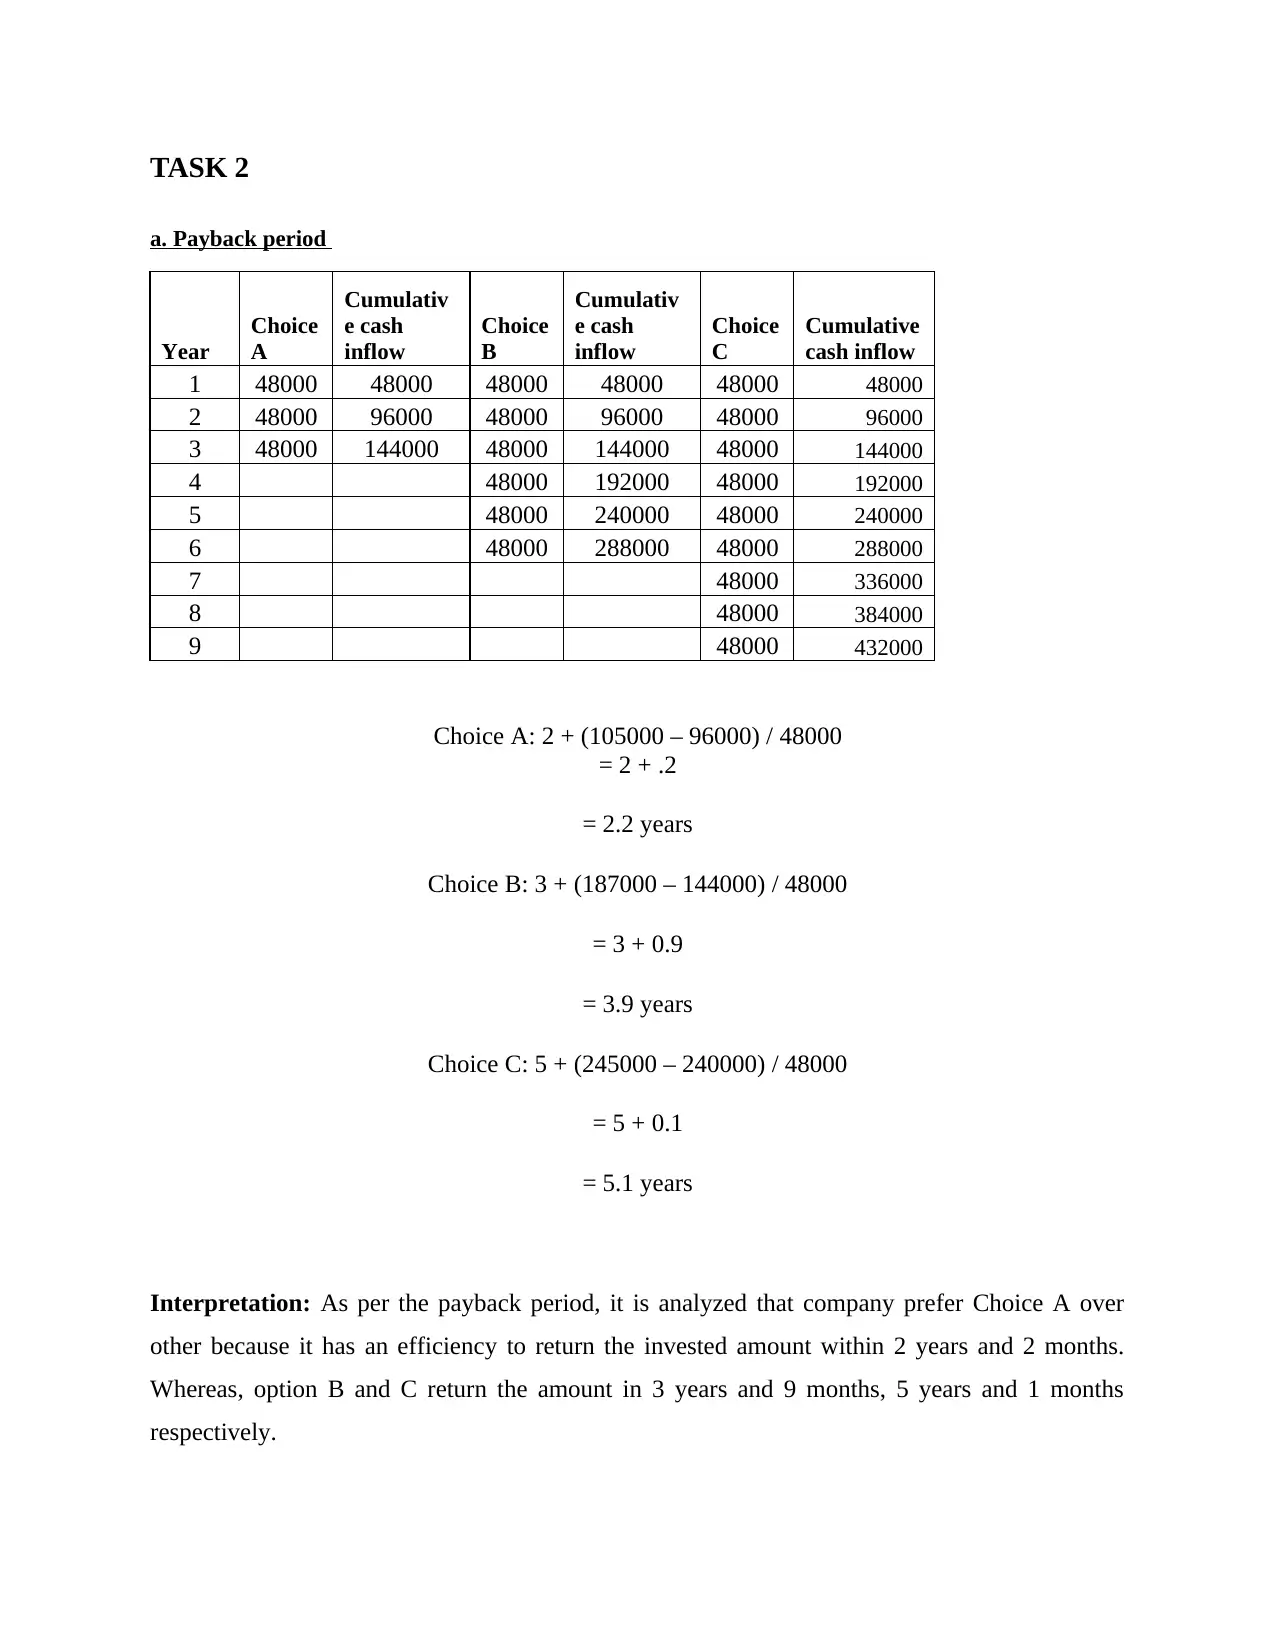
TASK 2
a. Payback period
Year
Choice
A
Cumulativ
e cash
inflow
Choice
B
Cumulativ
e cash
inflow
Choice
C
Cumulative
cash inflow
1 48000 48000 48000 48000 48000 48000
2 48000 96000 48000 96000 48000 96000
3 48000 144000 48000 144000 48000 144000
4 48000 192000 48000 192000
5 48000 240000 48000 240000
6 48000 288000 48000 288000
7 48000 336000
8 48000 384000
9 48000 432000
Choice A: 2 + (105000 – 96000) / 48000
= 2 + .2
= 2.2 years
Choice B: 3 + (187000 – 144000) / 48000
= 3 + 0.9
= 3.9 years
Choice C: 5 + (245000 – 240000) / 48000
= 5 + 0.1
= 5.1 years
Interpretation: As per the payback period, it is analyzed that company prefer Choice A over
other because it has an efficiency to return the invested amount within 2 years and 2 months.
Whereas, option B and C return the amount in 3 years and 9 months, 5 years and 1 months
respectively.
⊘ This is a preview!⊘
Do you want full access?
Subscribe today to unlock all pages.
Trusted by 1+ million students worldwide
b. Assessment of NPV
Years
PV
facto
r
@10
%
Choic
e A
Discount
ed cash
inflows
Choic
e B
Discount
ed cash
inflows
Choic
e C
Discounte
d cash
inflows
1 0.909 48000 43636 48000 43636 48000 43636
2 0.826 48000 39669 48000 39669 48000 39669
3 0.751 48000 36063 48000 36063 48000 36063
4 0.683 48000 32785 48000 32785
5 0.621 48000 29804 48000 29804
6 0.564 48000 27095 48000 27095
7 0.513 48000 24632
8 0.467 48000 22392
9 0.424 48000 20357
Total discounted cash
inflows 119369 209053 276433
Less: Initial investment 105000 187000 245000
NPV 14369 22053 31433
Interpretation: In accordance with the above it is interpreted that NPV value of Choice A, B
and C is 14369, 22053 and 31433 respectively. Therefore, as per the standard criteria, it is
analyzed that company prefer those choice who has ability to generate high NPV value. That is
why, option C can be used by the Brussels plc for investment purpose.
c. Computation of IRR
Years
Choice
A
Choice
B
Choice
C
0
-
105000
-
187000
-
245000
1 48000 48000 48000
2 48000 48000 48000
3 48000 48000 48000
4 48000 48000
5 48000 48000
6 48000 48000
7 48000
Years
PV
facto
r
@10
%
Choic
e A
Discount
ed cash
inflows
Choic
e B
Discount
ed cash
inflows
Choic
e C
Discounte
d cash
inflows
1 0.909 48000 43636 48000 43636 48000 43636
2 0.826 48000 39669 48000 39669 48000 39669
3 0.751 48000 36063 48000 36063 48000 36063
4 0.683 48000 32785 48000 32785
5 0.621 48000 29804 48000 29804
6 0.564 48000 27095 48000 27095
7 0.513 48000 24632
8 0.467 48000 22392
9 0.424 48000 20357
Total discounted cash
inflows 119369 209053 276433
Less: Initial investment 105000 187000 245000
NPV 14369 22053 31433
Interpretation: In accordance with the above it is interpreted that NPV value of Choice A, B
and C is 14369, 22053 and 31433 respectively. Therefore, as per the standard criteria, it is
analyzed that company prefer those choice who has ability to generate high NPV value. That is
why, option C can be used by the Brussels plc for investment purpose.
c. Computation of IRR
Years
Choice
A
Choice
B
Choice
C
0
-
105000
-
187000
-
245000
1 48000 48000 48000
2 48000 48000 48000
3 48000 48000 48000
4 48000 48000
5 48000 48000
6 48000 48000
7 48000
Paraphrase This Document
Need a fresh take? Get an instant paraphrase of this document with our AI Paraphraser
8 48000
9 48000
IRR 18% 14% 13%
Interpretation: As per the above calculations, it is examined that option A has higher IRR
followed by Choice B and C respectively. Thus, it can be stated that Choice A generate the high
profitability for a company and that is why, it is preferred over others.
d. Recommending best choice out of several alternatives available by applying investment
appraisal tools
From all, it is recommended to prefer NPV as best investment appraisal tool because it is
based upon time money value concept and also helps to examine the higher return as compared
to other tools. Therefore, option C is preferred by the firm even though option A has higher
internal rate of return.
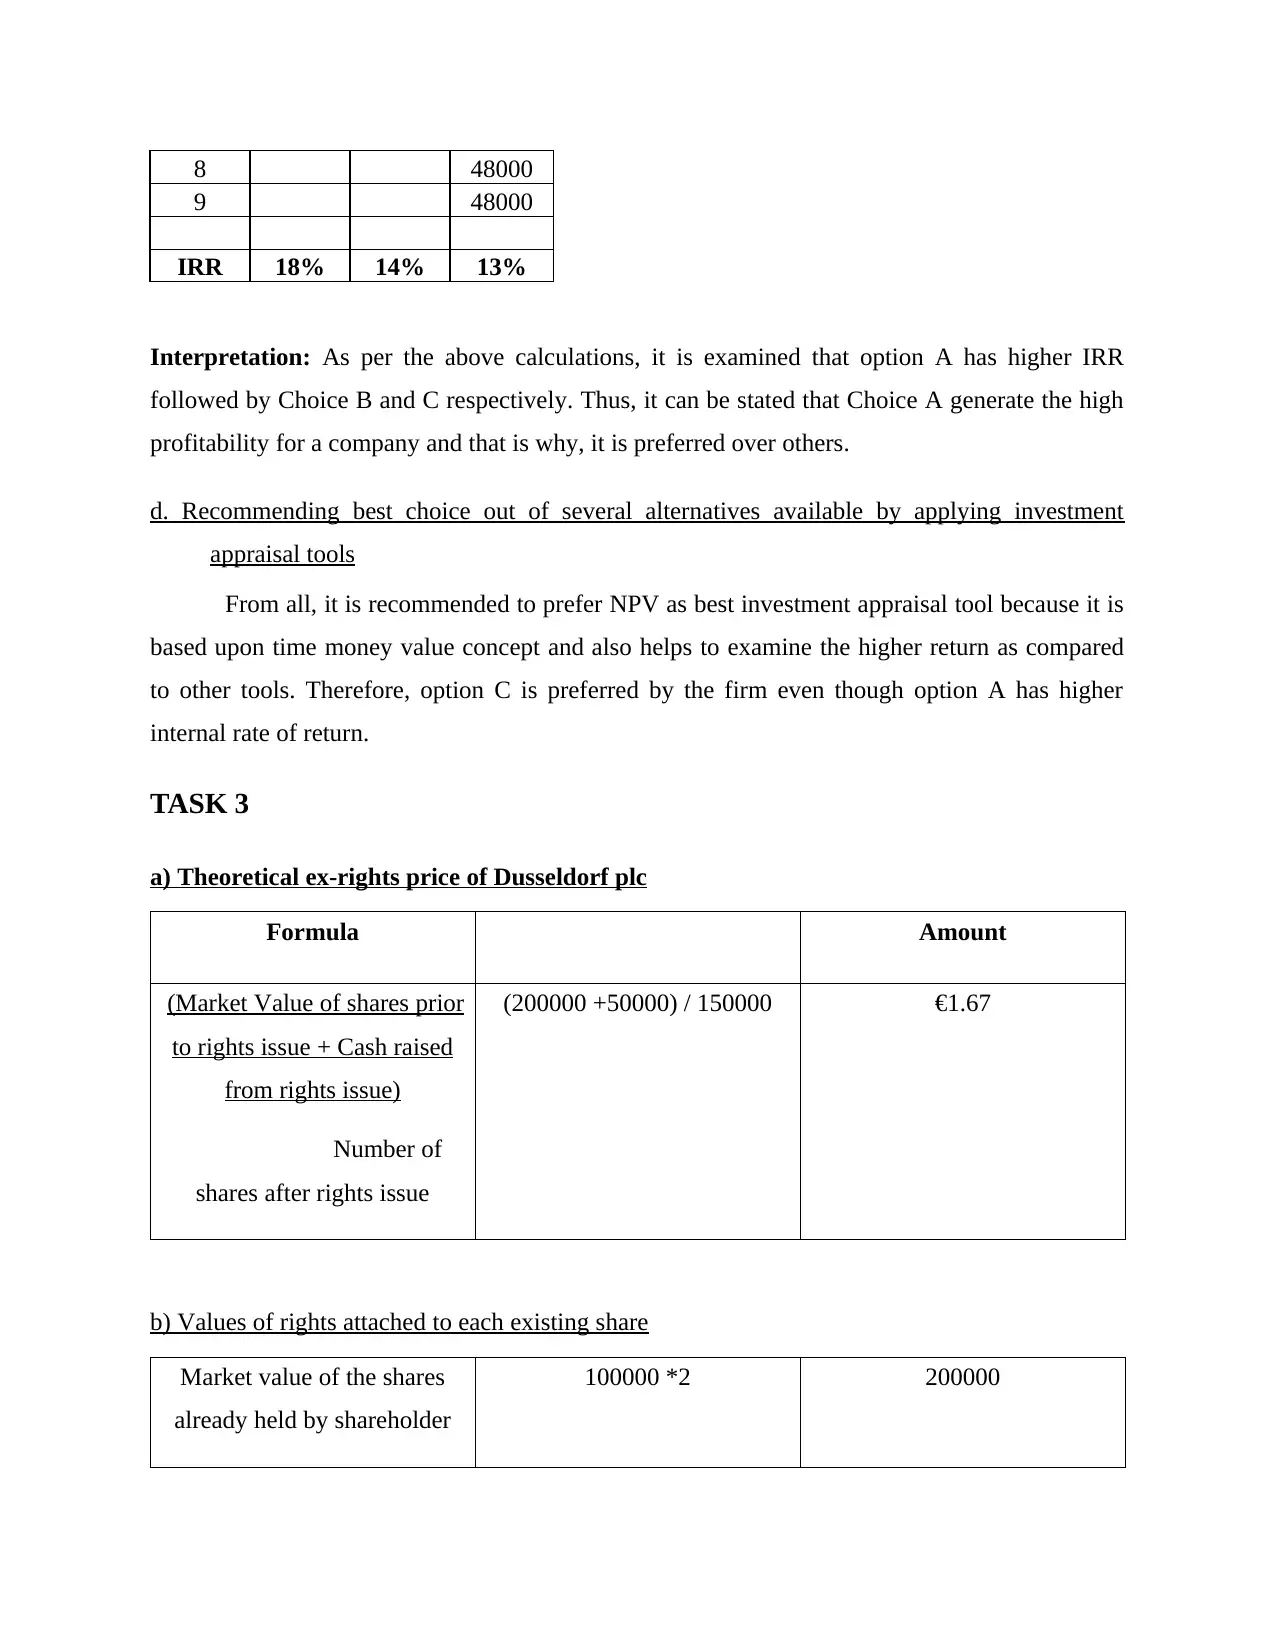
TASK 3
a) Theoretical ex-rights price of Dusseldorf plc
Formula Amount
(Market Value of shares prior
to rights issue + Cash raised
from rights issue)
Number of
shares after rights issue
(200000 +50000) / 150000 €1.67
b) Values of rights attached to each existing share
Market value of the shares
already held by shareholder
100000 *2 200000
9 48000
IRR 18% 14% 13%
Interpretation: As per the above calculations, it is examined that option A has higher IRR
followed by Choice B and C respectively. Thus, it can be stated that Choice A generate the high
profitability for a company and that is why, it is preferred over others.
d. Recommending best choice out of several alternatives available by applying investment
appraisal tools
From all, it is recommended to prefer NPV as best investment appraisal tool because it is
based upon time money value concept and also helps to examine the higher return as compared
to other tools. Therefore, option C is preferred by the firm even though option A has higher
internal rate of return.
TASK 3
a) Theoretical ex-rights price of Dusseldorf plc
Formula Amount
(Market Value of shares prior
to rights issue + Cash raised
from rights issue)
Number of
shares after rights issue
(200000 +50000) / 150000 €1.67
b) Values of rights attached to each existing share
Market value of the shares
already held by shareholder
100000 *2 200000
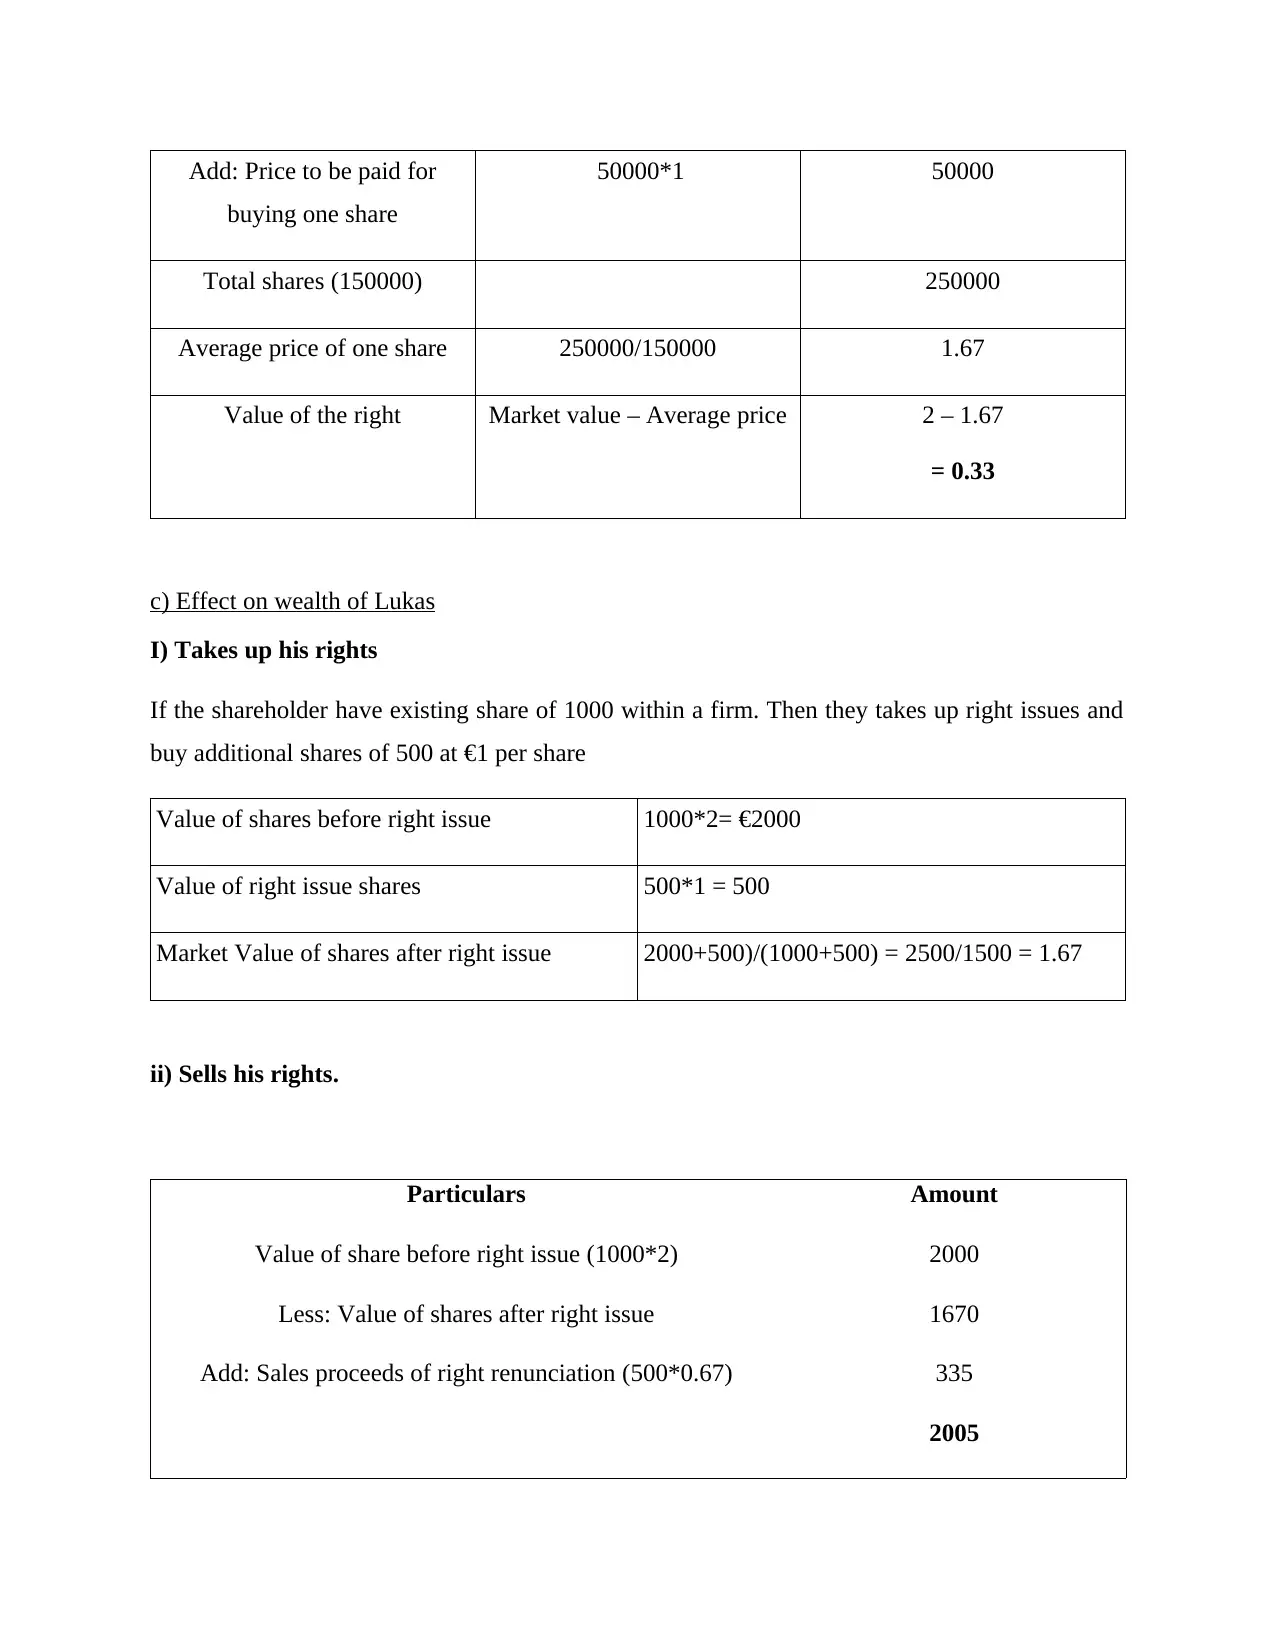
Add: Price to be paid for
buying one share
50000*1 50000
Total shares (150000) 250000
Average price of one share 250000/150000 1.67
Value of the right Market value – Average price 2 – 1.67
= 0.33
c) Effect on wealth of Lukas
I) Takes up his rights
If the shareholder have existing share of 1000 within a firm. Then they takes up right issues and
buy additional shares of 500 at €1 per share
Value of shares before right issue 1000*2= €2000
Value of right issue shares 500*1 = 500
Market Value of shares after right issue 2000+500)/(1000+500) = 2500/1500 = 1.67
ii) Sells his rights.
Particulars Amount
Value of share before right issue (1000*2) 2000
Less: Value of shares after right issue 1670
Add: Sales proceeds of right renunciation (500*0.67) 335
2005
⊘ This is a preview!⊘
Do you want full access?
Subscribe today to unlock all pages.
Trusted by 1+ million students worldwide
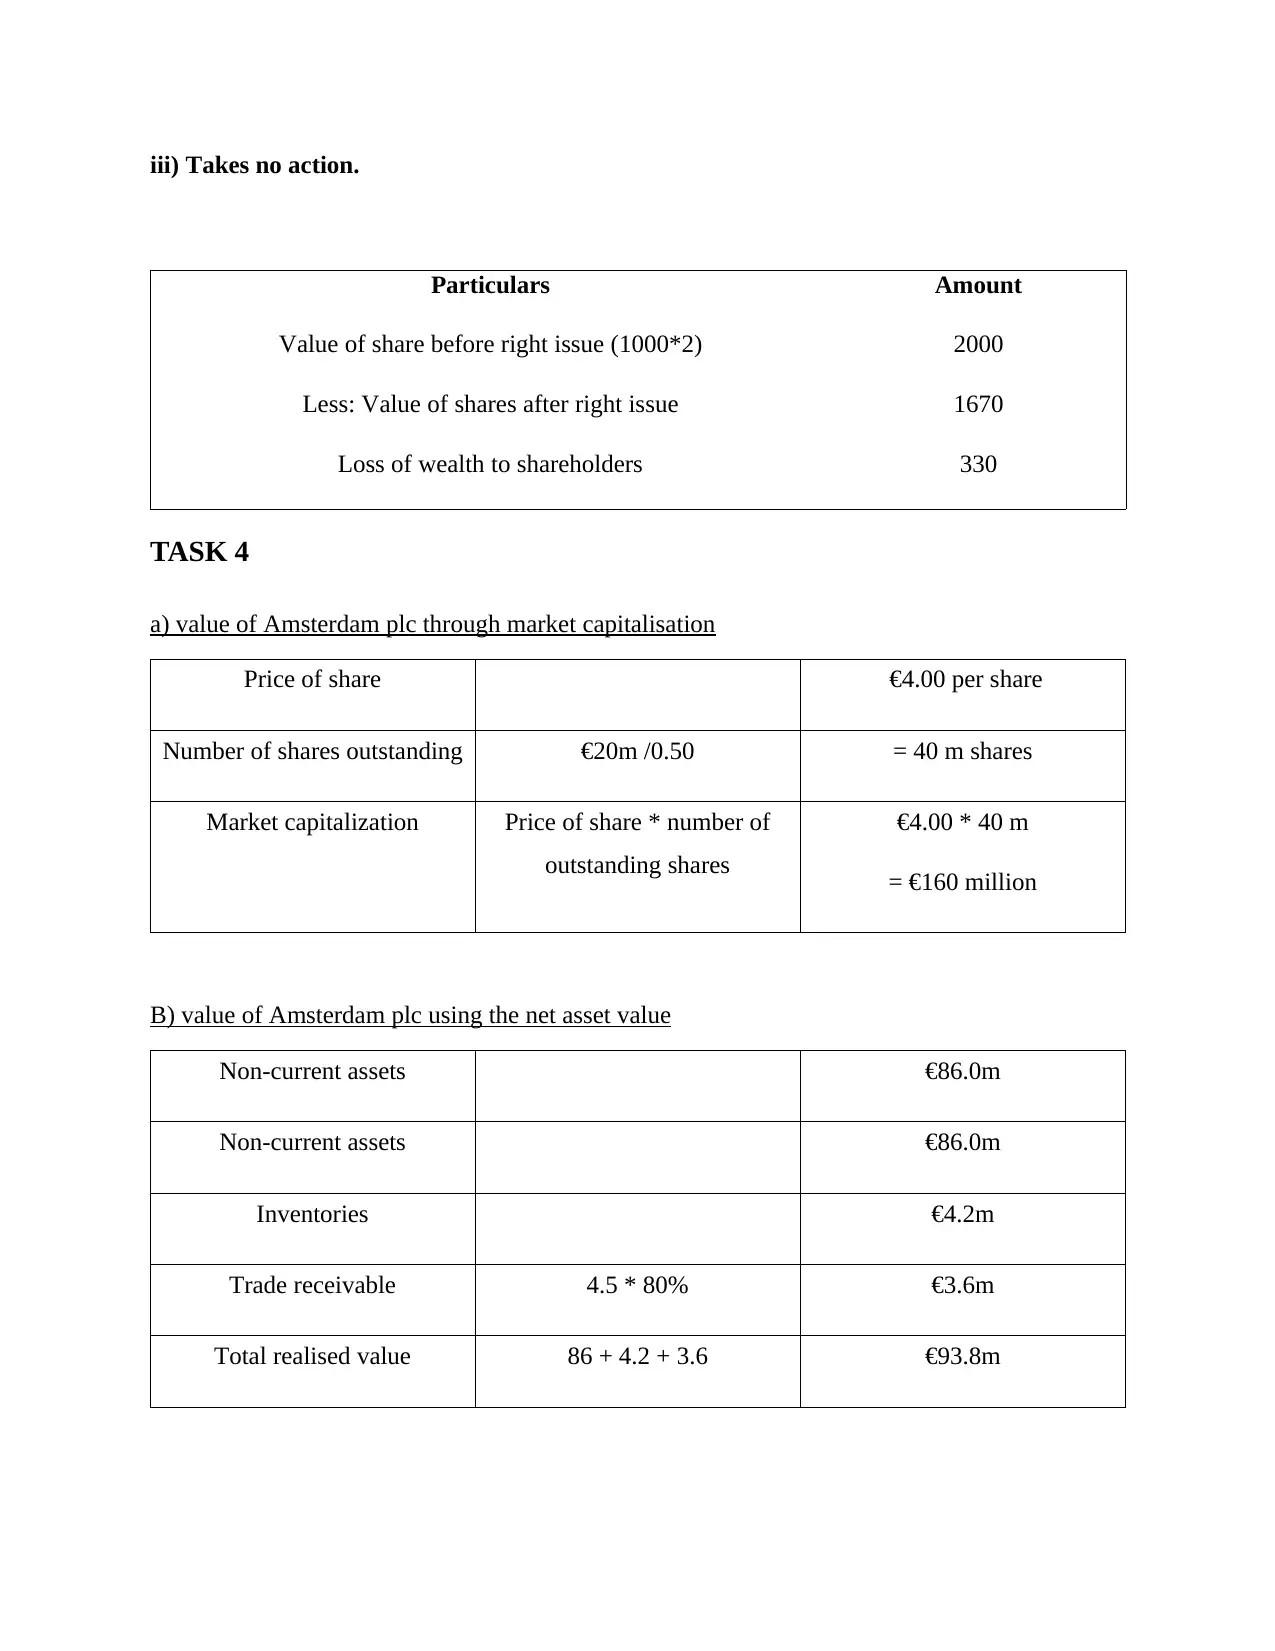
iii) Takes no action.
Particulars Amount
Value of share before right issue (1000*2) 2000
Less: Value of shares after right issue 1670
Loss of wealth to shareholders 330
TASK 4
a) value of Amsterdam plc through market capitalisation
Price of share €4.00 per share
Number of shares outstanding €20m /0.50 = 40 m shares
Market capitalization Price of share * number of
outstanding shares
€4.00 * 40 m
= €160 million
B) value of Amsterdam plc using the net asset value
Non-current assets €86.0m
Non-current assets €86.0m
Inventories €4.2m
Trade receivable 4.5 * 80% €3.6m
Total realised value 86 + 4.2 + 3.6 €93.8m
Paraphrase This Document
Need a fresh take? Get an instant paraphrase of this document with our AI Paraphraser
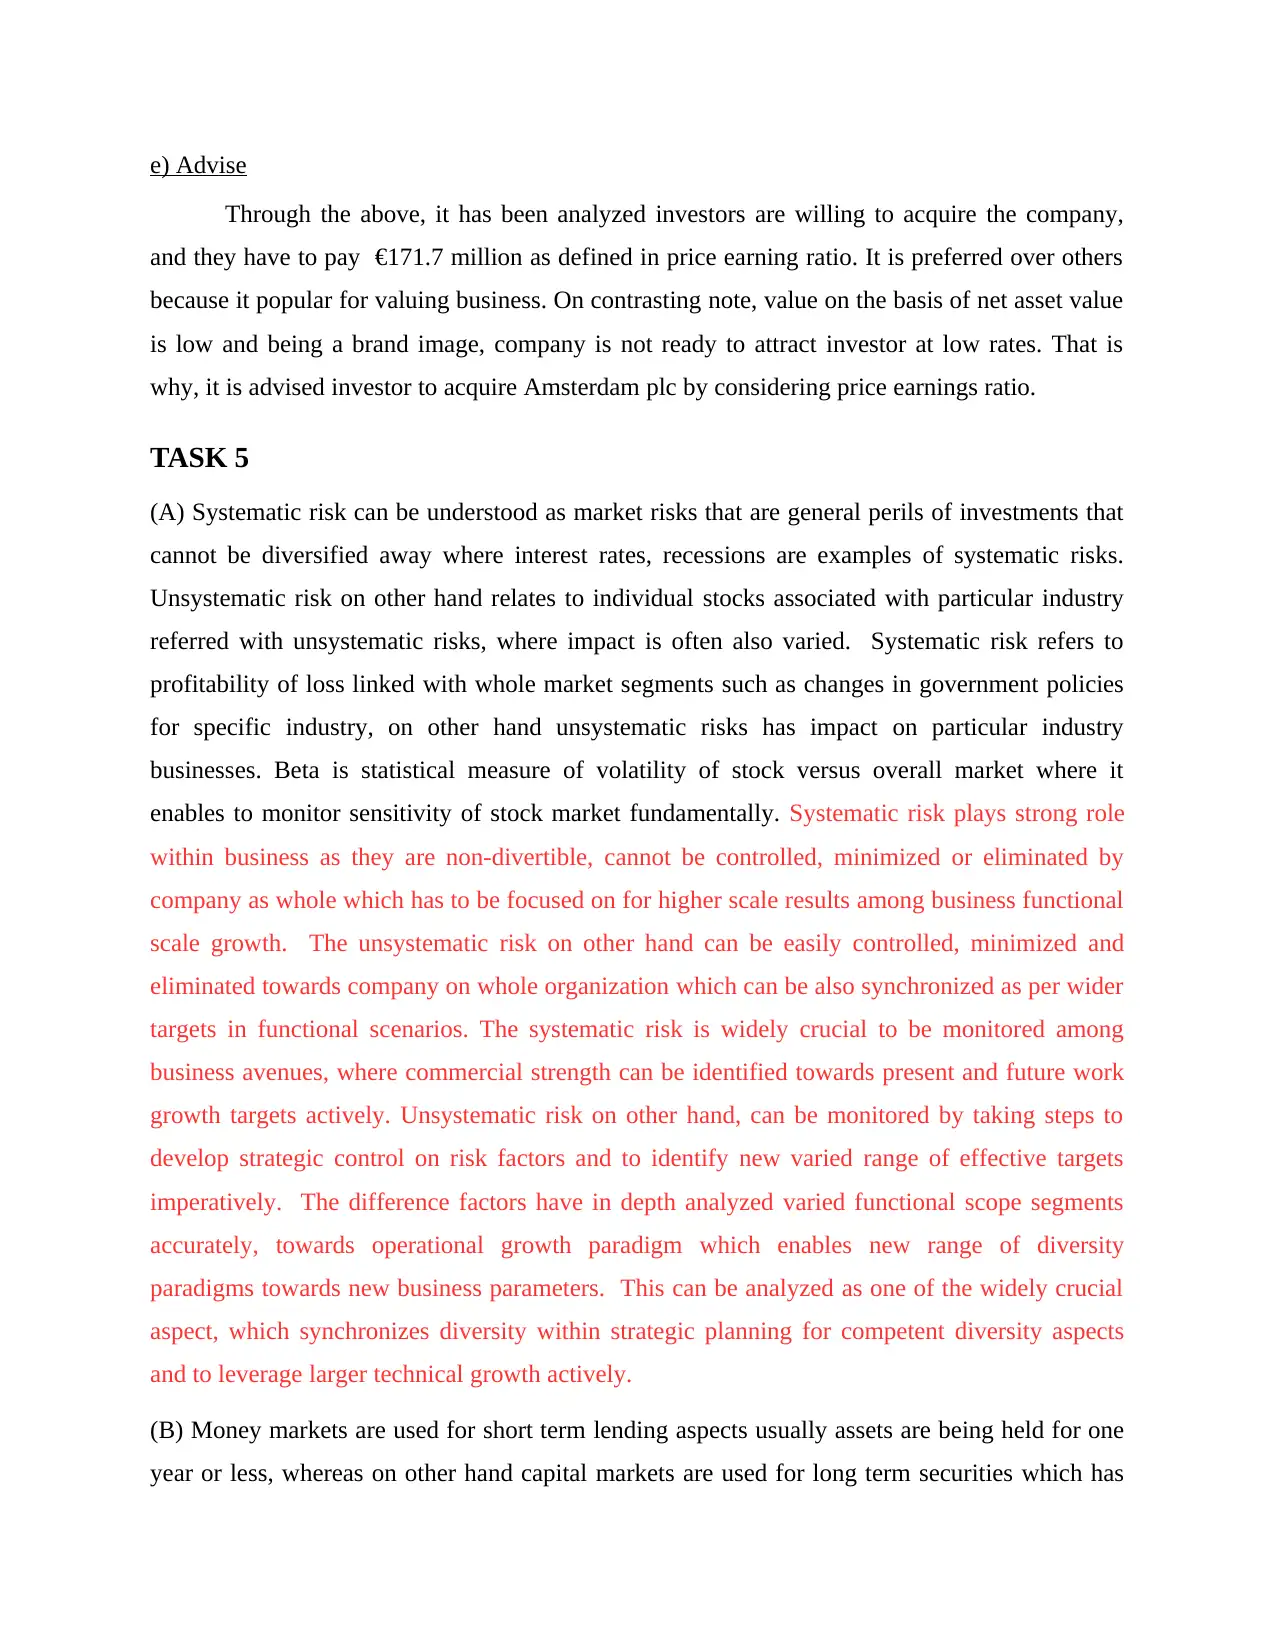
Amount received by the
ordinary shareholders
93.8 – (25+7) €61.8m
Value (Net realisable value –
Amount received by ordinary
shareholders
€61.8m.
c) Value through Price earning ratio
Average price/earning ratio 17 times
Post tax earning of Amsterdam €10.1m
Market value of Amsterdam plc 17 * 10.1
= €171.7m.
d) average historic dividend growth rate
Year Dividend Dividend Growth rate
2016 5
2017 5.2 4.00%
2018 5.6 7.69%
2019 6 7.14%
Average historic dividend
growth rate
4% + 7.69% + 7.14% / 3 = 6.27%.
e) Advise
Through the above, it has been analyzed investors are willing to acquire the company,
and they have to pay €171.7 million as defined in price earning ratio. It is preferred over others
because it popular for valuing business. On contrasting note, value on the basis of net asset value
is low and being a brand image, company is not ready to attract investor at low rates. That is
why, it is advised investor to acquire Amsterdam plc by considering price earnings ratio.
TASK 5
(A) Systematic risk can be understood as market risks that are general perils of investments that
cannot be diversified away where interest rates, recessions are examples of systematic risks.
Unsystematic risk on other hand relates to individual stocks associated with particular industry
referred with unsystematic risks, where impact is often also varied. Systematic risk refers to
profitability of loss linked with whole market segments such as changes in government policies
for specific industry, on other hand unsystematic risks has impact on particular industry
businesses. Beta is statistical measure of volatility of stock versus overall market where it
enables to monitor sensitivity of stock market fundamentally. Systematic risk plays strong role
within business as they are non-divertible, cannot be controlled, minimized or eliminated by
company as whole which has to be focused on for higher scale results among business functional
scale growth. The unsystematic risk on other hand can be easily controlled, minimized and
eliminated towards company on whole organization which can be also synchronized as per wider
targets in functional scenarios. The systematic risk is widely crucial to be monitored among
business avenues, where commercial strength can be identified towards present and future work
growth targets actively. Unsystematic risk on other hand, can be monitored by taking steps to
develop strategic control on risk factors and to identify new varied range of effective targets
imperatively. The difference factors have in depth analyzed varied functional scope segments
accurately, towards operational growth paradigm which enables new range of diversity
paradigms towards new business parameters. This can be analyzed as one of the widely crucial
aspect, which synchronizes diversity within strategic planning for competent diversity aspects
and to leverage larger technical growth actively.
(B) Money markets are used for short term lending aspects usually assets are being held for one
year or less, whereas on other hand capital markets are used for long term securities which has
⊘ This is a preview!⊘
Do you want full access?
Subscribe today to unlock all pages.
Trusted by 1+ million students worldwide
1 out of 16
Related Documents


Your All-in-One AI-Powered Toolkit for Academic Success.
+13062052269
info@desklib.com
Available 24*7 on WhatsApp / Email
![[object Object]](/_next/static/media/star-bottom.7253800d.svg)
Unlock your academic potential
Copyright © 2020–2026 A2Z Services. All Rights Reserved. Developed and managed by ZUCOL.