Comprehensive Management Accounting and Financial Performance Review
VerifiedAdded on 2021/06/17
|13
|1936
|27
Homework Assignment
AI Summary
This management accounting assignment analyzes a company's financial performance using ratio analysis, trend analysis, and cash flow budgeting. The solution examines profitability, financial stability, and asset utilization ratios, comparing performance over multiple years. It includes calculations for key financial metrics such as operating profit margin, return on assets, and debt-to-equity ratio. Furthermore, the assignment covers cash budgeting, forecasting cash receipts and payments, and creating sales and purchase budgets. The document also discusses variance analysis, highlighting its role in monitoring and controlling costs. Finally, it offers insights into the limitations of ratio analysis and variance analysis while providing a comprehensive overview of the company's financial health and future cash needs.

MANAGEMENT ACCOUNTING
Paraphrase This Document
Need a fresh take? Get an instant paraphrase of this document with our AI Paraphraser
Contents
Solution 1:..................................................................................................................................3
Solution 1.1:...........................................................................................................................3
Solution 1.2:...........................................................................................................................5
Solution 1.3:...........................................................................................................................7
Solution 2:..................................................................................................................................9
Solution 2.1:...........................................................................................................................9
Solution 2.2:.........................................................................................................................11
Solution 1:
Solution 1.1:
a. Ratio analysis helps provide an insight into the financial performance of the company.
In the given case we are provided with some ratios of company for two financial
years, from which we need to determine the credit worthiness of the company. From
the ratio analysis of two years we can see that the company has earned lower profits in
the current year, nut the liquidity position of the company is in a good state. The
benchmark for current ratio is 2 and the company has the ratio of 2.1. This shows high
liquidity and availability of funds for repayment of loan. The ratios paint a kind of
favourable picture for the credit worthiness of the company, but taking the decision
solely based on ratios will not be correct. it is important that we consider qualitative
information regarding company also, in order to have a complete picture. It is
important we also see other aspects of the business so that its real position can be
understood.
b. The above ratios give us an idea of the liquidity and profitability of the company.
there are few other ratios too which will help us analyse the company’s worth:
- Debt to equity ratio: this ratio helps us calculate the ratio of debt and equity
involved in the capital structure. This gives us the idea on how much debt is
already used by the company. Taking the general capital structure of the industry
to which company belongs we can see if more debt would be suitable for the
company or not. Based on the existing debt history of the company, the repayment
history can be analysed for future performance of the company.
- Interest coverage ratio: the interest coverage ratio helps us analyse the earnings
of the company. It helps us evaluate the company’s ability to earn eng profits to
pay back the interest accrued. This ratio calculates the number of times is the
earnings of the interest expense. Higher the ratio better it is. It is important to
check the company’s profitability before sanctioning of any loan. The company
should have a secure financial health so that it can secure the lenders of the
repayment of loan and interest expense. (Atkinson, 2012)
- Debtor turnover ratio: this is a kind of efficiency ratio that will help us
understand the cash flow of the company from its debtor. Higher turnover ratios
indicate that the company will have its fund stuck with the debtors for higher
⊘ This is a preview!⊘
Do you want full access?
Subscribe today to unlock all pages.
Trusted by 1+ million students worldwide
period. Company needs to make policies in order to ensure regular flow of funds
from debtors in order to ensure liquidity.
c. Though ratio analysis is a very essential tool which helps in taking financial decisions,
it also has a few limitations:
- Ratio analysis is based on past performance, it s not necessary that the past
performance will be continued by the company in the near future
- The figures of the financial statement fail to incorporate the inflation rates, which
will affect the future financial status of the company.
- There may be changes taking place in the management of the company or in the
shareholding which are likely to affect the operations, ratio analysis fails to
incorporate effects of decision like these on the financial performance of the
company.
- Interpretation of ratio analysis is not a easy task. It is important that the data form
ratio analysis is interpreted properly in order to have correct results.
- Few of the ratios involve figures from the balance sheet. We should keep in mind
that these figures are on the last date of the balance sheet. These figures keep
changing and so does the financial viability of the company.
Paraphrase This Document
Need a fresh take? Get an instant paraphrase of this document with our AI Paraphraser
Solution 1.2:
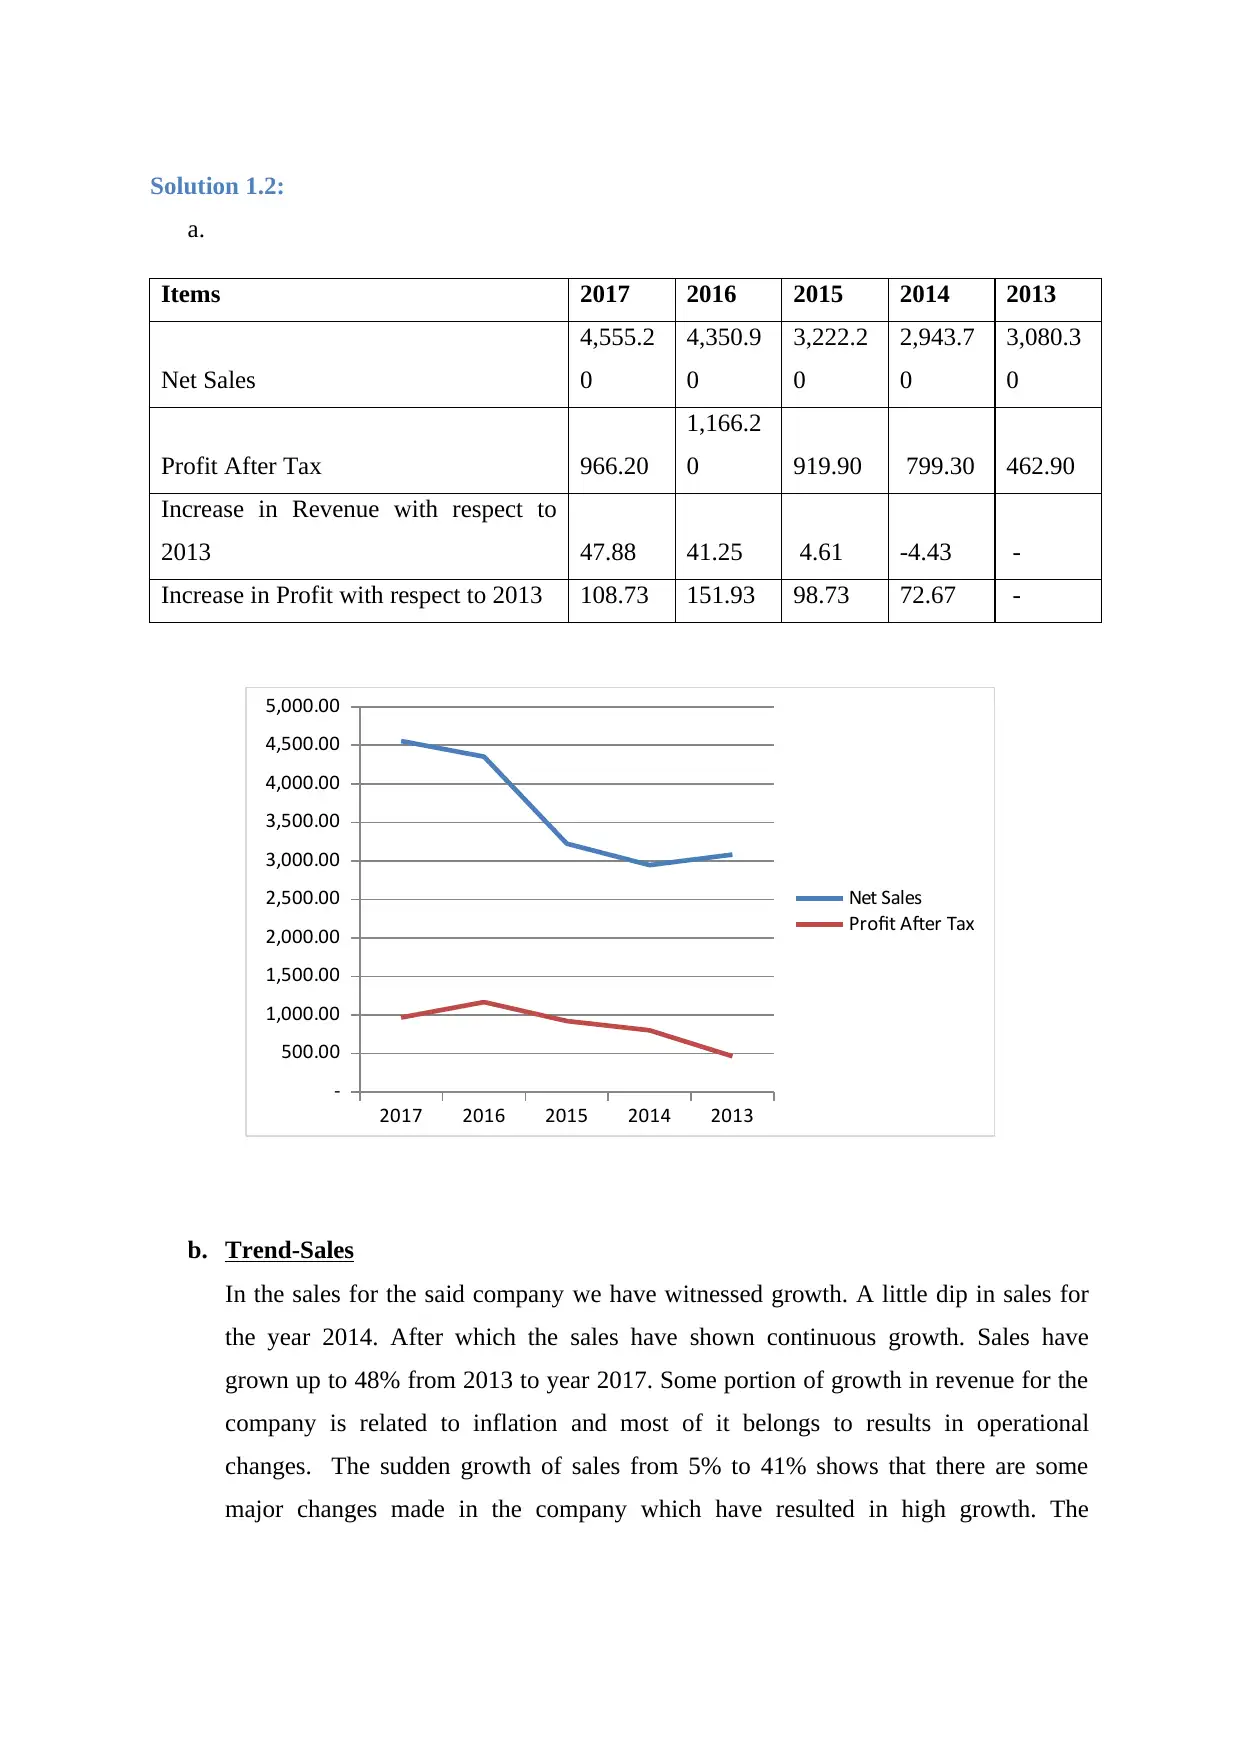
a.
Items 2017 2016 2015 2014 2013
Net Sales
4,555.2
0
4,350.9
0
3,222.2
0
2,943.7
0
3,080.3
0
Profit After Tax 966.20
1,166.2
0 919.90 799.30 462.90
Increase in Revenue with respect to
2013 47.88 41.25 4.61 -4.43 -
Increase in Profit with respect to 2013 108.73 151.93 98.73 72.67 -
2017 2016 2015 2014 2013
-
500.00
1,000.00
1,500.00
2,000.00
2,500.00
3,000.00
3,500.00
4,000.00
4,500.00
5,000.00
Net Sales
Profit After Tax
b. Trend-Sales
In the sales for the said company we have witnessed growth. A little dip in sales for
the year 2014. After which the sales have shown continuous growth. Sales have
grown up to 48% from 2013 to year 2017. Some portion of growth in revenue for the
company is related to inflation and most of it belongs to results in operational
changes. The sudden growth of sales from 5% to 41% shows that there are some
major changes made in the company which have resulted in high growth. The
company has then managed maintained this growth rate in 2017. Highest growth in
revenue was witnessed in with growth of 48% in sales.
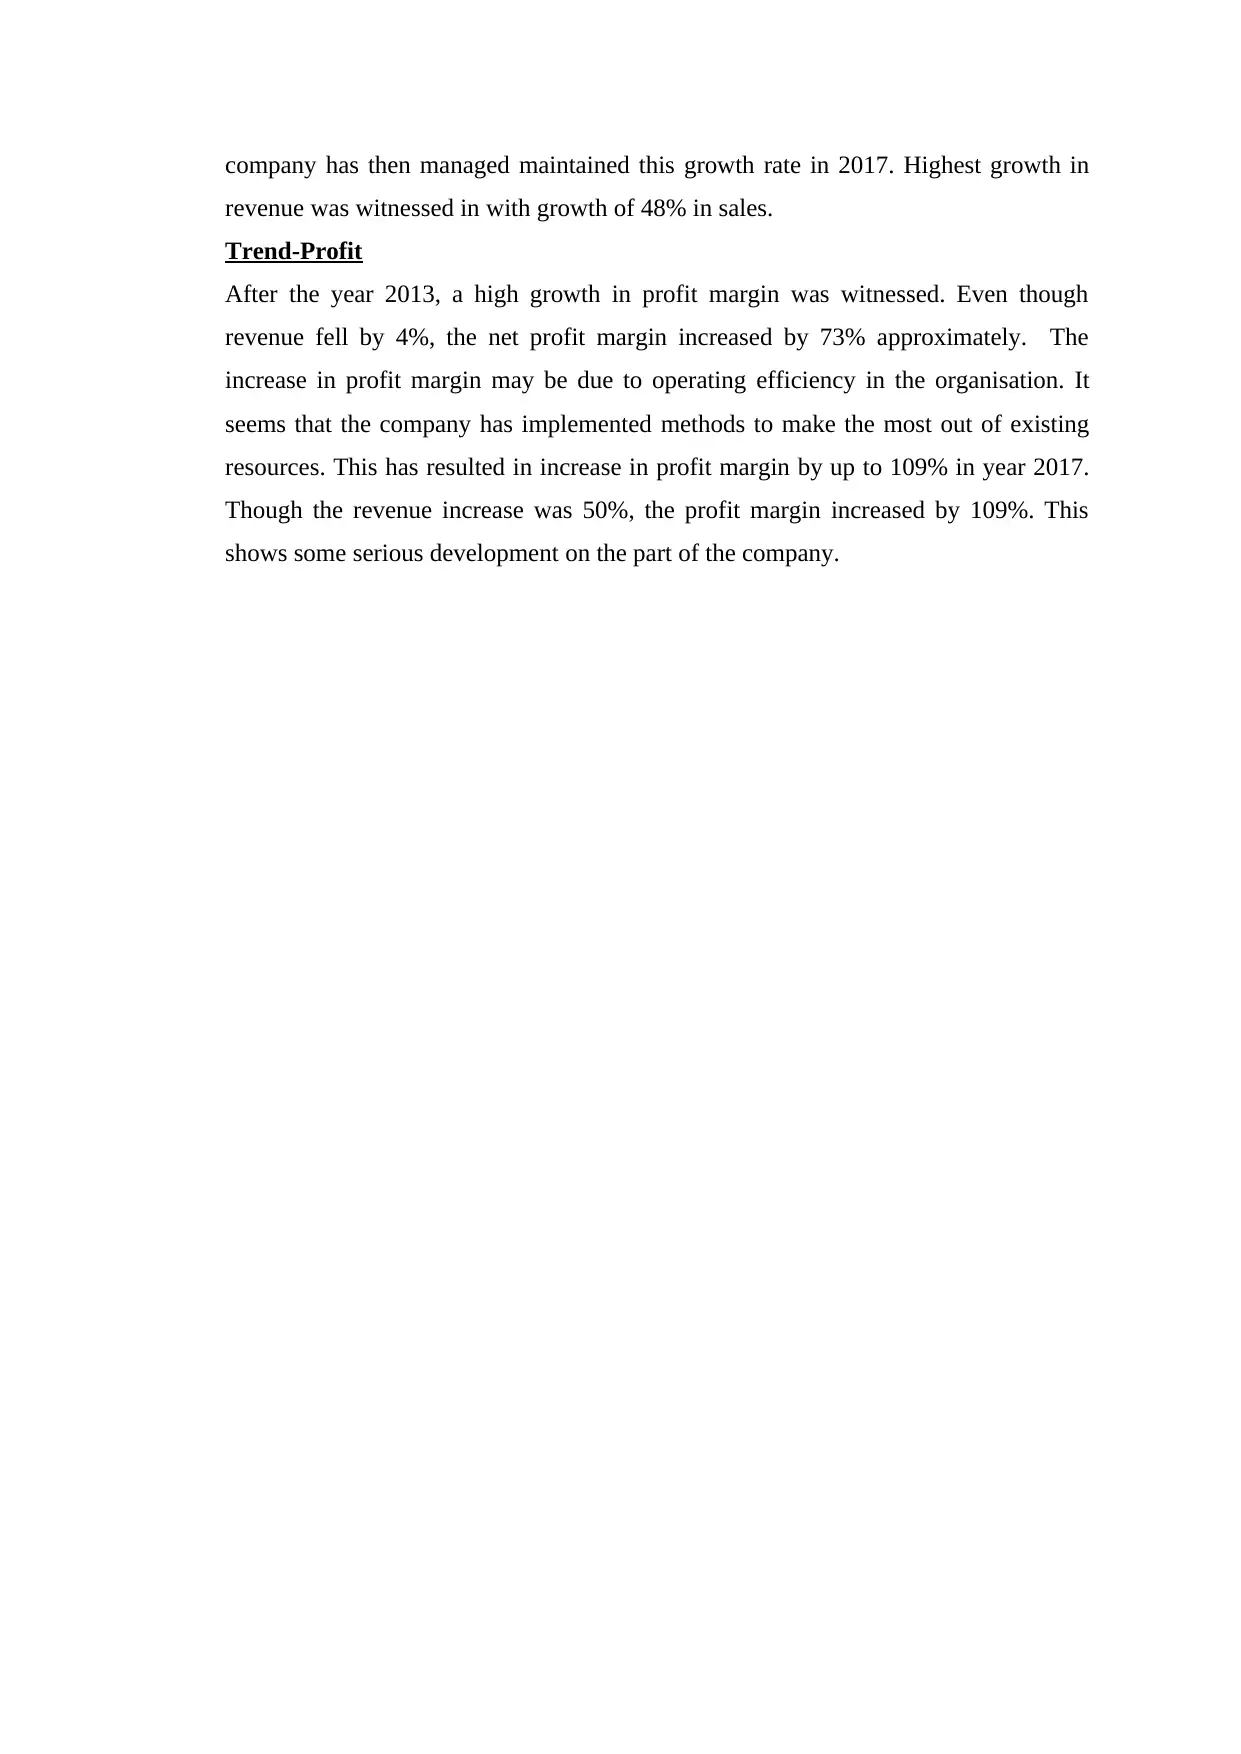
Trend-Profit
After the year 2013, a high growth in profit margin was witnessed. Even though
revenue fell by 4%, the net profit margin increased by 73% approximately. The
increase in profit margin may be due to operating efficiency in the organisation. It
seems that the company has implemented methods to make the most out of existing
resources. This has resulted in increase in profit margin by up to 109% in year 2017.
Though the revenue increase was 50%, the profit margin increased by 109%. This
shows some serious development on the part of the company.
revenue was witnessed in with growth of 48% in sales.
Trend-Profit
After the year 2013, a high growth in profit margin was witnessed. Even though
revenue fell by 4%, the net profit margin increased by 73% approximately. The
increase in profit margin may be due to operating efficiency in the organisation. It
seems that the company has implemented methods to make the most out of existing
resources. This has resulted in increase in profit margin by up to 109% in year 2017.
Though the revenue increase was 50%, the profit margin increased by 109%. This
shows some serious development on the part of the company.
⊘ This is a preview!⊘
Do you want full access?
Subscribe today to unlock all pages.
Trusted by 1+ million students worldwide
Solution 1.3:
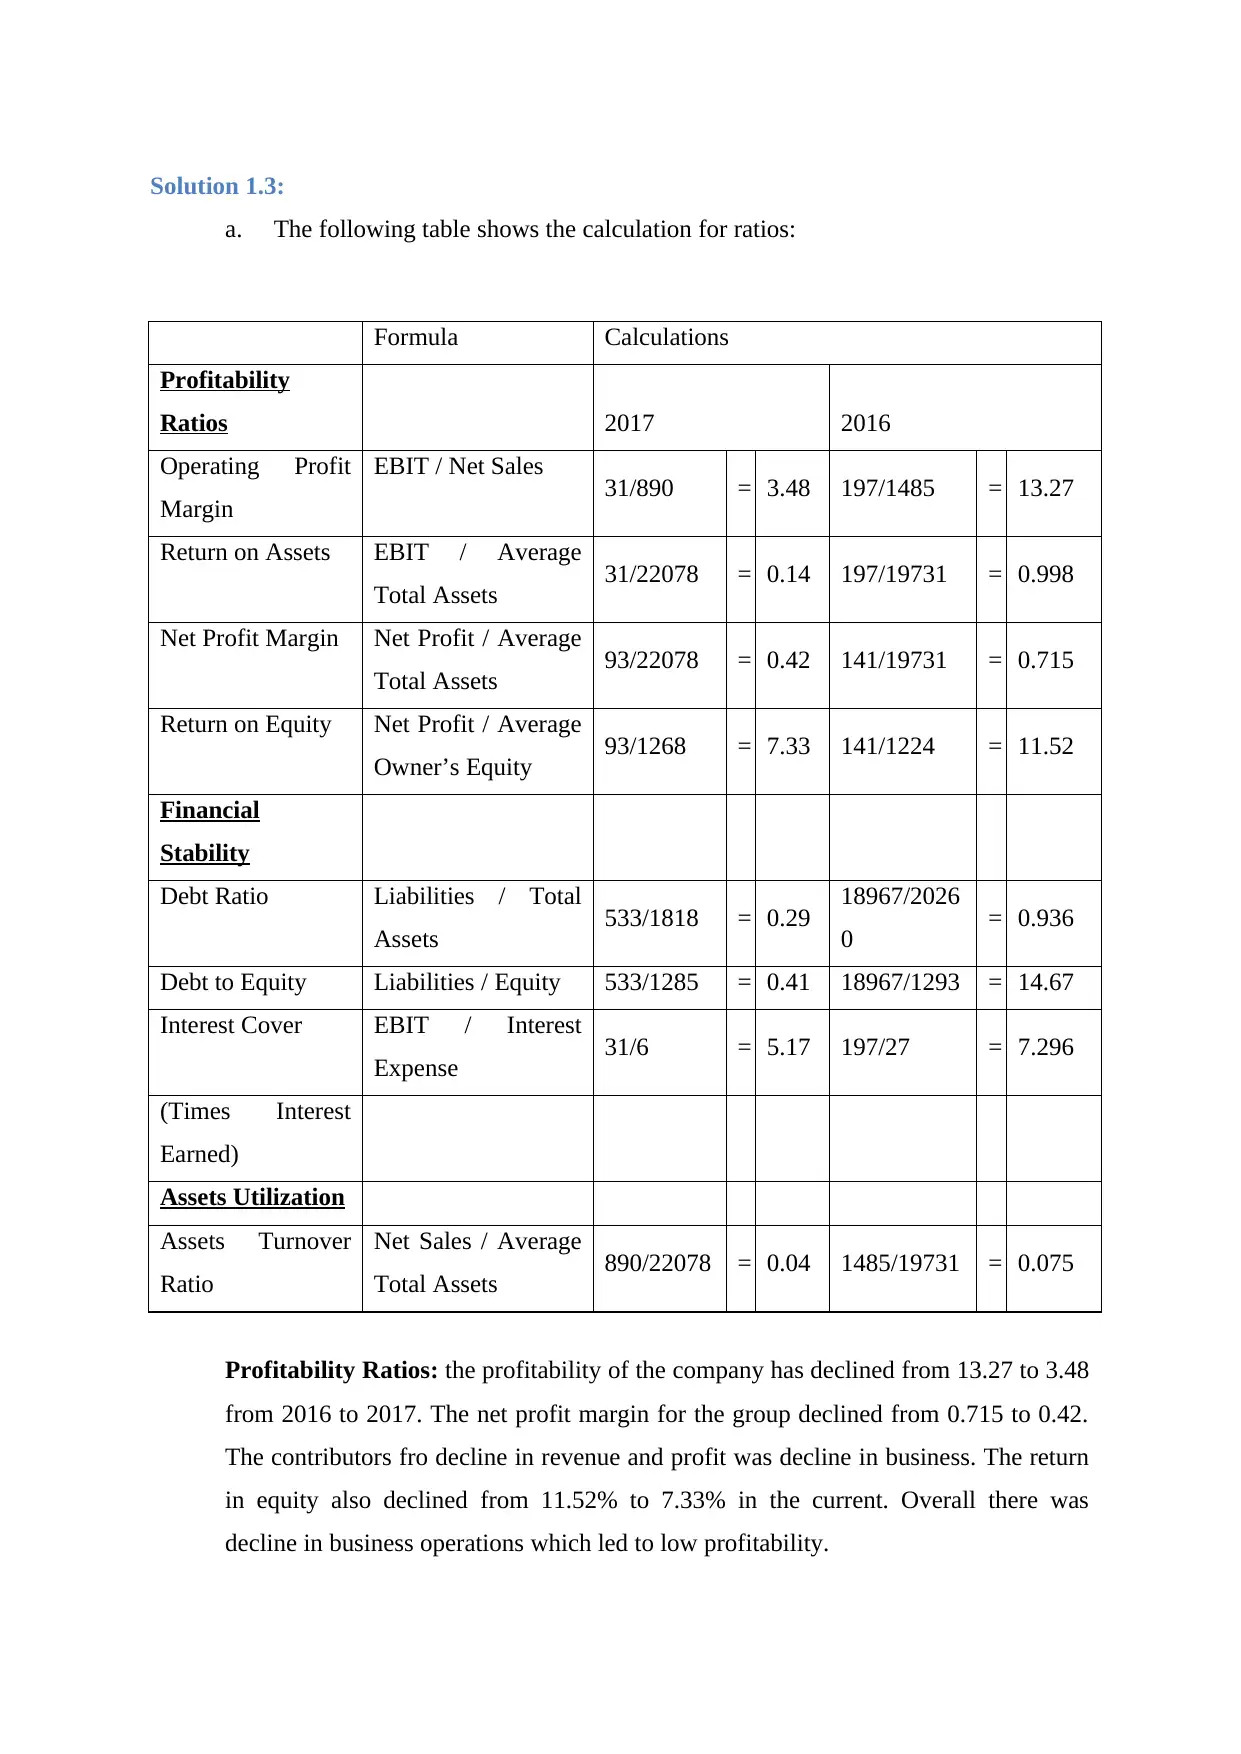
a. The following table shows the calculation for ratios:
Formula Calculations
Profitability
Ratios 2017 2016
Operating Profit
Margin
EBIT / Net Sales 31/890 = 3.48 197/1485 = 13.27
Return on Assets EBIT / Average
Total Assets 31/22078 = 0.14 197/19731 = 0.998
Net Profit Margin Net Profit / Average
Total Assets 93/22078 = 0.42 141/19731 = 0.715
Return on Equity Net Profit / Average
Owner’s Equity 93/1268 = 7.33 141/1224 = 11.52
Financial
Stability
Debt Ratio Liabilities / Total
Assets 533/1818 = 0.29 18967/2026
0 = 0.936
Debt to Equity Liabilities / Equity 533/1285 = 0.41 18967/1293 = 14.67
Interest Cover EBIT / Interest
Expense 31/6 = 5.17 197/27 = 7.296
(Times Interest
Earned)
Assets Utilization
Assets Turnover
Ratio
Net Sales / Average
Total Assets 890/22078 = 0.04 1485/19731 = 0.075
Profitability Ratios: the profitability of the company has declined from 13.27 to 3.48
from 2016 to 2017. The net profit margin for the group declined from 0.715 to 0.42.
The contributors fro decline in revenue and profit was decline in business. The return
in equity also declined from 11.52% to 7.33% in the current. Overall there was
decline in business operations which led to low profitability.
Paraphrase This Document
Need a fresh take? Get an instant paraphrase of this document with our AI Paraphraser
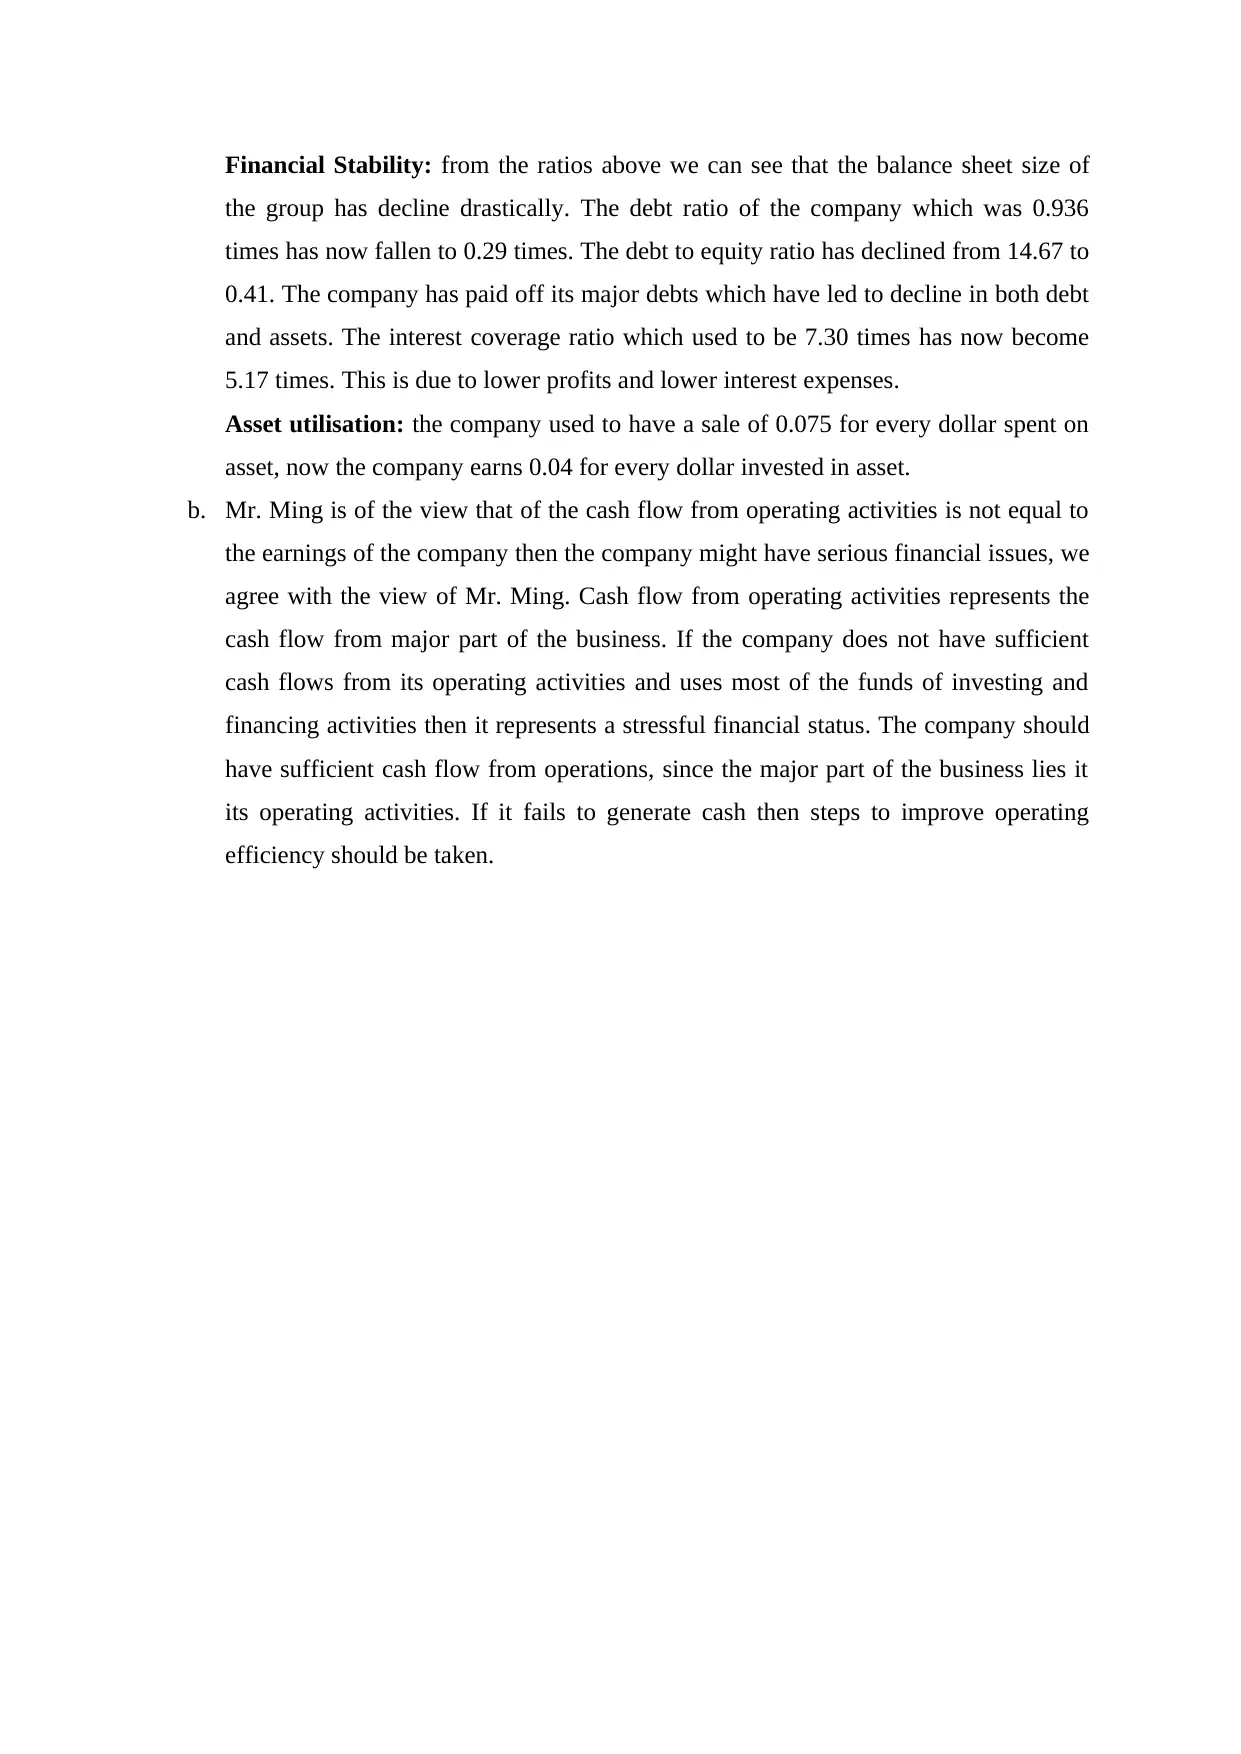
Financial Stability: from the ratios above we can see that the balance sheet size of
the group has decline drastically. The debt ratio of the company which was 0.936
times has now fallen to 0.29 times. The debt to equity ratio has declined from 14.67 to
0.41. The company has paid off its major debts which have led to decline in both debt
and assets. The interest coverage ratio which used to be 7.30 times has now become
5.17 times. This is due to lower profits and lower interest expenses.
Asset utilisation: the company used to have a sale of 0.075 for every dollar spent on
asset, now the company earns 0.04 for every dollar invested in asset.
b. Mr. Ming is of the view that of the cash flow from operating activities is not equal to
the earnings of the company then the company might have serious financial issues, we
agree with the view of Mr. Ming. Cash flow from operating activities represents the
cash flow from major part of the business. If the company does not have sufficient
cash flows from its operating activities and uses most of the funds of investing and
financing activities then it represents a stressful financial status. The company should
have sufficient cash flow from operations, since the major part of the business lies it
its operating activities. If it fails to generate cash then steps to improve operating
efficiency should be taken.
Solution 2:
Solution 2.1:
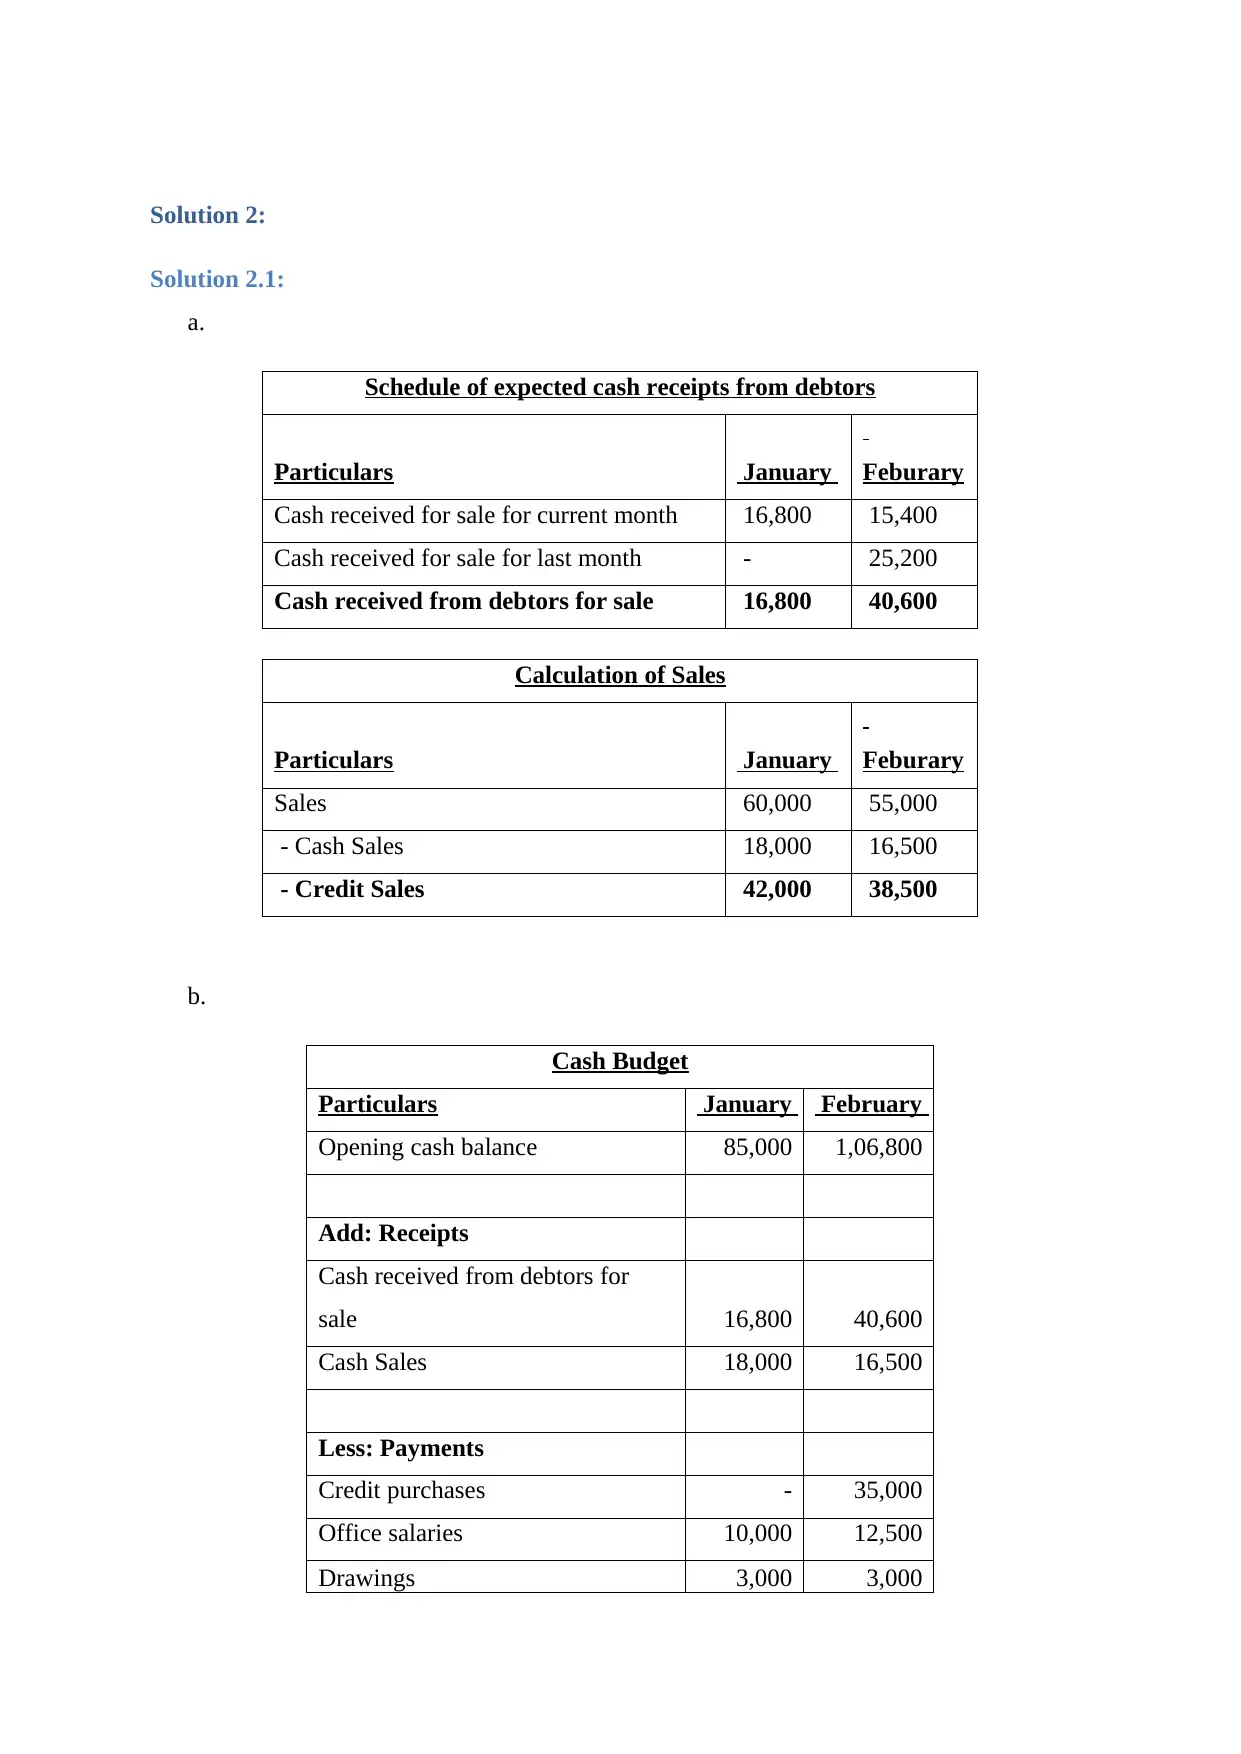
a.
Schedule of expected cash receipts from debtors
Particulars January Feburary
Cash received for sale for current month 16,800 15,400
Cash received for sale for last month - 25,200
Cash received from debtors for sale 16,800 40,600
Calculation of Sales
Particulars January Feburary
Sales 60,000 55,000
- Cash Sales 18,000 16,500
- Credit Sales 42,000 38,500
b.
Cash Budget
Particulars January February
Opening cash balance 85,000 1,06,800
Add: Receipts
Cash received from debtors for
sale 16,800 40,600
Cash Sales 18,000 16,500
Less: Payments
Credit purchases - 35,000
Office salaries 10,000 12,500
Drawings 3,000 3,000
Solution 2.1:
a.
Schedule of expected cash receipts from debtors
Particulars January Feburary
Cash received for sale for current month 16,800 15,400
Cash received for sale for last month - 25,200
Cash received from debtors for sale 16,800 40,600
Calculation of Sales
Particulars January Feburary
Sales 60,000 55,000
- Cash Sales 18,000 16,500
- Credit Sales 42,000 38,500
b.
Cash Budget
Particulars January February
Opening cash balance 85,000 1,06,800
Add: Receipts
Cash received from debtors for
sale 16,800 40,600
Cash Sales 18,000 16,500
Less: Payments
Credit purchases - 35,000
Office salaries 10,000 12,500
Drawings 3,000 3,000
⊘ This is a preview!⊘
Do you want full access?
Subscribe today to unlock all pages.
Trusted by 1+ million students worldwide
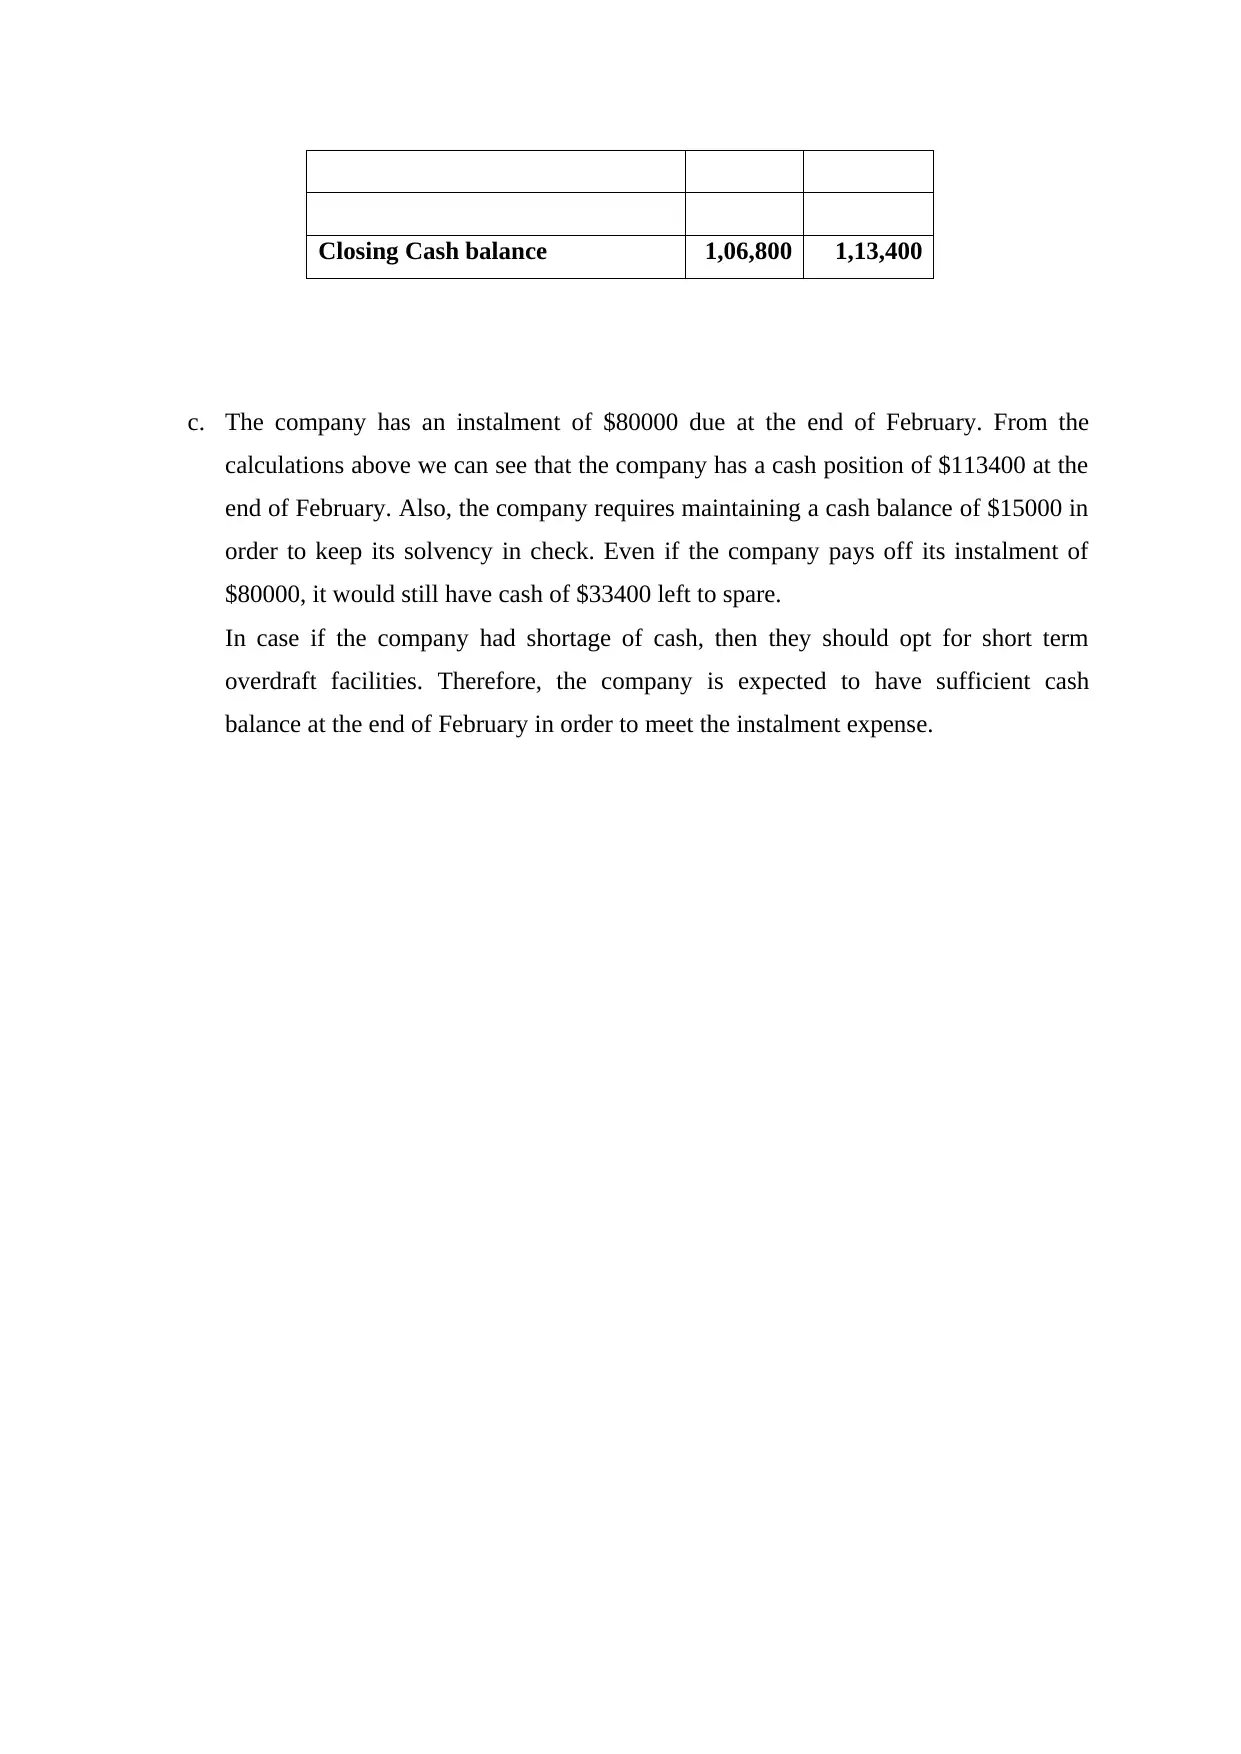
Closing Cash balance 1,06,800 1,13,400
c. The company has an instalment of $80000 due at the end of February. From the
calculations above we can see that the company has a cash position of $113400 at the
end of February. Also, the company requires maintaining a cash balance of $15000 in
order to keep its solvency in check. Even if the company pays off its instalment of
$80000, it would still have cash of $33400 left to spare.
In case if the company had shortage of cash, then they should opt for short term
overdraft facilities. Therefore, the company is expected to have sufficient cash
balance at the end of February in order to meet the instalment expense.
Paraphrase This Document
Need a fresh take? Get an instant paraphrase of this document with our AI Paraphraser
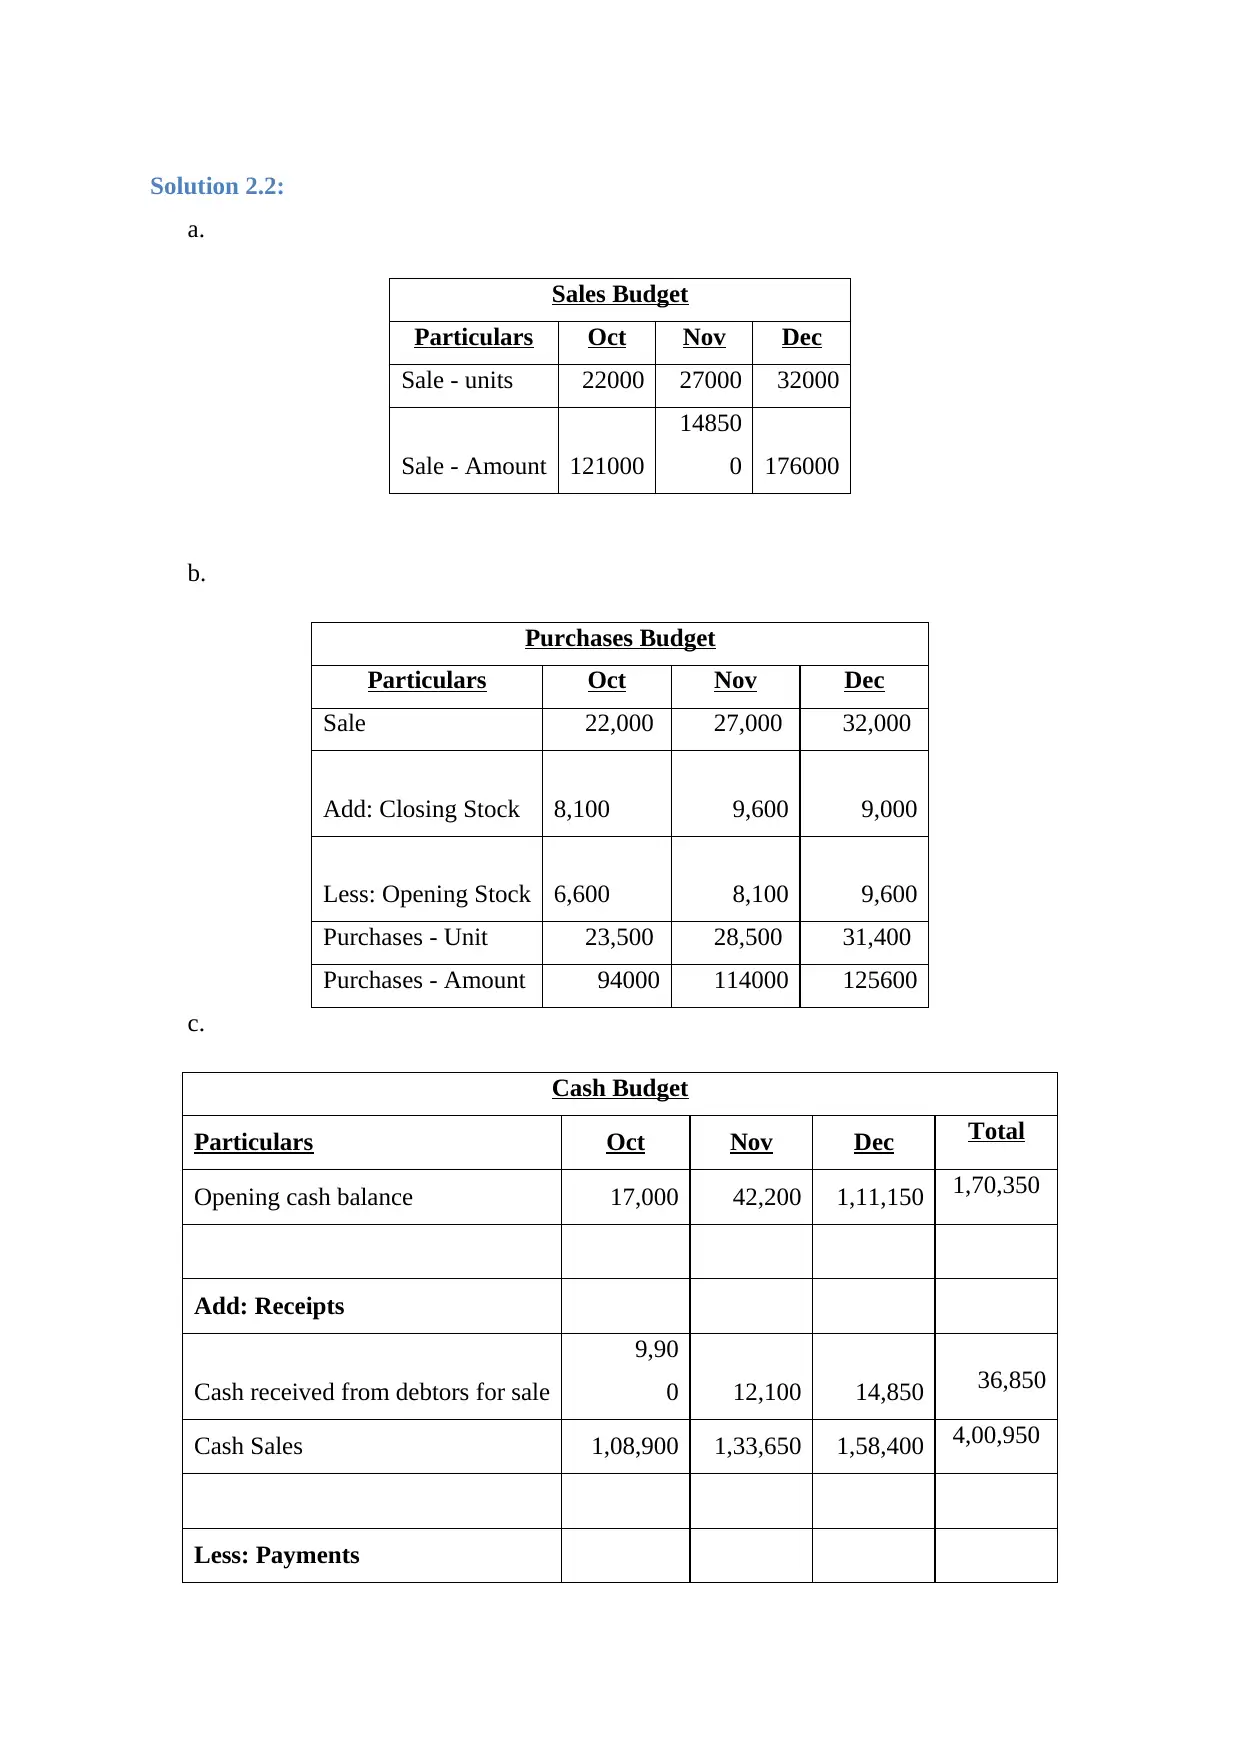
Solution 2.2:
a.
Sales Budget
Particulars Oct Nov Dec
Sale - units 22000 27000 32000
Sale - Amount 121000
14850
0 176000
b.
Purchases Budget
Particulars Oct Nov Dec
Sale 22,000 27,000 32,000
Add: Closing Stock 8,100 9,600 9,000
Less: Opening Stock 6,600 8,100 9,600
Purchases - Unit 23,500 28,500 31,400
Purchases - Amount 94000 114000 125600
c.
Cash Budget
Particulars Oct Nov Dec Total
Opening cash balance 17,000 42,200 1,11,150 1,70,350
Add: Receipts
Cash received from debtors for sale
9,90
0 12,100 14,850 36,850
Cash Sales 1,08,900 1,33,650 1,58,400 4,00,950
Less: Payments
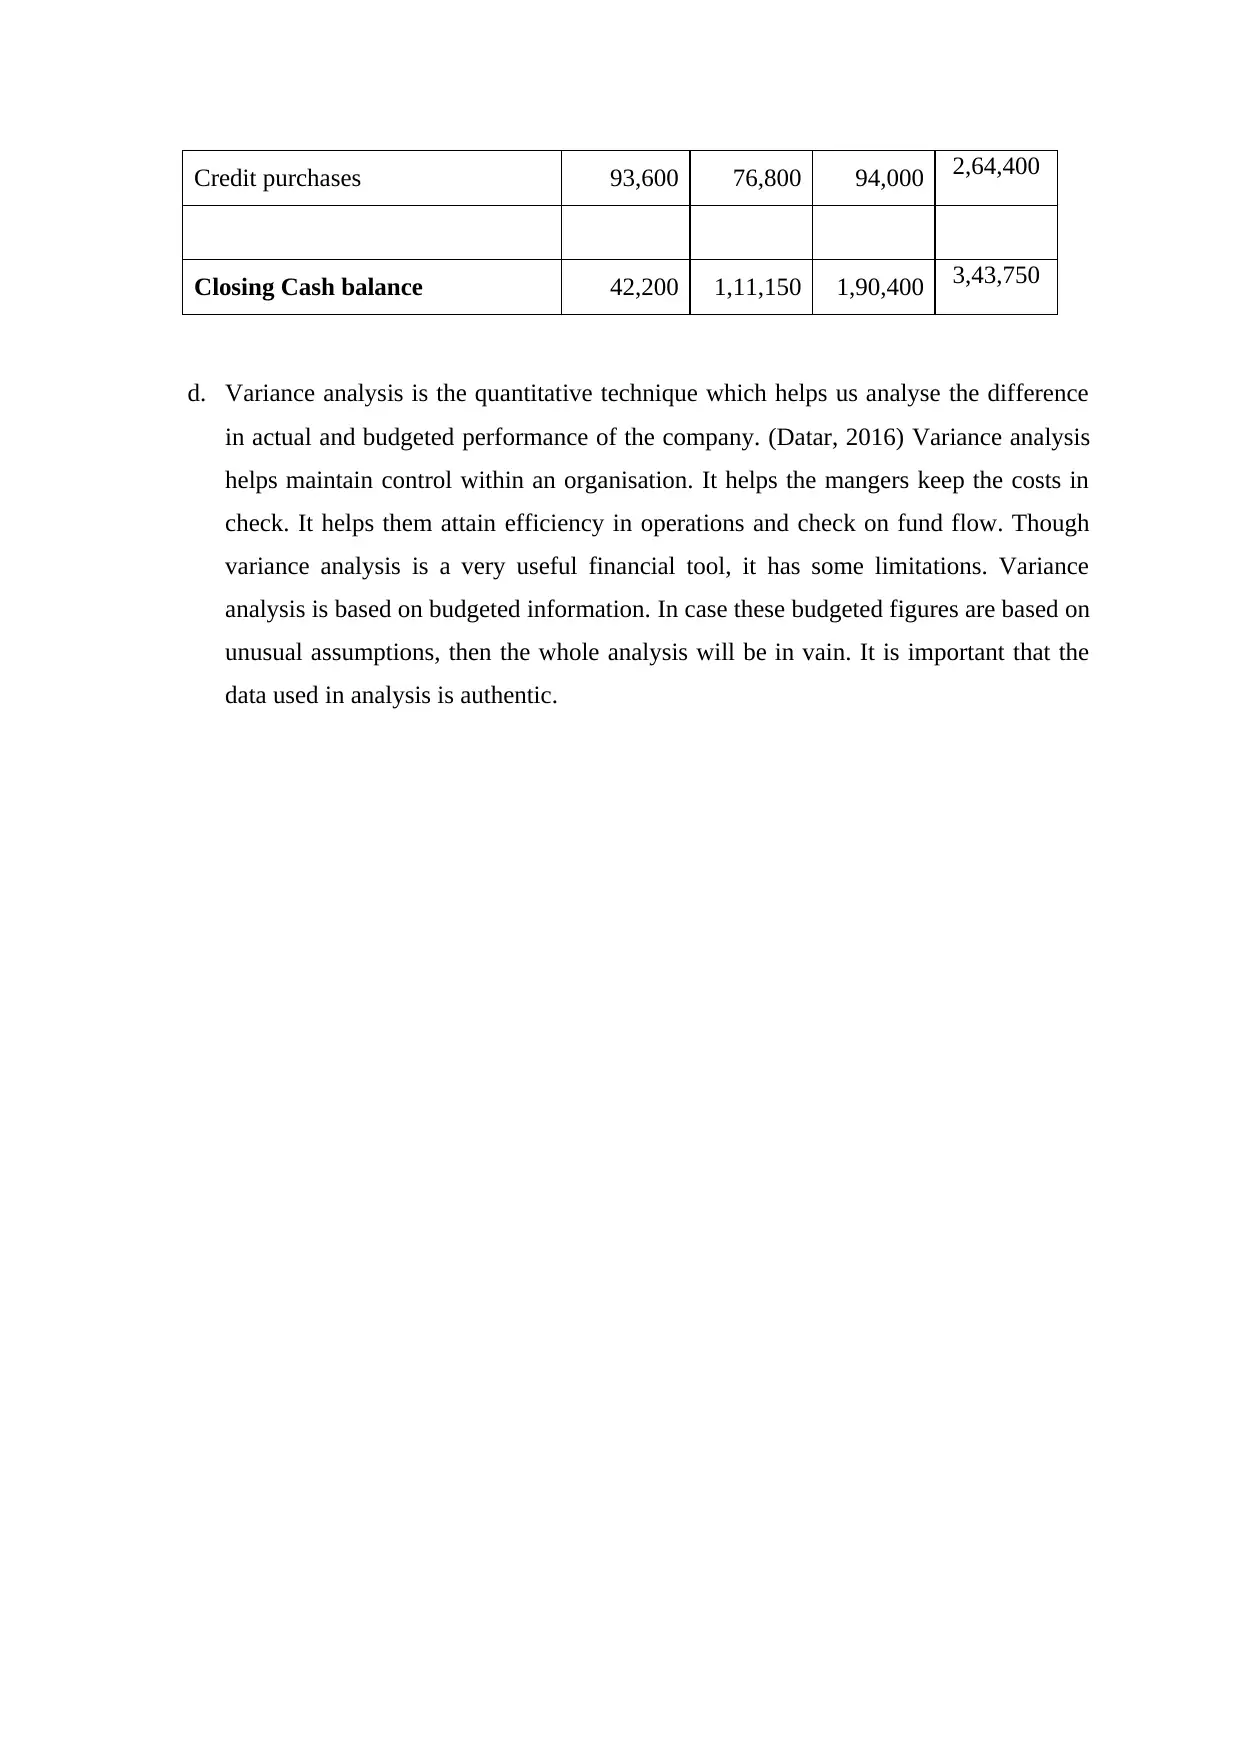
Credit purchases 93,600 76,800 94,000 2,64,400
Closing Cash balance 42,200 1,11,150 1,90,400 3,43,750
d. Variance analysis is the quantitative technique which helps us analyse the difference
in actual and budgeted performance of the company. (Datar, 2016) Variance analysis
helps maintain control within an organisation. It helps the mangers keep the costs in
check. It helps them attain efficiency in operations and check on fund flow. Though
variance analysis is a very useful financial tool, it has some limitations. Variance
analysis is based on budgeted information. In case these budgeted figures are based on
unusual assumptions, then the whole analysis will be in vain. It is important that the
data used in analysis is authentic.
⊘ This is a preview!⊘
Do you want full access?
Subscribe today to unlock all pages.
Trusted by 1+ million students worldwide
1 out of 13
Related Documents


Your All-in-One AI-Powered Toolkit for Academic Success.
+13062052269
info@desklib.com
Available 24*7 on WhatsApp / Email
![[object Object]](/_next/static/media/star-bottom.7253800d.svg)
Unlock your academic potential
Copyright © 2020–2026 A2Z Services. All Rights Reserved. Developed and managed by ZUCOL.