Accounting for Managers: Performance and Overhead Analysis
VerifiedAdded on 2022/08/20
|11
|1749
|12
Homework Assignment
AI Summary
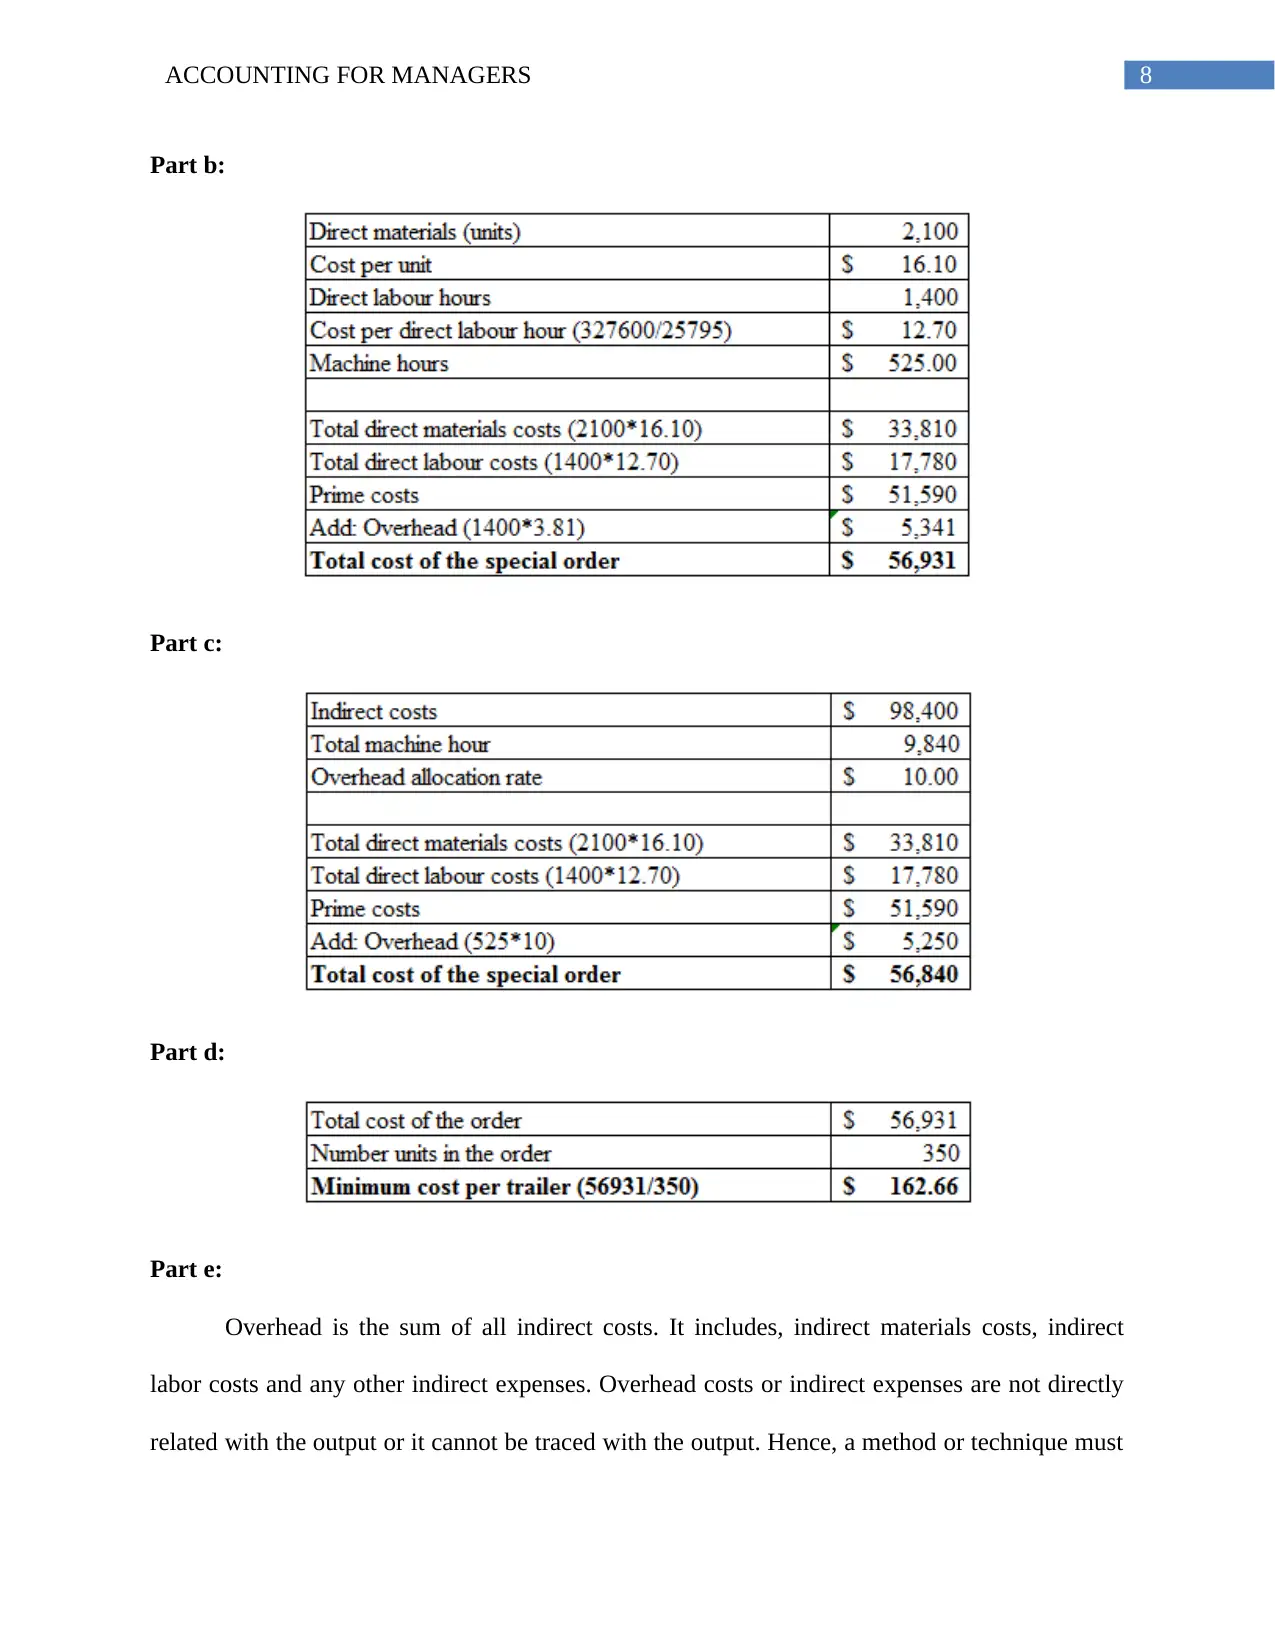
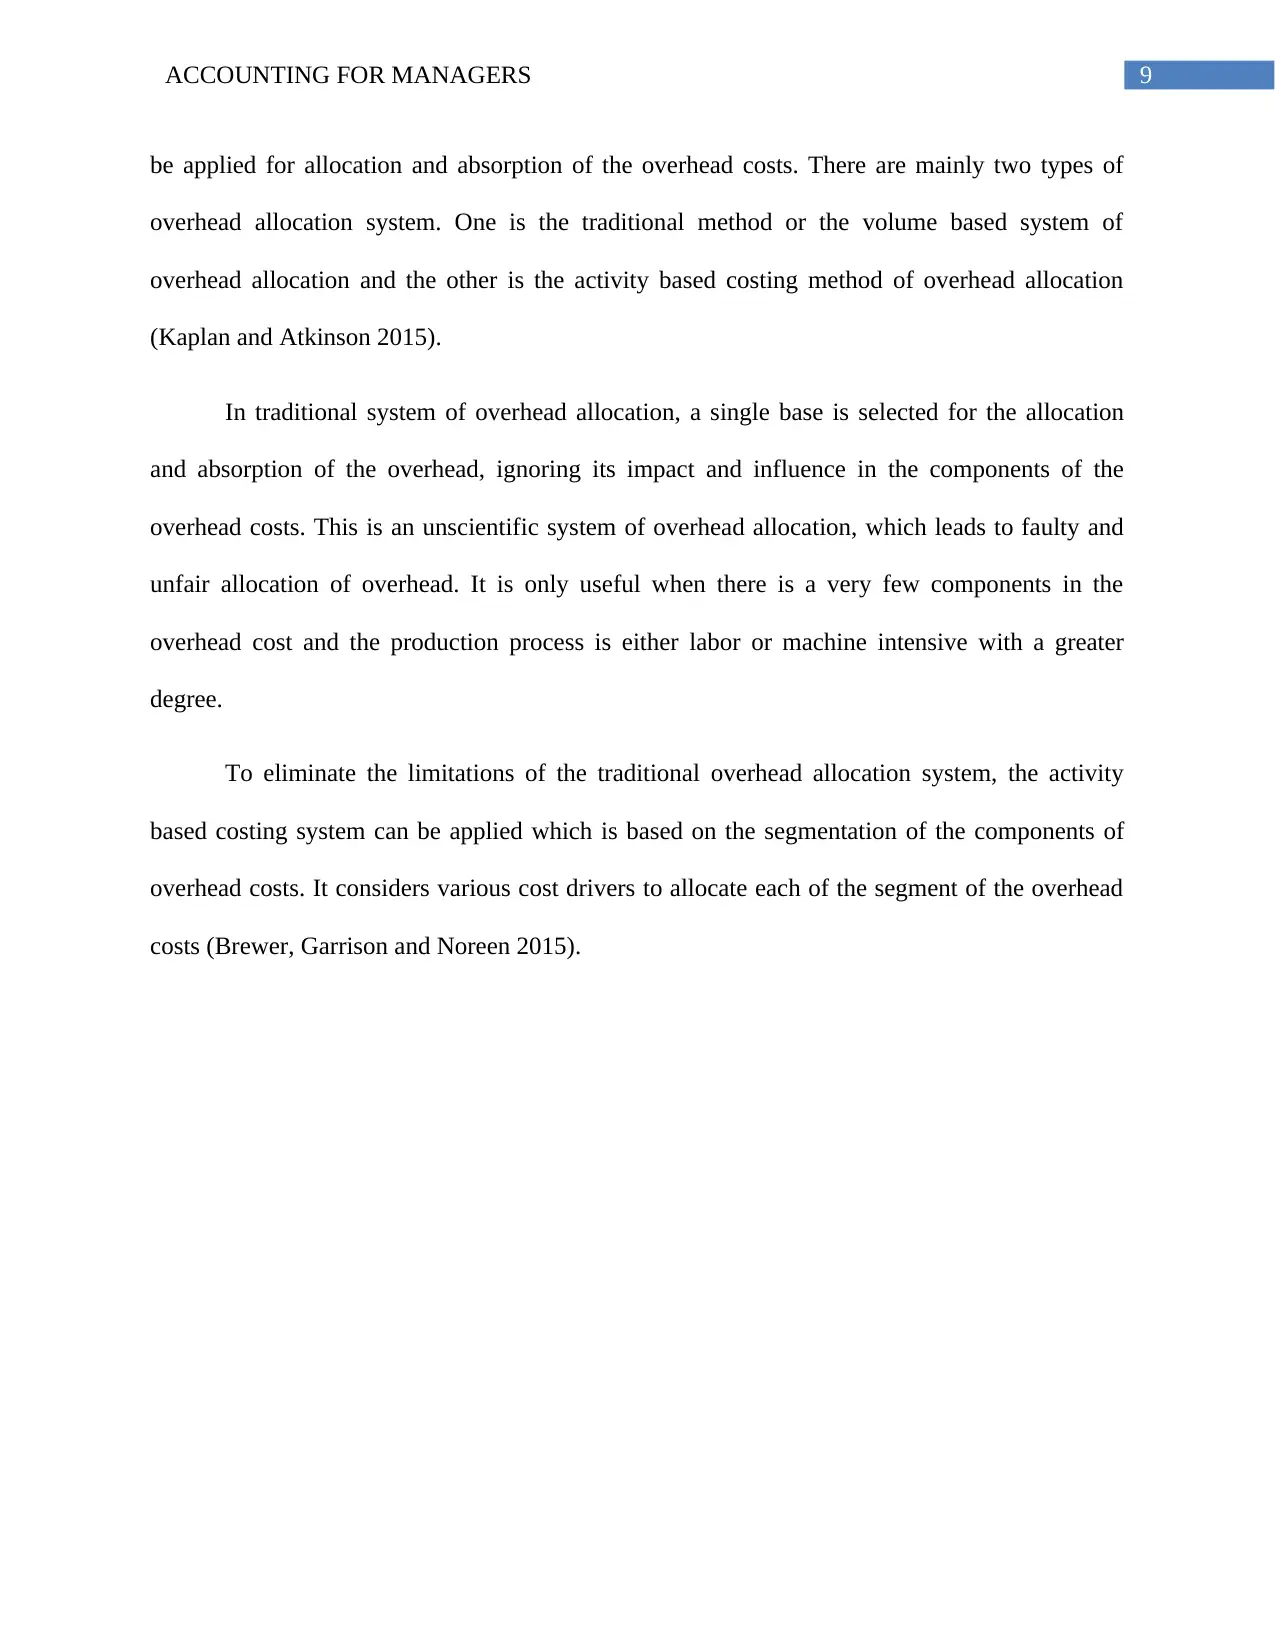
This assignment provides a comprehensive analysis of financial statements, ratio analysis, and managerial accounting principles. The solution begins with an examination of Grafton Pty Ltd's financial performance, including liquidity and financial stability, using ratio analysis to assess its current and quick ratios, debt ratio, and leverage ratio. The analysis offers insights into the company's financial health and provides investment recommendations. The assignment then delves into profitability analysis, comparing marketing strategies proposed by different managers at Dunning Ltd, evaluating their impact on profit and break-even points. Finally, the assignment explores overhead allocation methods, contrasting traditional and activity-based costing systems, highlighting the advantages and disadvantages of each approach. The solution provides a detailed explanation of these concepts with relevant calculations and interpretations.

Running head: ACCOUNTING FOR MANAGERS
Accounting for Managers
Name of the Student:
Name of the University:
Author’s Note:
Accounting for Managers
Name of the Student:
Name of the University:
Author’s Note:
Paraphrase This Document
Need a fresh take? Get an instant paraphrase of this document with our AI Paraphraser

1ACCOUNTING FOR MANAGERS
Table of Contents
Answer to question 1:......................................................................................................................2
Part a:...........................................................................................................................................2
Part b:...........................................................................................................................................3
Part c:...........................................................................................................................................5
Answer to question 2:......................................................................................................................5
Introduction..................................................................................................................................5
Discussion....................................................................................................................................5
Accountant’s proposal.............................................................................................................5
Production manager’s proposal...............................................................................................6
Sales manager’s proposal........................................................................................................6
Conclusion...................................................................................................................................6
Answer to question 3:......................................................................................................................7
Part a:...........................................................................................................................................7
Part b:...........................................................................................................................................7
Part c:...........................................................................................................................................7
Part d:...........................................................................................................................................8
Part e:...........................................................................................................................................8
References and bibliography:..........................................................................................................9

2ACCOUNTING FOR MANAGERS
Answer to question 1:
Financial statement of a company reveals the financial performance and financial
position of the company for a particular period of time. In the following parts the ratio analysis
tool have been applied as a means of financial statement analysis to interpret and understand the
liquidity and financial stability of the Grafton Pty Ltd.
Part a:
⊘ This is a preview!⊘
Do you want full access?
Subscribe today to unlock all pages.

Trusted by 1+ million students worldwide

3ACCOUNTING FOR MANAGERS
Part b:
Liquidity means the ability of a company to pay off all of its short term obligation using
the readily convertible resources. In the above part, the current ratio of the company has been
computed as 1.06:1 for the year 2018 and 1.01:1 for the year 2019. The standard or the
benchmark for the current ratio is 2:1. Hence, the company is having a poor liquidity in both the
years in terms of current ratio. Though the industry average for the current ratio is also below the
standard, the company do have the liquidity up to that mark too. While the industry average is
1.70:1, the company is having its current ratio below the industry average in both the years 2018
and 2019 (Arif, T.M.H., Noor-E-Jannat and Anwar 2016).
Quick ratio is another measure of short term solvency or liquidity. It can be observed
from the above computations that, the company is having a quick ratio of 0.88:1 in the year 2018
Paraphrase This Document
Need a fresh take? Get an instant paraphrase of this document with our AI Paraphraser

4ACCOUNTING FOR MANAGERS
and 0.78:1 in the year 2019. The standard benchmark for the quick ratio is 1:1. Hence, the
company is having a poor liquidity as can be seen from the quick ratio. The industry average is
1:1, which is the standard, and the company is having its quick ratio below that level in both the
years. It can further be noticed that, the there is a significant decrease in the quick ratio from the
year 2018 to 2019.
Financial stability is the measure of the long term solvency of a company. It can be
observed that the company is having debt ratio of 78% in the year 2018 and 80% in the year
2019, while the industry average is 60%. If it is assumed that the industry average prevails for
both the years, it can be commented that the company is having a poor financial stability. On the
other hand the leverage ratio, which compares the total assets to the total equity, the company is
having 4.91 times in the year 2018 and 4.59 times in the year 2019. The industry average for the
leverage ratio is 2.5 times. Therefore, it can be concluded that, in both the measures the company
shows a poor mark in terms of financial stability. Following bar charts can be used for presenting
and comparing the financial stability of the company (Wahlen, Baginski and Bradshaw 2014).

5ACCOUNTING FOR MANAGERS
Part c:
The Grafton Pty Ltd is having poor liquidity and poor financial stability in both the years.
Also, there is a further downfall in the situation too from the year 2018 to 2019. Hence, as an
investor, it would not be a good decision to invest in the unsecured notes of the company or to
lend money to the company. Lending money or investing in unsecured notes of the company is
having possibility of default risk or a risk that the principle amount could not be recovered back.
As the Grafton Pty Ltd is having poor liquidity and solvency, it is not recommended to lend
money to the company (Wahlen, Baginski and Bradshaw 2014).
⊘ This is a preview!⊘
Do you want full access?
Subscribe today to unlock all pages.

Trusted by 1+ million students worldwide

6ACCOUNTING FOR MANAGERS
Answer to question 2:
Introduction
Profitability is the key measure of the financial performance of any company. Companies
must make such marketing and business strategies which will increase the profitability of the
company and contribute towards achieving the overall objective of the company. In this report
the marketing strategies as proposed by three different personnel in the Dunning Ltd have been
analyzed to understand its effect on the profitability of the company (Datar and Rajan 2014).
Discussion
Currently the company is having a sales of 20,000 units at a price of $130 per unit, which
results into a total profit of $300,000 with a breakeven point of 14,000 units. Following
proposals and its implications can be analyzed to arrive at a sound strategic decision.
Accountant’s proposal
As per the accountant’s proposal increasing per unit price by $10 will not affect the
forecasted sales but to keep it intact additional $125,000 have to be spent on the selling and
administration. It will result into an increase in the total fixed costs. As a result the total profit
will increase by $75,000 and a decrease in breakeven sales. The strength of this proposal is that,
the company will be enjoining their dominance over the market without affecting the quality of
the product and the weakness of this strategy is that, though the company is expecting no
downfall in the sales volume, but in reality the sales volume may go down due to increased sales
price (Datar and Rajan 2014).
Production manager’s proposal
In this proposal the quality of the product is taken care off, with an expectation of
increase in the sales volume. It will cause an increase in the total profit by $125,000 and an
Paraphrase This Document
Need a fresh take? Get an instant paraphrase of this document with our AI Paraphraser

7ACCOUNTING FOR MANAGERS
increase in breakeven sales. The strength of this strategy is that, there is no chance of decreasing
the demand as the price remains unchanged and quality gets improved. On the other hand, the
weakness of the strategy is that cost and decreases the net profit margin.
Sales manager’s proposal
Sales manager proposes a rebate in three months, which will result in an increase in sales
volume by 4,000 units and a decrease in revenue due to the rebate. It will cause and increase in
profit by $90,000. The strength of this strategy is that it focuses on increasing the sales in a
particular season not affecting the price and quality of the product, and the disadvantage of the
strategy is that, it works only for a particular season and not for the whole years (Datar and Rajan
2014).
Conclusion
From the above analysis and discussion it can be concluded that, the Production
manager’s proposal is having superiority over the others and can give the highest profit to the
company. The initiatives in this strategy is rational too. Hence, it can be recommended for
selecting the production manager’s proposal.
Answer to question 3:
Part a:

8ACCOUNTING FOR MANAGERS
Part b:
Part c:
Part d:
Part e:
Overhead is the sum of all indirect costs. It includes, indirect materials costs, indirect
labor costs and any other indirect expenses. Overhead costs or indirect expenses are not directly
related with the output or it cannot be traced with the output. Hence, a method or technique must
⊘ This is a preview!⊘
Do you want full access?
Subscribe today to unlock all pages.

Trusted by 1+ million students worldwide

9ACCOUNTING FOR MANAGERS
be applied for allocation and absorption of the overhead costs. There are mainly two types of
overhead allocation system. One is the traditional method or the volume based system of
overhead allocation and the other is the activity based costing method of overhead allocation
(Kaplan and Atkinson 2015).
In traditional system of overhead allocation, a single base is selected for the allocation
and absorption of the overhead, ignoring its impact and influence in the components of the
overhead costs. This is an unscientific system of overhead allocation, which leads to faulty and
unfair allocation of overhead. It is only useful when there is a very few components in the
overhead cost and the production process is either labor or machine intensive with a greater
degree.
To eliminate the limitations of the traditional overhead allocation system, the activity
based costing system can be applied which is based on the segmentation of the components of
overhead costs. It considers various cost drivers to allocate each of the segment of the overhead
costs (Brewer, Garrison and Noreen 2015).
Paraphrase This Document
Need a fresh take? Get an instant paraphrase of this document with our AI Paraphraser

10ACCOUNTING FOR MANAGERS
References and bibliography:
Arif, T.M.H., Noor-E-Jannat, K. and Anwar, S.R., 2016. Financial Statement and
Competitiveness Analysis: A Study on Tourism & Hospitality Industry in
Bangladesh. International Journal of Financial Research, 7(4), pp.180-189.
Brewer, P.C., Garrison, R.H. and Noreen, E.W., 2015. Introduction to managerial accounting.
McGraw-Hill Education.
Datar, S.M. and Rajan, M., 2014. Managerial accounting: Making decisions and motivating
performance.
Jiambalvo, J., 2019. Managerial accounting. John Wiley & Sons.
Kaplan, R.S. and Atkinson, A.A., 2015. Advanced management accounting. PHI Learning.
Mihăilă, M., 2014. Managerial accounting and decision making, in energy industry. Procedia-
Social and Behavioral Sciences, 109, pp.1199-1202.
Réka, C.I., Ştefan, P. and Daniel, C.V., 2014. TRADITIONAL BUDGETING VERSUS
BEYOND BUDGETING: A LITERATURE REVIEW. Annals of the University of Oradea,
Economic Science Series, 23(1).
Wahlen, J.M., Baginski, S.P. and Bradshaw, M., 2014. Financial reporting, financial statement
analysis and valuation. Nelson Education.
1 out of 11
Related Documents

Your All-in-One AI-Powered Toolkit for Academic Success.
+13062052269
info@desklib.com
Available 24*7 on WhatsApp / Email
Unlock your academic potential
Copyright © 2020–2025 A2Z Services. All Rights Reserved. Developed and managed by ZUCOL.