MG5556 Financial Resources Management: Company Performance Analysis

Verified

Added on  2022/10/31

|21
|3412
|211
Report
AI Summary
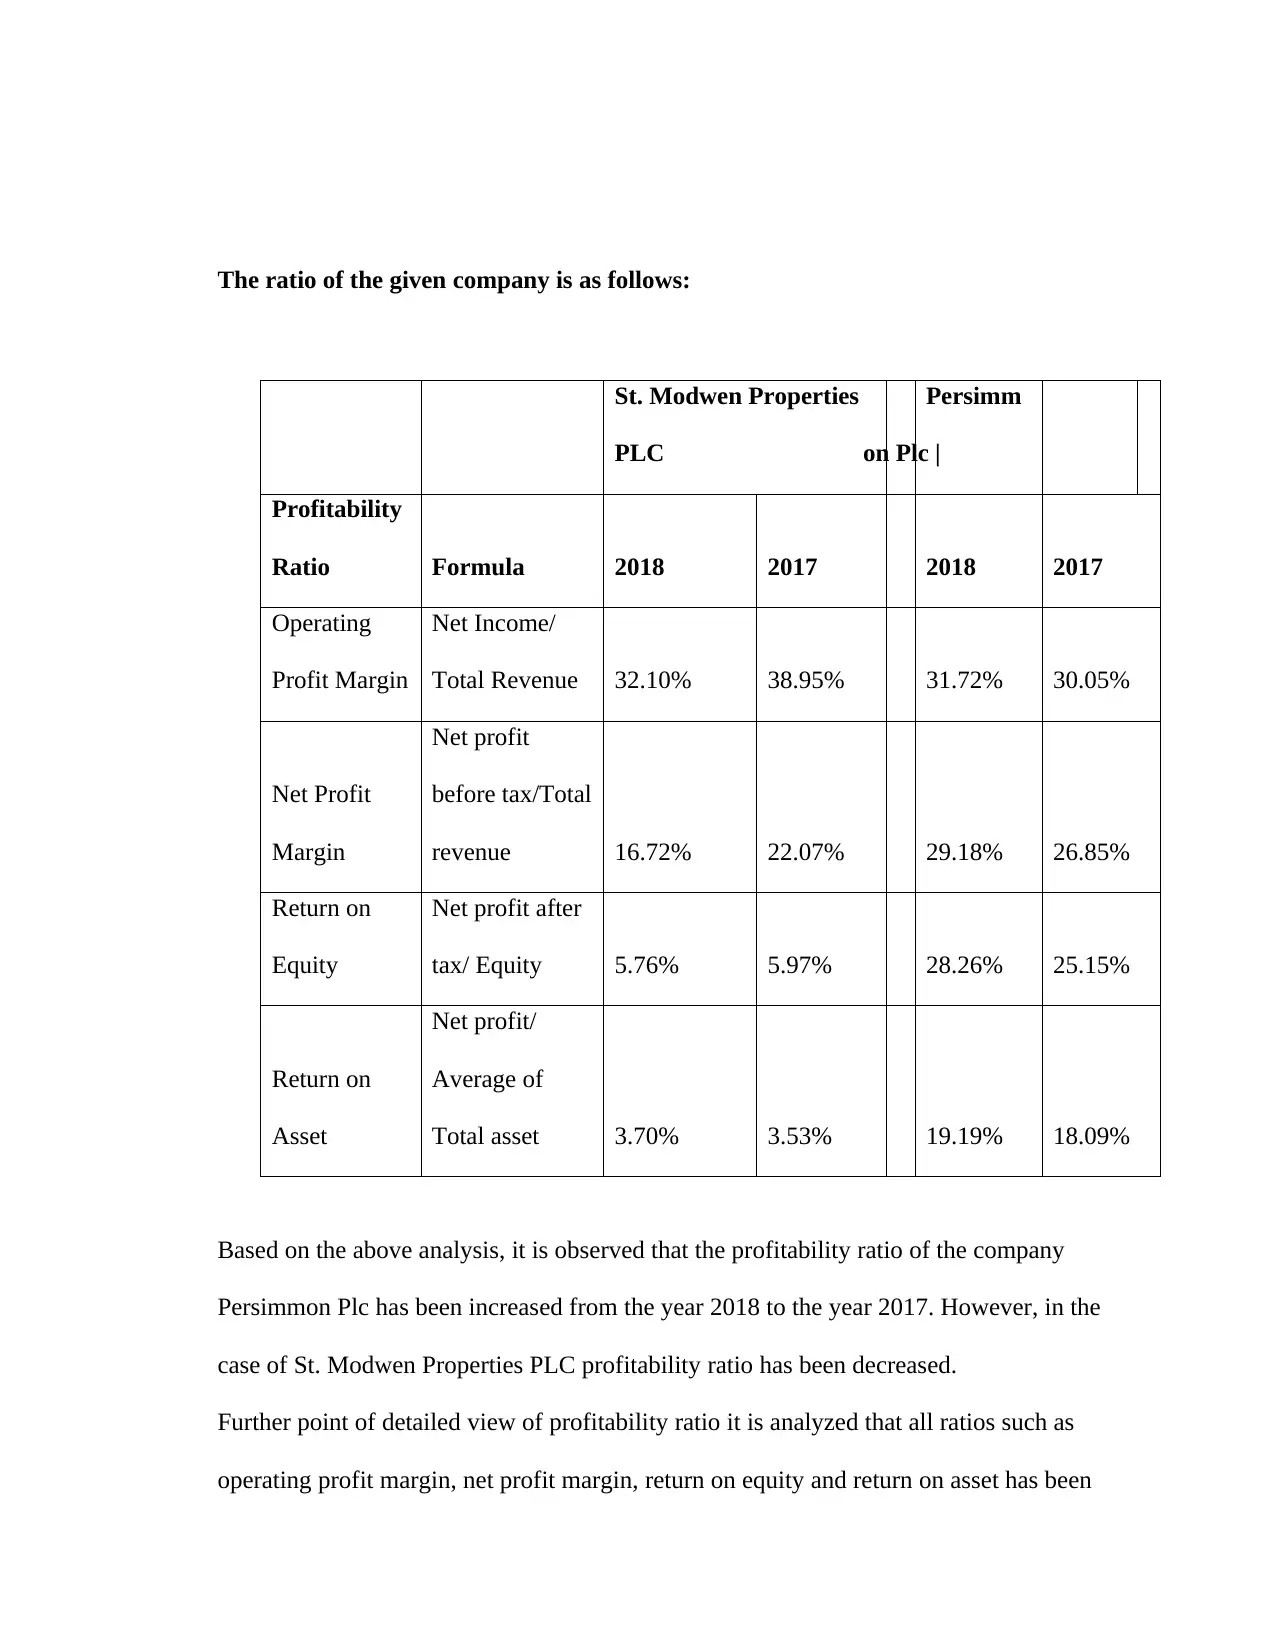
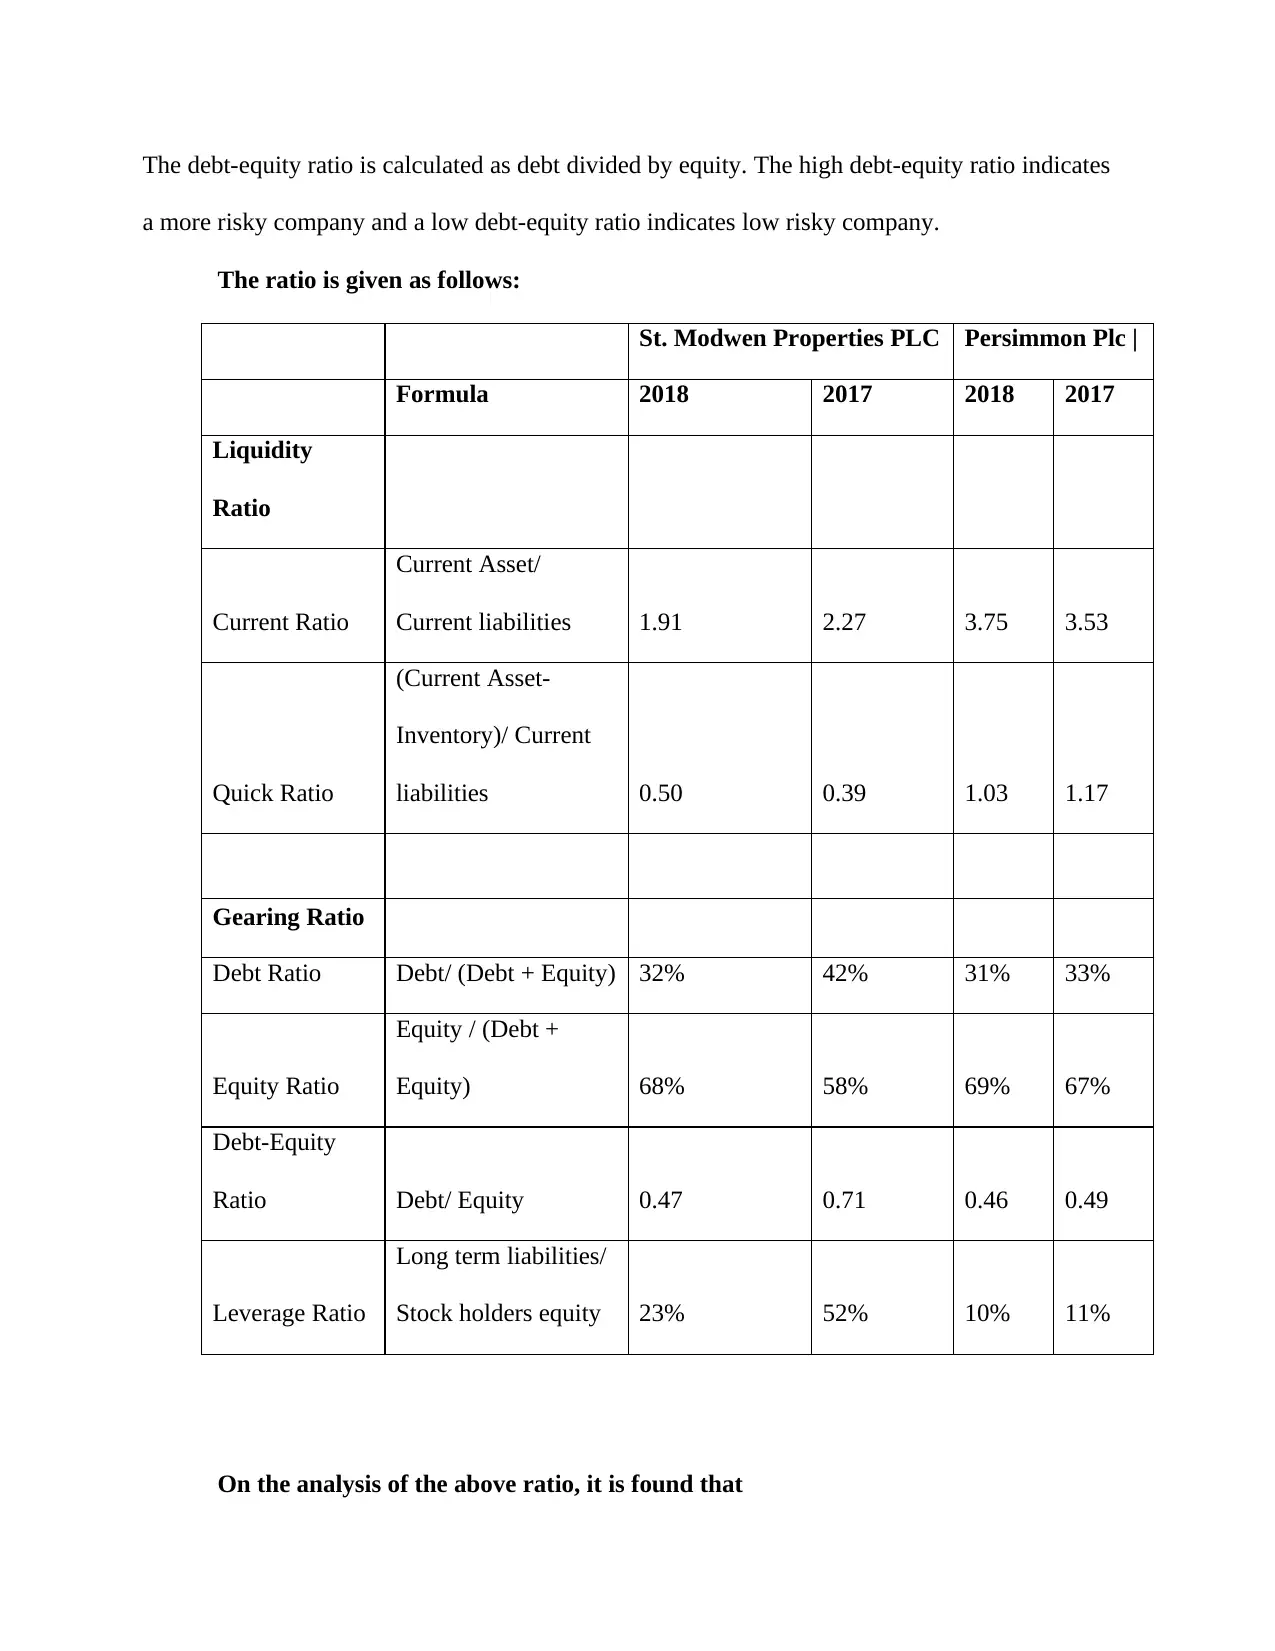
This report provides a comprehensive analysis of the financial performance and valuation of two UK-listed companies, Persimmon Plc and St. Modwen Properties Plc. The analysis begins with an executive summary and introduction, followed by a detailed examination of profitability ratios, including gross profit margin, net profit margin, return on equity, and return on assets. The report then assesses the financial position from both short-term (liquidity) and long-term (gearing) perspectives, utilizing ratios such as the current ratio, quick ratio, debt ratio, and debt-equity ratio. Furthermore, the report evaluates the companies' performance from an equity shareholder's perspective, focusing on return on equity. The study concludes with a comparative analysis of the overall performance and financial position of the businesses, recommending the more suitable company for investment based on the findings. Finally, the valuation of the company is done using the forecast dividend growth model.
Document Page
Title:
Student ID:
tabler-icon-diamond-filled.svg

Paraphrase This Document

Need a fresh take? Get an instant paraphrase of this document with our AI Paraphraser
Document Page
Executive Summary
This report helps to learn various outcomes concerning understanding financial statements. The
report discusses a major issue that is required to be understood by the investor while investing in
such a company. Every investor must keep in mind whether the company is financially viable or
not. To determine whether a company is financially viable or not, some key metrics are required
to be used. Key metrics include ratio analysis, analysis of person involved in decision making, the
employee working in the people, government regulation which may impact the position of
financial statement and financial performance of the company.
It also considers how to determine the price of shares of the company. There are two methods
given in the report and the detailed analysis of the valuation method has been given.
Document Page
Contents
Introduction.......................................................................................................................................4
Part-1.................................................................................................................................................5
An evaluation of profitability........................................................................................................5
An evaluation of the financial position from both a short-term (liquidity) and a long-term
(gearing) perspective.....................................................................................................................8
An evaluation of performance from equity shareholders perspective.........................................12
An evaluation of the overall performance and position of the business.....................................13
Part-2...........................................................................................................................................15
The valuation of the company is done using the forecast dividend growth model.....................15
References:......................................................................................................................................20
Document Page
Introduction
The company subject to this assignment is Perrison Plc and St. Modwen Homes Plc. This report
discussed what evaluation is to be done by shareholders/ investors before any investment to be
made. To analyze the financial performance and financial position of the company, we had
discussed the ratio analysis and common size statement analysis.
Ratio analysis has been done in detail by explaining the current ratio, quick ratio, return on
equity, net profit margin, return on investment, debt-equity ratio, leverage ratio, and others.
The common size statement analysis has been describing the reason for variation in the
percentage of expenses on sales and percentage of change in financial position components such
as current assets, non-current assets, current liability, and non-current liabilities. The ratio
analysis will play a major role in analyzing the financial statement. Such a ratio will reveal
several weaknesses in the financial statement.
Further, the valuation method is given in assignment I,e forecast dividend discount method has
been explained. Generally, the dividend discount method is the same as the discounted cash flow
method. Such a method can be useful in case of company operating is in a stable situation.
tabler-icon-diamond-filled.svg

Paraphrase This Document

Need a fresh take? Get an instant paraphrase of this document with our AI Paraphraser
Document Page
Part-1
An evaluation of profitability
We have to analyze the profitability ratio of the company to evaluate whether the company is
profitable or not. Profit cannot be considered as an indicator of determining efficiency. Hence,
Low profit does not indicate the organization is sick and high profit can not be referred to as
better efficiency of organization Tulsiyan (2014).
There are several method has been adopted to analyze. While analyzing the profitability
ratio of the company the following ratios should be analyzed.
(a) Gross profit margin: it is calculated by taking a division of gross profit and sales.
(b) Net Profit Margin: It is calculated by taking a division of profit before tax and sales.
(c) Return on capital employed: It shows whether the asset is generating better earning. It
indicates the relationship between profit and the amount of capital employed.
(d) Operating Profit: It considers only operational profit while determining the probability
of the company.
(e) Return on equity: It shows whether the organization using its investment to grow in
earnings. An increase in such ratio indicates the company's asset is sufficiently
generating income for equity holders.
Document Page
The ratio of the given company is as follows:
St. Modwen Properties
PLC
Persimm
on Plc |
Profitability
Ratio Formula 2018 2017 2018 2017
Operating
Profit Margin
Net Income/
Total Revenue 32.10% 38.95% 31.72% 30.05%
Net Profit
Margin
Net profit
before tax/Total
revenue 16.72% 22.07% 29.18% 26.85%
Return on
Equity
Net profit after
tax/ Equity 5.76% 5.97% 28.26% 25.15%
Return on
Asset
Net profit/
Average of
Total asset 3.70% 3.53% 19.19% 18.09%
Based on the above analysis, it is observed that the profitability ratio of the company
Persimmon Plc has been increased from the year 2018 to the year 2017. However, in the
case of St. Modwen Properties PLC profitability ratio has been decreased.
Further point of detailed view of profitability ratio it is analyzed that all ratios such as
operating profit margin, net profit margin, return on equity and return on asset has been
Document Page
gone down in the case of St. Motown properties Plc in comparison to last year. It is also
analyzed that such a ratio is less in comparison to Permission Plc. Hence, it can be said
that Permission Plc is more profitable than St. Modwen Properties Plc.
tabler-icon-diamond-filled.svg

Paraphrase This Document

Need a fresh take? Get an instant paraphrase of this document with our AI Paraphraser
Document Page
An evaluation of the financial position from both a short-term (liquidity) and a long-term
(gearing) perspective
Short term Perspectives:
To analyze the company's liquidity position, we have to analyze the short term debt. The
company should use the liquidity ratio to determine whether the company can make
payment of short term debt and obligations. Liquidity ratio consists two another ratios
such as short term liquidity ratio which is also known as solvency ratio and another one is
long term liquidity ratio which is also known as debt management ratios.
Short term liquidity ratios help to determine whether the company can make payment of
the obligation in respect of supply from the supplier and short term credit and any other
bill payments.
It consists of another two ratios namely the current ratio and another quick ratio. The
current ratio is a division of current assets and current liabilities. The quick ratio is the
same as the current ratio however it ignores the inventory while calculating current assets.
An increase in such ratio indicates that better company and able to make payment of short
term lenders on time. The investors should keep in mind that the current asset may be
inflated or current liabilities will be ignored for manipulating the current ratio by
organization. Accordingly, he should be careful that no short term lender remains to be
booked; all transactions must be completely recorded.
Document Page
Liquidity ratios (short-terms solvency ratios) are of particular concern to short-term
lenders and suppliers who provide products and services to the firm on credit. They want
to be sure the company can pay its debts. Liquidity Ratios include the Current Ratio and
the Quick or Acid Test Ratio.
Current ratio: This is calculated as a division of current assets and current liabilities.
Where the current ratio falls below 1, it indicates that the company is not properly making
payoff of its short term lender. A decrease in such ratios indicates the company is facing
issues of liquidity crunch.
Quick Ratio: It is the same as the current ratio. However, it ignores the inventory while
calculating current assets. It states that inventory could not be realized immediately to
make payment to short term lenders.
Long term perspectives:
To analyze the long term liabilities, we should determine the gearing ratio. Leverage ratio is such
which helps to analyze how much percentage of the capital structure contains long term loans and
it also helps to determine whether an organization can make payment of long term perspectives.
The gearing ratio helps to determine whether the firm is financially viable or not. There are
several ratios have been used to analyze the gearing ratios. The gearing ratios include debt-equity
ratio, leverage ratio, debt ratio, and equity ratio Mohammed (2014)
The debt ratio indicates the weight of debt in the total asset of the company, whereas the equity
ratio indicates that the weight of equity in the total asset of the company.
Document Page
The debt-equity ratio is calculated as debt divided by equity. The high debt-equity ratio indicates
a more risky company and a low debt-equity ratio indicates low risky company.
The ratio is given as follows:
St. Modwen Properties PLC Persimmon Plc |
Formula 2018 2017 2018 2017
Liquidity
Ratio
Current Ratio
Current Asset/
Current liabilities 1.91 2.27 3.75 3.53
Quick Ratio
(Current Asset-
Inventory)/ Current
liabilities 0.50 0.39 1.03 1.17
Gearing Ratio
Debt Ratio Debt/ (Debt + Equity) 32% 42% 31% 33%
Equity Ratio
Equity / (Debt +
Equity) 68% 58% 69% 67%
Debt-Equity
Ratio Debt/ Equity 0.47 0.71 0.46 0.49
Leverage Ratio
Long term liabilities/
Stock holders equity 23% 52% 10% 11%
On the analysis of the above ratio, it is found that
tabler-icon-diamond-filled.svg

Paraphrase This Document

Need a fresh take? Get an instant paraphrase of this document with our AI Paraphraser
Document Page
(i) The current and quick ratio of persimmon Plc has been increased from last year as
well as St. Modwen Properties Plc. Here, the quick ratio of St. Modwen Properties
Plc is less than 1, which shows its current asset is not much capable to make
payment of short term obligation.
(ii) Gearing ratio, where only 10% leverage ratio in case of instead of Persimmon Plc
23% in St. Modwen Properties. It shows that St. Modwen Properties is risky in
comparison to Persimmon Plc.
Document Page
An evaluation of performance from an equity shareholders perspective
To determine the ratio of the financial performance of the company from a viewpoint of
shareholders, we are required to analyze the investment ratios. Investment ratios are those
ratios that help an investor to determine whether the financial of a company is viable or
not.
Several ratios can be used to analyze the performance of the company from equity
shareholder's perspectives which include dividend payout ratio, P/E ratio and Return on
equity. (Ichsani & Suhardi 2015)
Return on equity:
St. Modwen Properties
PLC
Persimmo
n Plc |
Profitability
Ratio Formula 2018 2017 2018 2017
Return on
Equity
Net profit after
tax/ Equity 5.76% 5.97% 28.26% 25.15%
Here, it is analyzed that return form persimmon Plc is 28.26 which are increased from
25.15% of the year 2017 as compared to 5.76% in the case of St. Modwen Properties.
chevron_up_icon
1 out of 21
circle_padding
hide_on_mobile
zoom_out_icon
[object Object]