Comparative Financial Analysis: Daimler vs. Tesla (2014-2017)
VerifiedAdded on 2020/12/10
|27
|9136
|179
Report
AI Summary
This report presents a detailed financial analysis of Daimler and Tesla, evaluating their performance from 2014 to 2017. The analysis encompasses ratio analysis, including liquidity, profitability, efficiency, and leverage ratios, providing a comparative view of their financial health. Horizontal and vertical analyses of the income statement and balance sheet are conducted to identify trends and performance changes over the period. The report also assesses the cash positions of both companies. The findings reveal Daimler's stronger performance in profitability and efficiency metrics compared to Tesla, while Tesla demonstrates higher turnover on assets in earlier years. The report highlights key financial strengths and weaknesses, offering insights into the companies' financial strategies and overall performance.

FINANCIAL ANALYSIS
MANAGEMENT &
ENTERPRISE - FAME
MANAGEMENT &
ENTERPRISE - FAME
Paraphrase This Document
Need a fresh take? Get an instant paraphrase of this document with our AI Paraphraser
TABLE OF CONTENTS
INTRODUCTION...........................................................................................................................1
Ratio Analysis..............................................................................................................................1
Daimler's Horizontal analysis of statement of profit and loss.....................................................4
Daimler's Horizontal analysis of statement of financial position................................................5
Daimler's Vertical analysis of statement of profit and loss.........................................................7
Daimler's Vertical analysis of statement of financial position....................................................8
Tesla's horizontal analysis of statement of profit and loss.........................................................10
Tesla's horizontal analysis of statement of financial position....................................................11
Tesla's vertical analysis of statement of profit and loss.............................................................13
Tesla's vertical analysis of statement of financial position........................................................14
2. Analysing cash position of both organization........................................................................16
CONCLUSION..............................................................................................................................17
REFERENCES..............................................................................................................................18
APPENDIX....................................................................................................................................19
INTRODUCTION
Financial analysis is considered as process for business evaluation, budgets, projects
along with other entities on basis of finance. The present report will give brief discussion about
financial performance of Daimler and Tesla with context of ratio analysis, horizontal and vertical
analysis of their financial position. It will articulate about cash position of these specified
business entities.
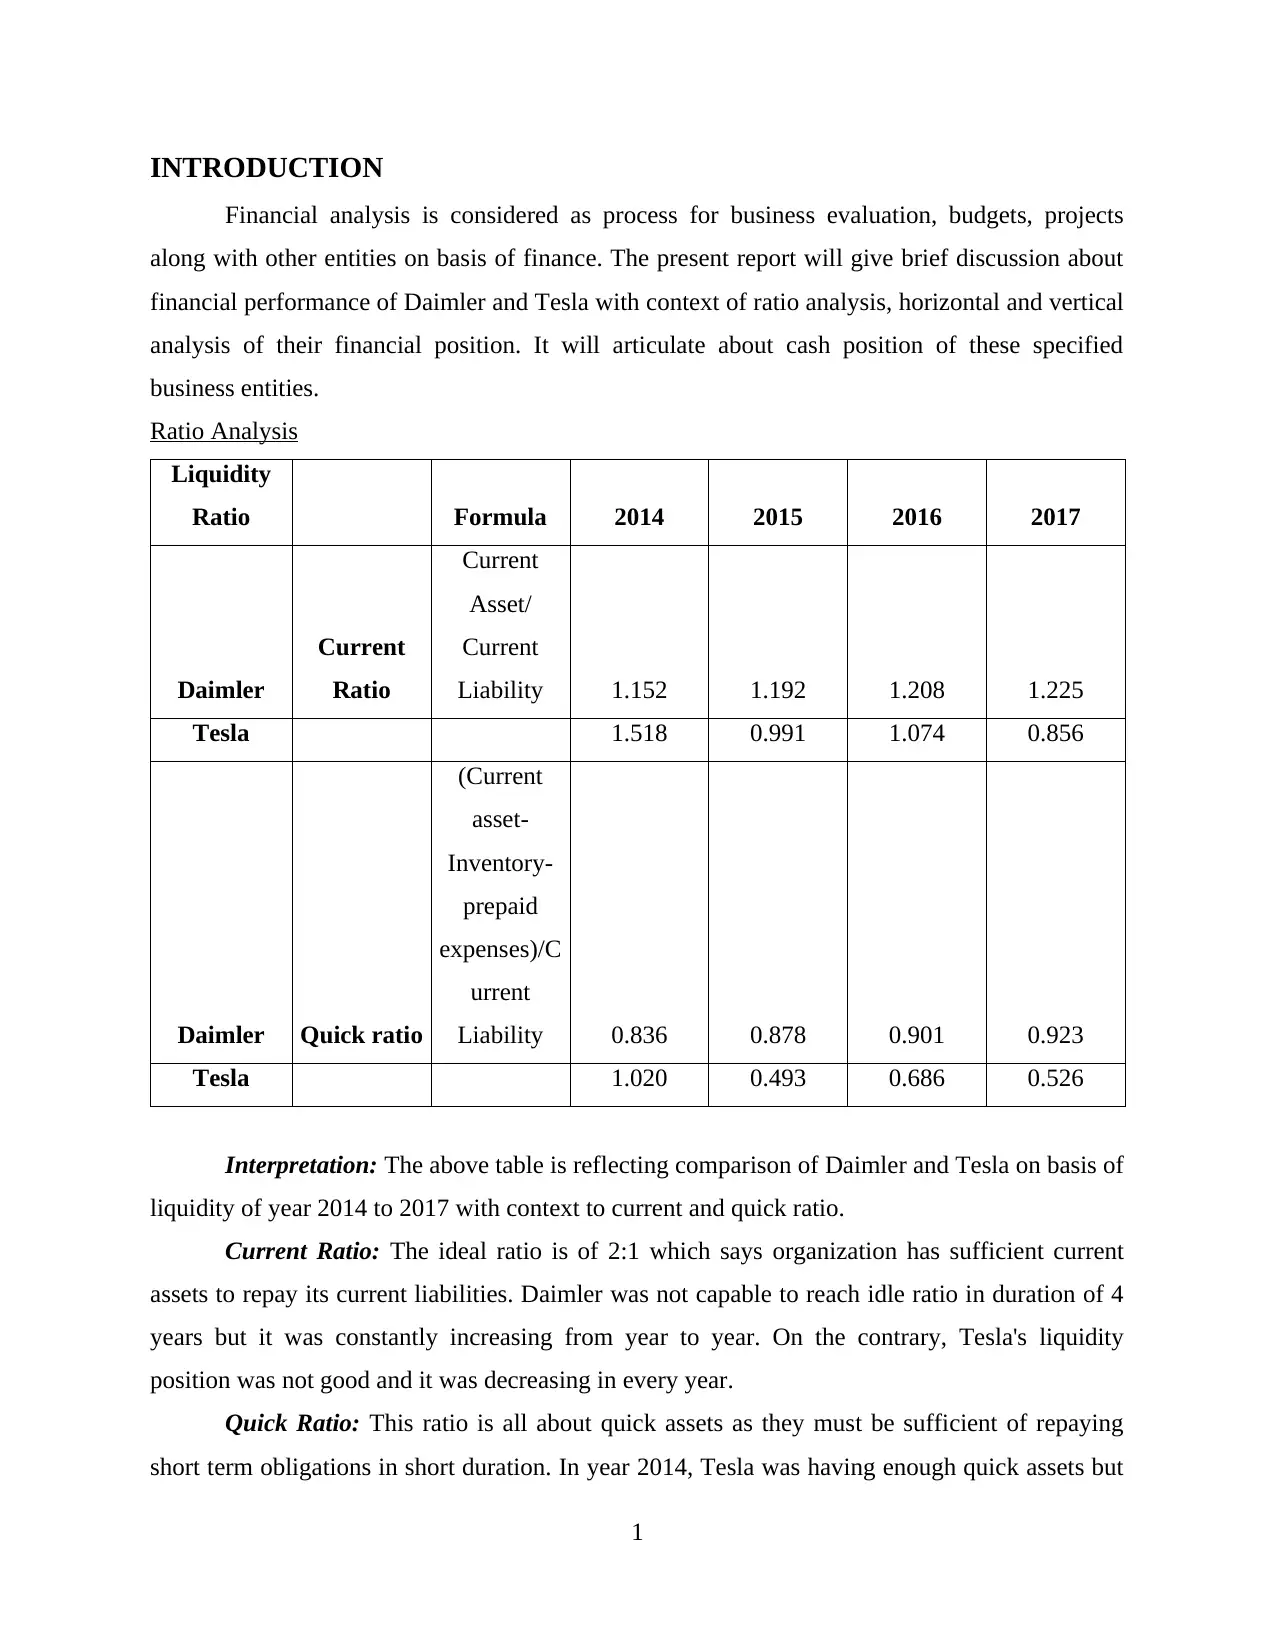
Ratio Analysis
Liquidity
Ratio Formula 2014 2015 2016 2017
Daimler
Current
Ratio
Current
Asset/
Current
Liability 1.152 1.192 1.208 1.225
Tesla 1.518 0.991 1.074 0.856
Daimler Quick ratio
(Current
asset-
Inventory-
prepaid
expenses)/C
urrent
Liability 0.836 0.878 0.901 0.923
Tesla 1.020 0.493 0.686 0.526
Interpretation: The above table is reflecting comparison of Daimler and Tesla on basis of
liquidity of year 2014 to 2017 with context to current and quick ratio.
Current Ratio: The ideal ratio is of 2:1 which says organization has sufficient current
assets to repay its current liabilities. Daimler was not capable to reach idle ratio in duration of 4
years but it was constantly increasing from year to year. On the contrary, Tesla's liquidity
position was not good and it was decreasing in every year.
Quick Ratio: This ratio is all about quick assets as they must be sufficient of repaying
short term obligations in short duration. In year 2014, Tesla was having enough quick assets but
1
Financial analysis is considered as process for business evaluation, budgets, projects
along with other entities on basis of finance. The present report will give brief discussion about
financial performance of Daimler and Tesla with context of ratio analysis, horizontal and vertical
analysis of their financial position. It will articulate about cash position of these specified
business entities.
Ratio Analysis
Liquidity
Ratio Formula 2014 2015 2016 2017
Daimler
Current
Ratio
Current
Asset/
Current
Liability 1.152 1.192 1.208 1.225
Tesla 1.518 0.991 1.074 0.856
Daimler Quick ratio
(Current
asset-
Inventory-
prepaid
expenses)/C
urrent
Liability 0.836 0.878 0.901 0.923
Tesla 1.020 0.493 0.686 0.526
Interpretation: The above table is reflecting comparison of Daimler and Tesla on basis of
liquidity of year 2014 to 2017 with context to current and quick ratio.
Current Ratio: The ideal ratio is of 2:1 which says organization has sufficient current
assets to repay its current liabilities. Daimler was not capable to reach idle ratio in duration of 4
years but it was constantly increasing from year to year. On the contrary, Tesla's liquidity
position was not good and it was decreasing in every year.
Quick Ratio: This ratio is all about quick assets as they must be sufficient of repaying
short term obligations in short duration. In year 2014, Tesla was having enough quick assets but
1
⊘ This is a preview!⊘
Do you want full access?
Subscribe today to unlock all pages.
Trusted by 1+ million students worldwide
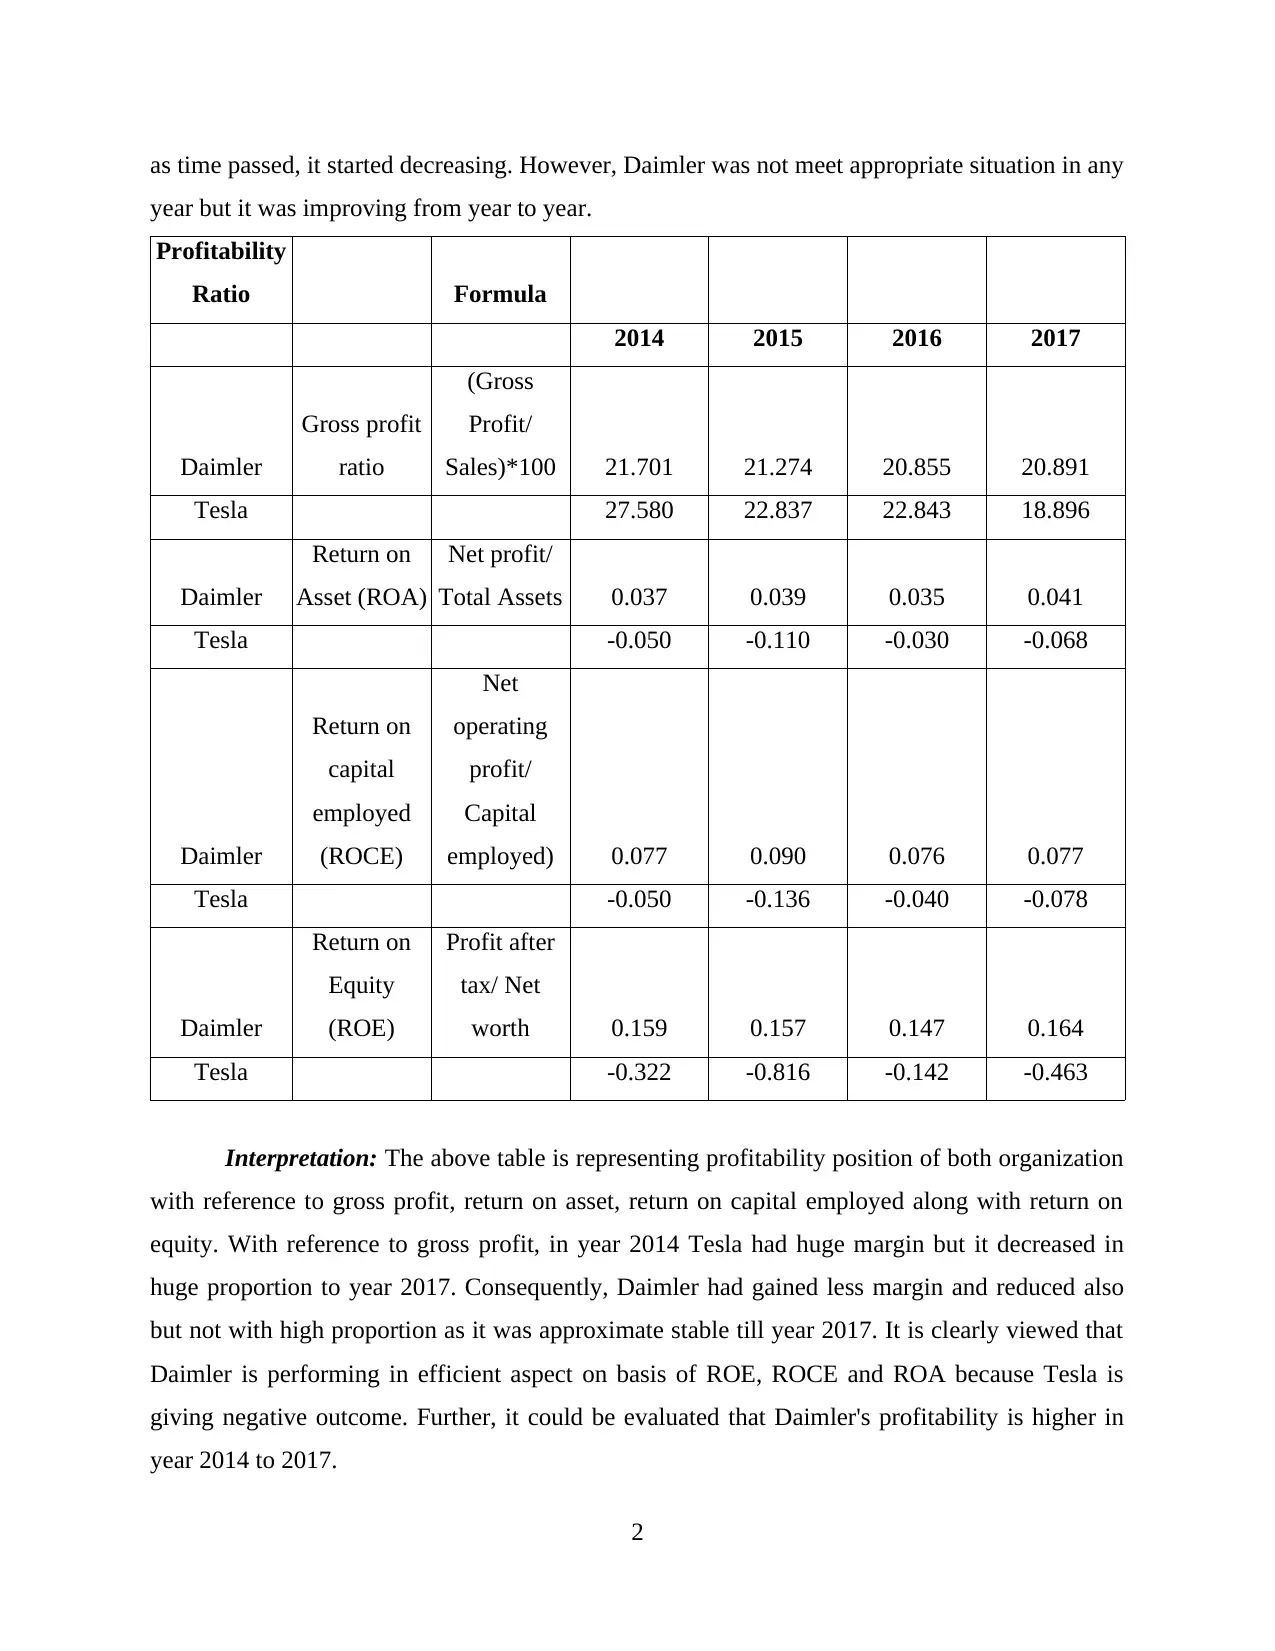
as time passed, it started decreasing. However, Daimler was not meet appropriate situation in any
year but it was improving from year to year.
Profitability
Ratio Formula
2014 2015 2016 2017
Daimler
Gross profit
ratio
(Gross
Profit/
Sales)*100 21.701 21.274 20.855 20.891
Tesla 27.580 22.837 22.843 18.896
Daimler
Return on
Asset (ROA)
Net profit/
Total Assets 0.037 0.039 0.035 0.041
Tesla -0.050 -0.110 -0.030 -0.068
Daimler
Return on
capital
employed
(ROCE)
Net
operating
profit/
Capital
employed) 0.077 0.090 0.076 0.077
Tesla -0.050 -0.136 -0.040 -0.078
Daimler
Return on
Equity
(ROE)
Profit after
tax/ Net
worth 0.159 0.157 0.147 0.164
Tesla -0.322 -0.816 -0.142 -0.463
Interpretation: The above table is representing profitability position of both organization
with reference to gross profit, return on asset, return on capital employed along with return on
equity. With reference to gross profit, in year 2014 Tesla had huge margin but it decreased in
huge proportion to year 2017. Consequently, Daimler had gained less margin and reduced also
but not with high proportion as it was approximate stable till year 2017. It is clearly viewed that
Daimler is performing in efficient aspect on basis of ROE, ROCE and ROA because Tesla is
giving negative outcome. Further, it could be evaluated that Daimler's profitability is higher in
year 2014 to 2017.
2
Paraphrase This Document
Need a fresh take? Get an instant paraphrase of this document with our AI Paraphraser
Efficiency
Ratio Formula 2014 2015 2016 2017
Daimler
Asset
Turnover
Ratio
Net sales/
Average
total asset 0.725 0.735 0.666 0.659
Tesla 0.774 0.580 0.455 0.458
Daimler
Inventory
turnover
ratio
Cost of
goods sold/
Average
inventory 5.322 5.274 4.936 5.091
Tesla 3.58 2.80 3.23 4.40
Daimler
Days' Sales
in inventory
(Closing
stock/ Cost
of goods
sold)*365 74.889 73.701 76.383 72.119
Tesla 150.285 149.366 139.688 86.657
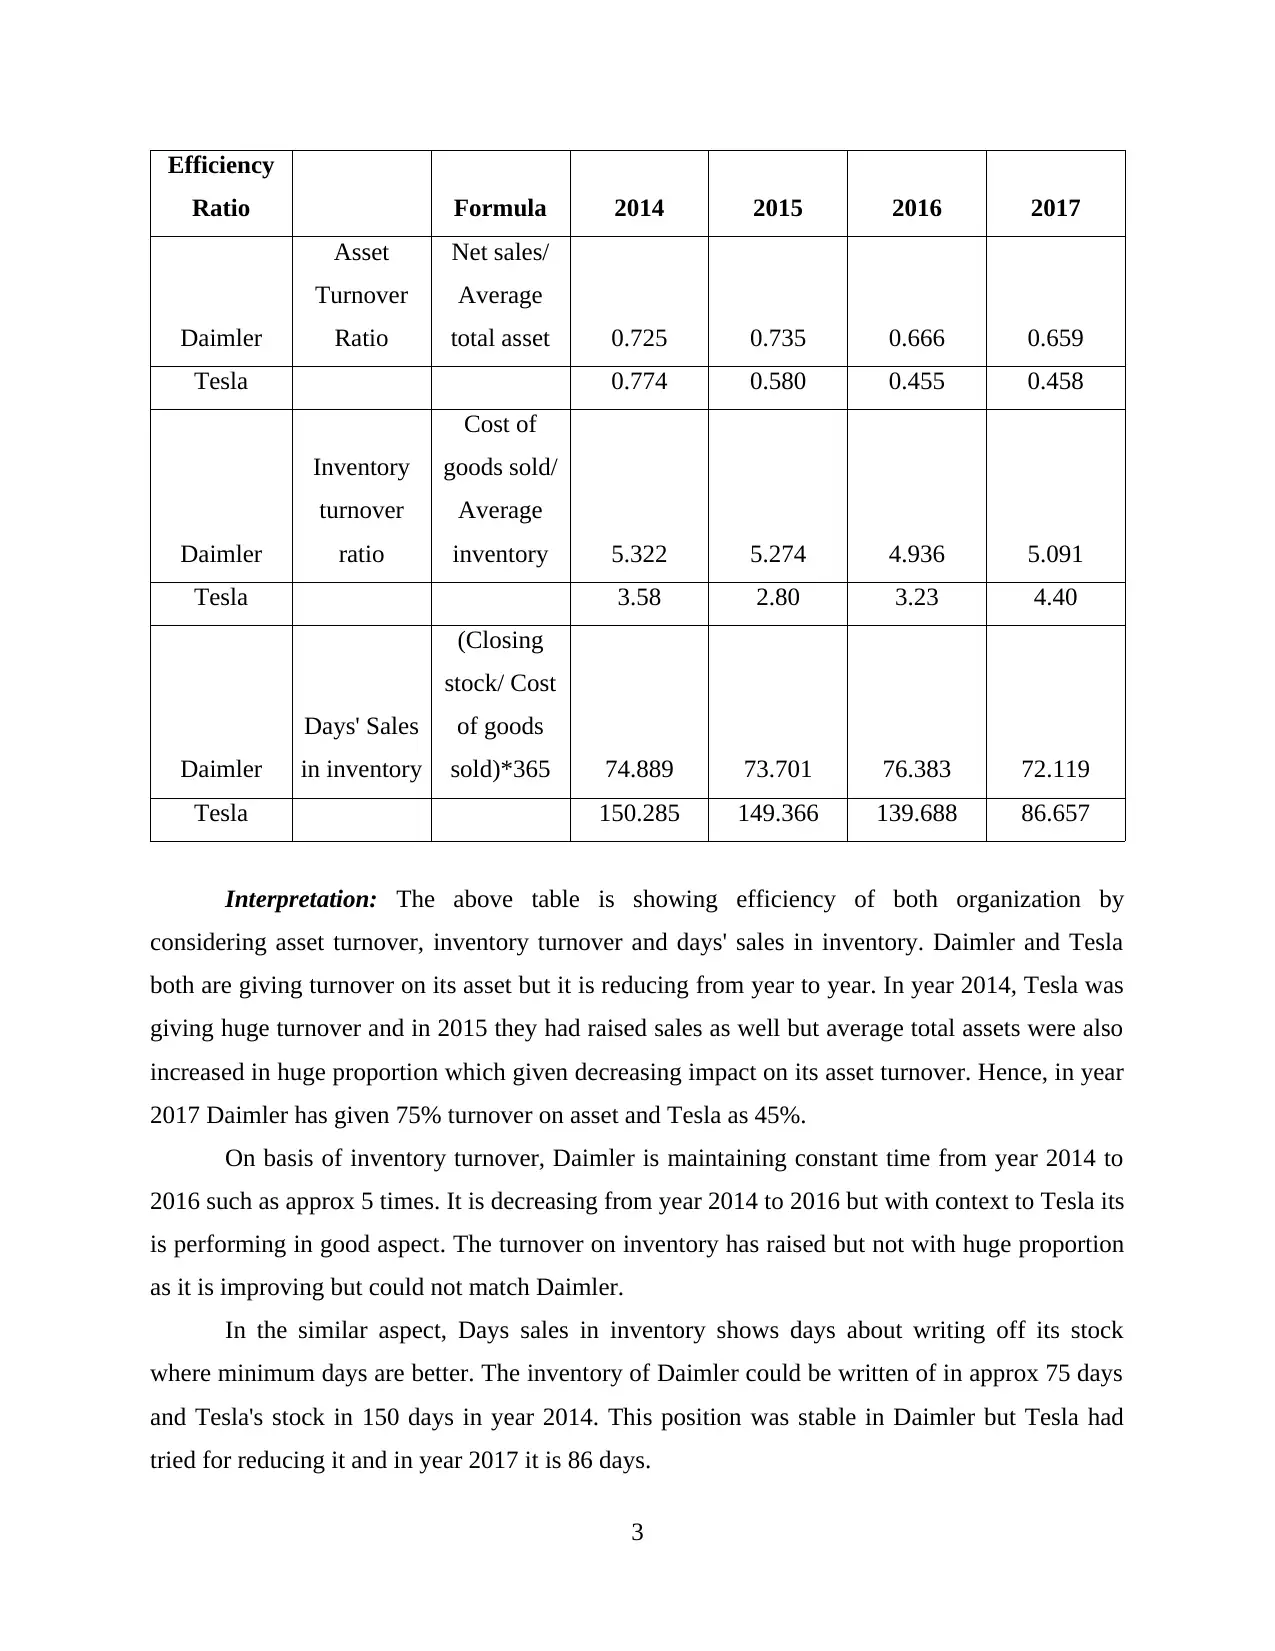
Interpretation: The above table is showing efficiency of both organization by
considering asset turnover, inventory turnover and days' sales in inventory. Daimler and Tesla
both are giving turnover on its asset but it is reducing from year to year. In year 2014, Tesla was
giving huge turnover and in 2015 they had raised sales as well but average total assets were also
increased in huge proportion which given decreasing impact on its asset turnover. Hence, in year
2017 Daimler has given 75% turnover on asset and Tesla as 45%.
On basis of inventory turnover, Daimler is maintaining constant time from year 2014 to
2016 such as approx 5 times. It is decreasing from year 2014 to 2016 but with context to Tesla its
is performing in good aspect. The turnover on inventory has raised but not with huge proportion
as it is improving but could not match Daimler.
In the similar aspect, Days sales in inventory shows days about writing off its stock
where minimum days are better. The inventory of Daimler could be written of in approx 75 days
and Tesla's stock in 150 days in year 2014. This position was stable in Daimler but Tesla had
tried for reducing it and in year 2017 it is 86 days.
3
Ratio Formula 2014 2015 2016 2017
Daimler
Asset
Turnover
Ratio
Net sales/
Average
total asset 0.725 0.735 0.666 0.659
Tesla 0.774 0.580 0.455 0.458
Daimler
Inventory
turnover
ratio
Cost of
goods sold/
Average
inventory 5.322 5.274 4.936 5.091
Tesla 3.58 2.80 3.23 4.40
Daimler
Days' Sales
in inventory
(Closing
stock/ Cost
of goods
sold)*365 74.889 73.701 76.383 72.119
Tesla 150.285 149.366 139.688 86.657
Interpretation: The above table is showing efficiency of both organization by
considering asset turnover, inventory turnover and days' sales in inventory. Daimler and Tesla
both are giving turnover on its asset but it is reducing from year to year. In year 2014, Tesla was
giving huge turnover and in 2015 they had raised sales as well but average total assets were also
increased in huge proportion which given decreasing impact on its asset turnover. Hence, in year
2017 Daimler has given 75% turnover on asset and Tesla as 45%.
On basis of inventory turnover, Daimler is maintaining constant time from year 2014 to
2016 such as approx 5 times. It is decreasing from year 2014 to 2016 but with context to Tesla its
is performing in good aspect. The turnover on inventory has raised but not with huge proportion
as it is improving but could not match Daimler.
In the similar aspect, Days sales in inventory shows days about writing off its stock
where minimum days are better. The inventory of Daimler could be written of in approx 75 days
and Tesla's stock in 150 days in year 2014. This position was stable in Daimler but Tesla had
tried for reducing it and in year 2017 it is 86 days.
3
Leverage
Ratio Formula 2014 2015 2016 2017
Daimler Debt ratio
total
liabilities/
Total asset 0.770 0.753 0.762 0.750
Tesla 0.844 0.866 0.790 0.852
Daimler Equity ratio
Total Equity/
Total Assets 0.230 0.247 0.238 0.250
Tesla 0.156 0.135 0.210 0.148
Daimler
Debt equity
ratio
Total
Liabilities/
Total Equity 3.344 3.055 3.193 2.992
Tesla 5.414 6.432 3.768 5.763
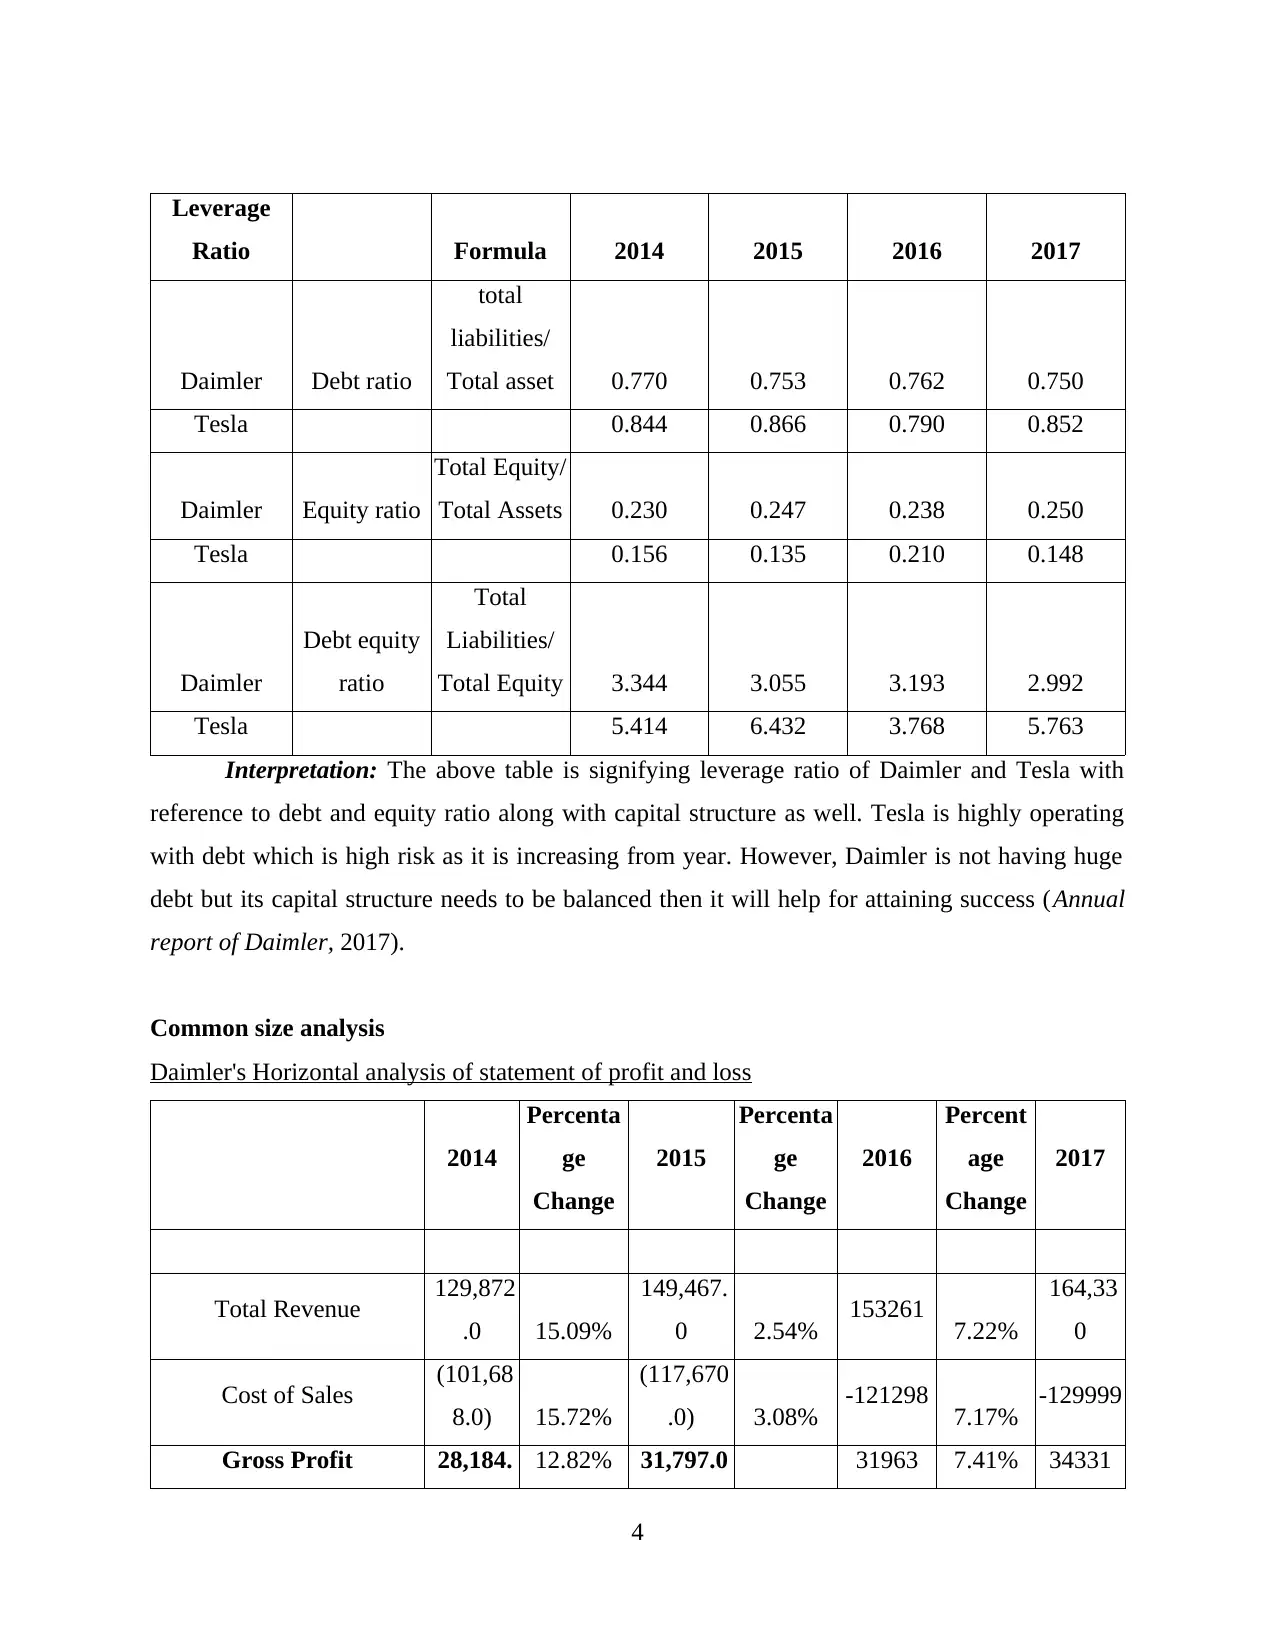
Interpretation: The above table is signifying leverage ratio of Daimler and Tesla with
reference to debt and equity ratio along with capital structure as well. Tesla is highly operating
with debt which is high risk as it is increasing from year. However, Daimler is not having huge
debt but its capital structure needs to be balanced then it will help for attaining success (Annual
report of Daimler, 2017).
Common size analysis
Daimler's Horizontal analysis of statement of profit and loss
2014
Percenta
ge
Change
2015
Percenta
ge
Change
2016
Percent
age
Change
2017
Total Revenue 129,872
.0 15.09%
149,467.
0 2.54% 153261 7.22%
164,33
0
Cost of Sales (101,68
8.0) 15.72%
(117,670
.0) 3.08% -121298 7.17% -129999
Gross Profit 28,184. 12.82% 31,797.0 31963 7.41% 34331
4
Ratio Formula 2014 2015 2016 2017
Daimler Debt ratio
total
liabilities/
Total asset 0.770 0.753 0.762 0.750
Tesla 0.844 0.866 0.790 0.852
Daimler Equity ratio
Total Equity/
Total Assets 0.230 0.247 0.238 0.250
Tesla 0.156 0.135 0.210 0.148
Daimler
Debt equity
ratio
Total
Liabilities/
Total Equity 3.344 3.055 3.193 2.992
Tesla 5.414 6.432 3.768 5.763
Interpretation: The above table is signifying leverage ratio of Daimler and Tesla with
reference to debt and equity ratio along with capital structure as well. Tesla is highly operating
with debt which is high risk as it is increasing from year. However, Daimler is not having huge
debt but its capital structure needs to be balanced then it will help for attaining success (Annual
report of Daimler, 2017).
Common size analysis
Daimler's Horizontal analysis of statement of profit and loss
2014
Percenta
ge
Change
2015
Percenta
ge
Change
2016
Percent
age
Change
2017
Total Revenue 129,872
.0 15.09%
149,467.
0 2.54% 153261 7.22%
164,33
0
Cost of Sales (101,68
8.0) 15.72%
(117,670
.0) 3.08% -121298 7.17% -129999
Gross Profit 28,184. 12.82% 31,797.0 31963 7.41% 34331
4
⊘ This is a preview!⊘
Do you want full access?
Subscribe today to unlock all pages.
Trusted by 1+ million students worldwide
0
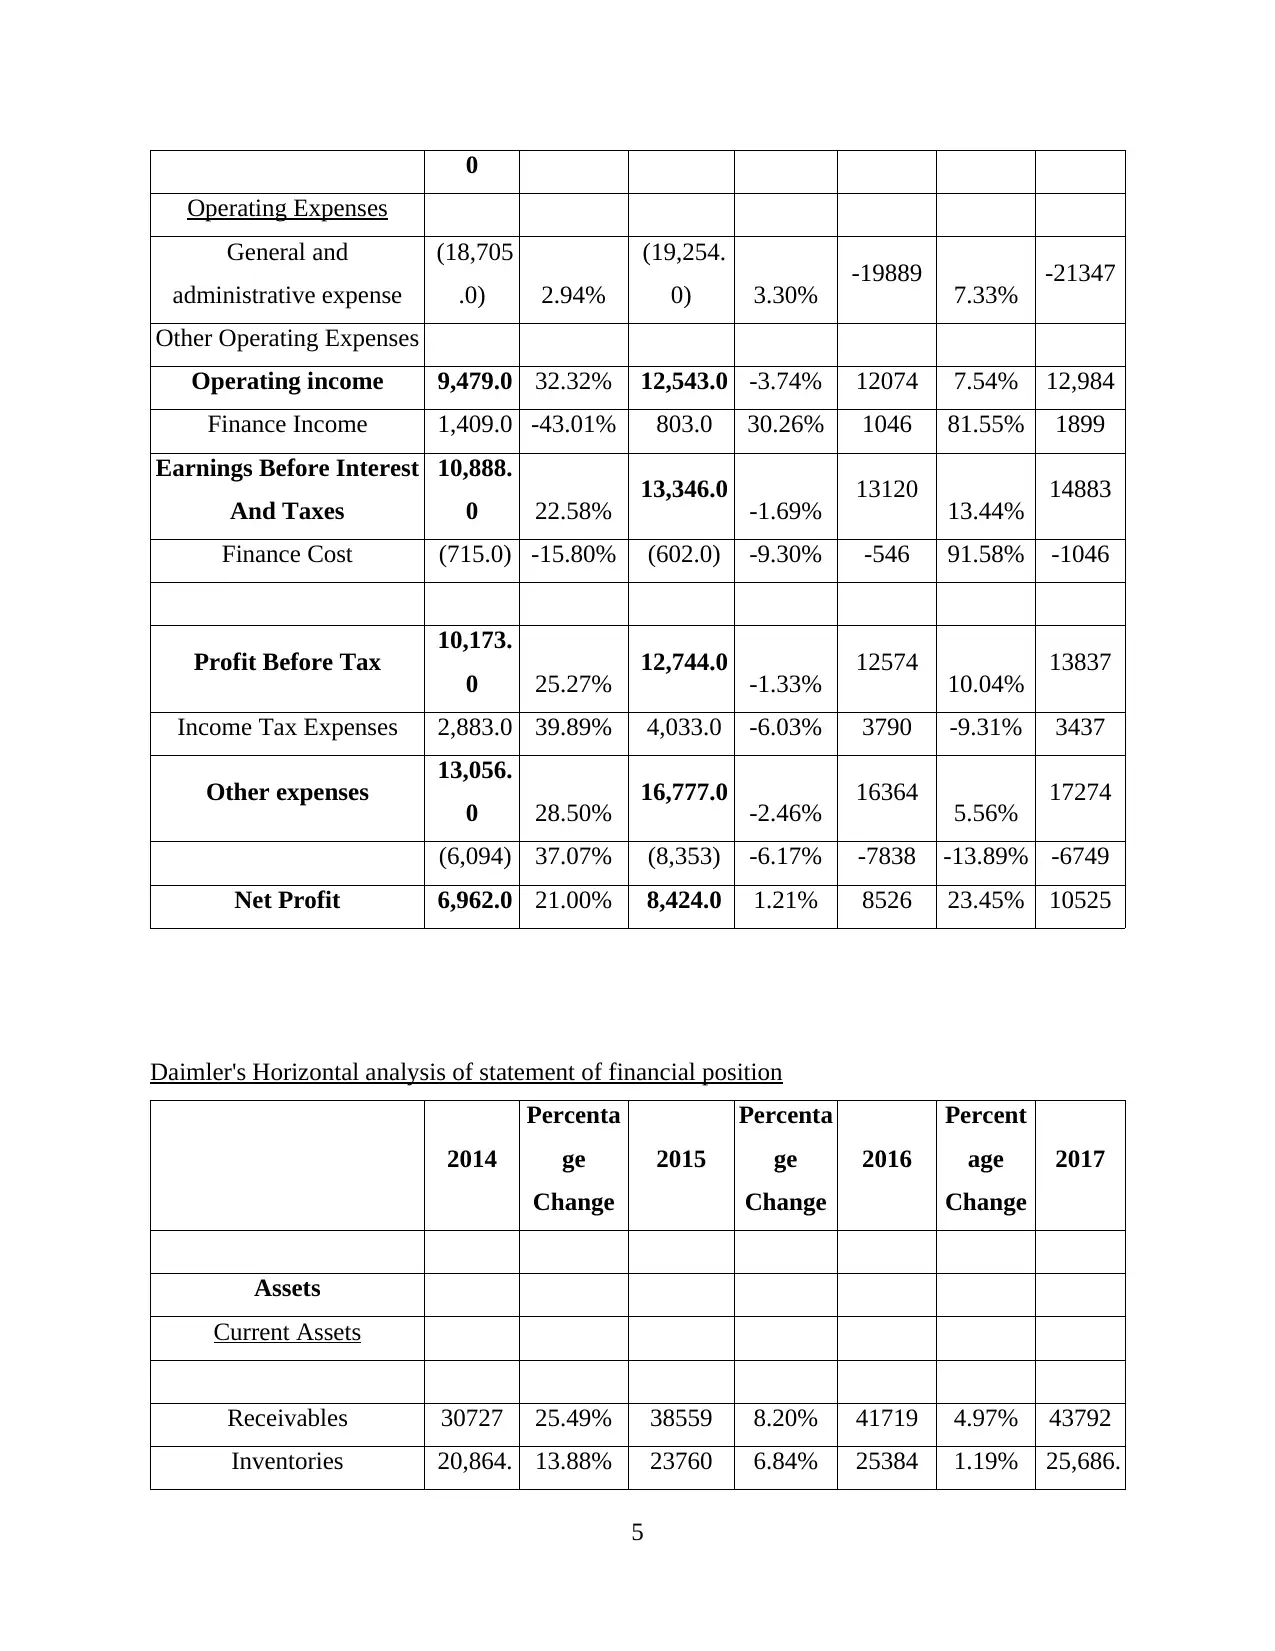
Operating Expenses
General and
administrative expense
(18,705
.0) 2.94%
(19,254.
0) 3.30% -19889 7.33% -21347
Other Operating Expenses
Operating income 9,479.0 32.32% 12,543.0 -3.74% 12074 7.54% 12,984
Finance Income 1,409.0 -43.01% 803.0 30.26% 1046 81.55% 1899
Earnings Before Interest
And Taxes
10,888.
0 22.58% 13,346.0 -1.69% 13120 13.44% 14883
Finance Cost (715.0) -15.80% (602.0) -9.30% -546 91.58% -1046
Profit Before Tax 10,173.
0 25.27% 12,744.0 -1.33% 12574 10.04% 13837
Income Tax Expenses 2,883.0 39.89% 4,033.0 -6.03% 3790 -9.31% 3437
Other expenses 13,056.
0 28.50% 16,777.0 -2.46% 16364 5.56% 17274
(6,094) 37.07% (8,353) -6.17% -7838 -13.89% -6749
Net Profit 6,962.0 21.00% 8,424.0 1.21% 8526 23.45% 10525
Daimler's Horizontal analysis of statement of financial position
2014
Percenta
ge
Change
2015
Percenta
ge
Change
2016
Percent
age
Change
2017
Assets
Current Assets
Receivables 30727 25.49% 38559 8.20% 41719 4.97% 43792
Inventories 20,864. 13.88% 23760 6.84% 25384 1.19% 25,686.
5
Paraphrase This Document
Need a fresh take? Get an instant paraphrase of this document with our AI Paraphraser
00 0
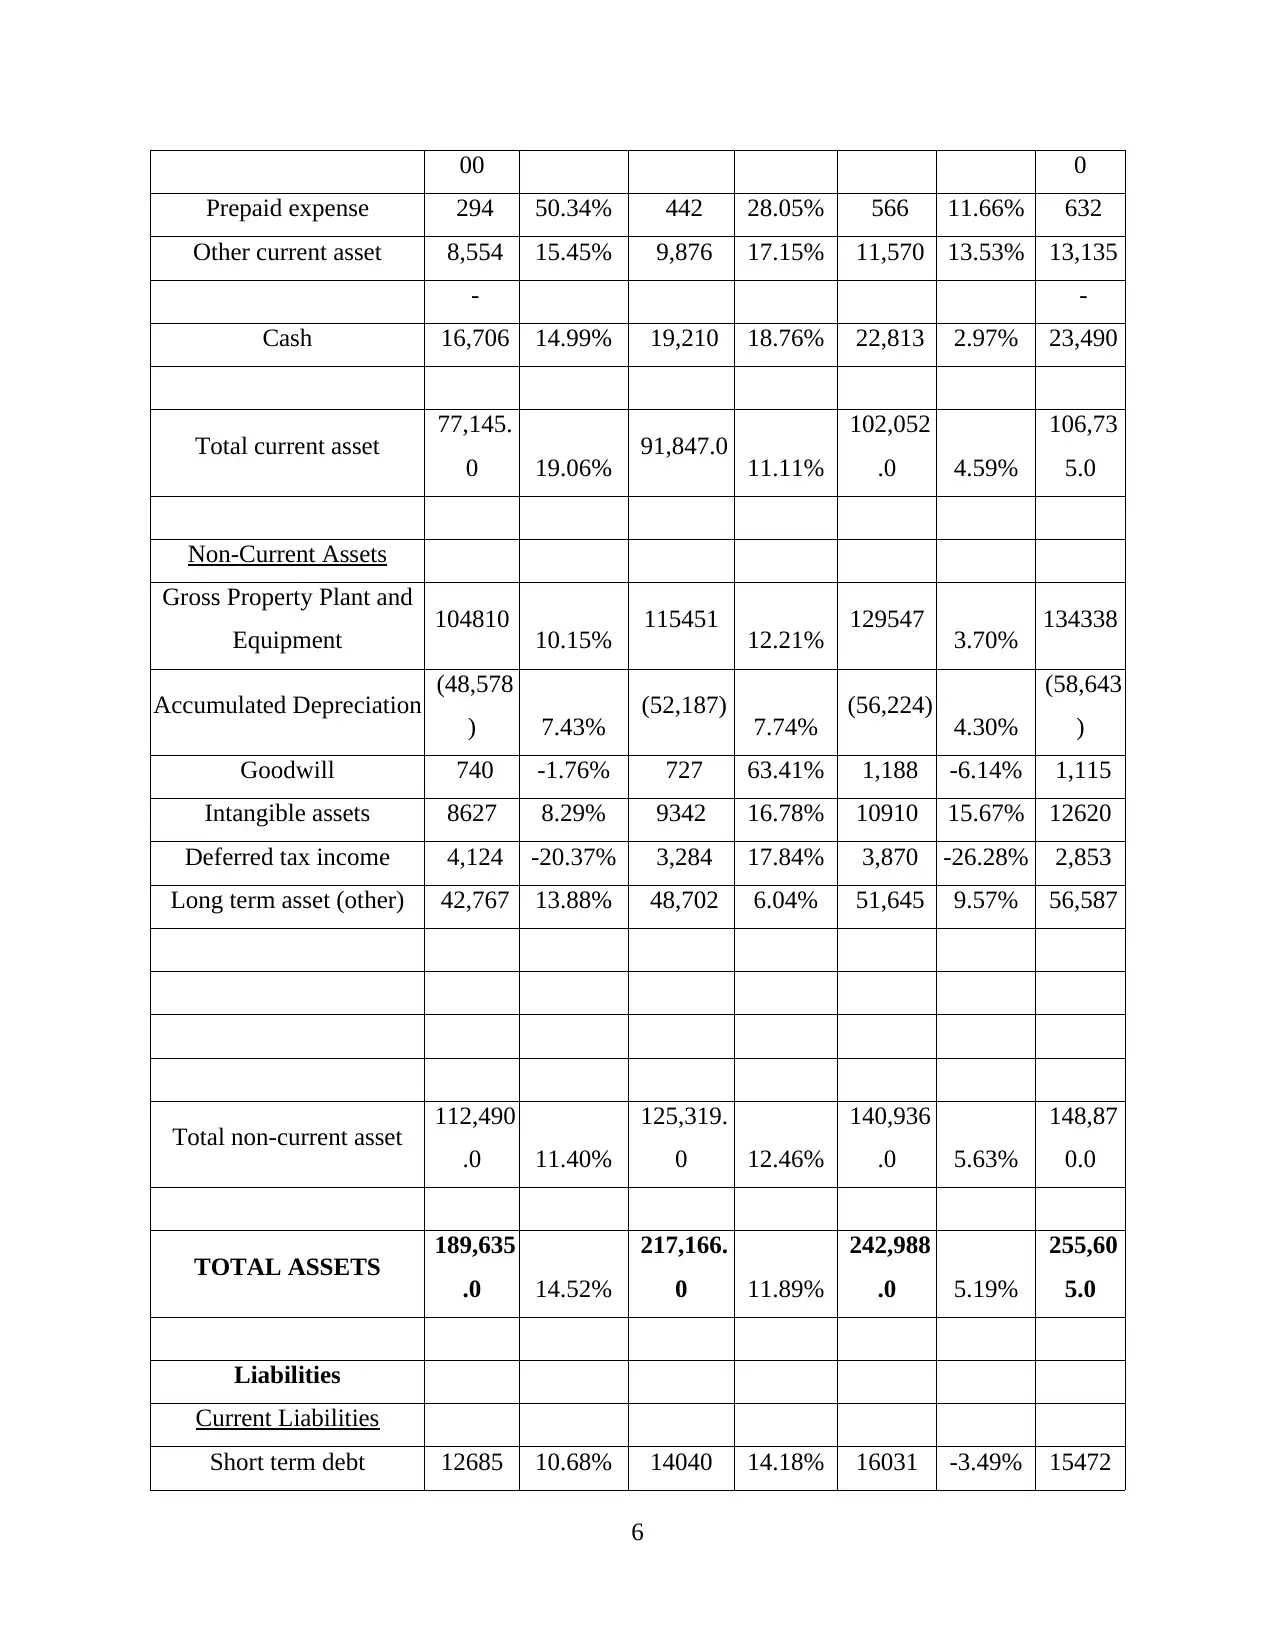
Prepaid expense 294 50.34% 442 28.05% 566 11.66% 632
Other current asset 8,554 15.45% 9,876 17.15% 11,570 13.53% 13,135
- -
Cash 16,706 14.99% 19,210 18.76% 22,813 2.97% 23,490
Total current asset 77,145.
0 19.06% 91,847.0 11.11%
102,052
.0 4.59%
106,73
5.0
Non-Current Assets
Gross Property Plant and
Equipment 104810 10.15% 115451 12.21% 129547 3.70% 134338
Accumulated Depreciation (48,578
) 7.43% (52,187) 7.74% (56,224) 4.30%
(58,643
)
Goodwill 740 -1.76% 727 63.41% 1,188 -6.14% 1,115
Intangible assets 8627 8.29% 9342 16.78% 10910 15.67% 12620
Deferred tax income 4,124 -20.37% 3,284 17.84% 3,870 -26.28% 2,853
Long term asset (other) 42,767 13.88% 48,702 6.04% 51,645 9.57% 56,587
Total non-current asset 112,490
.0 11.40%
125,319.
0 12.46%
140,936
.0 5.63%
148,87
0.0
TOTAL ASSETS 189,635
.0 14.52%
217,166.
0 11.89%
242,988
.0 5.19%
255,60
5.0
Liabilities
Current Liabilities
Short term debt 12685 10.68% 14040 14.18% 16031 -3.49% 15472
6
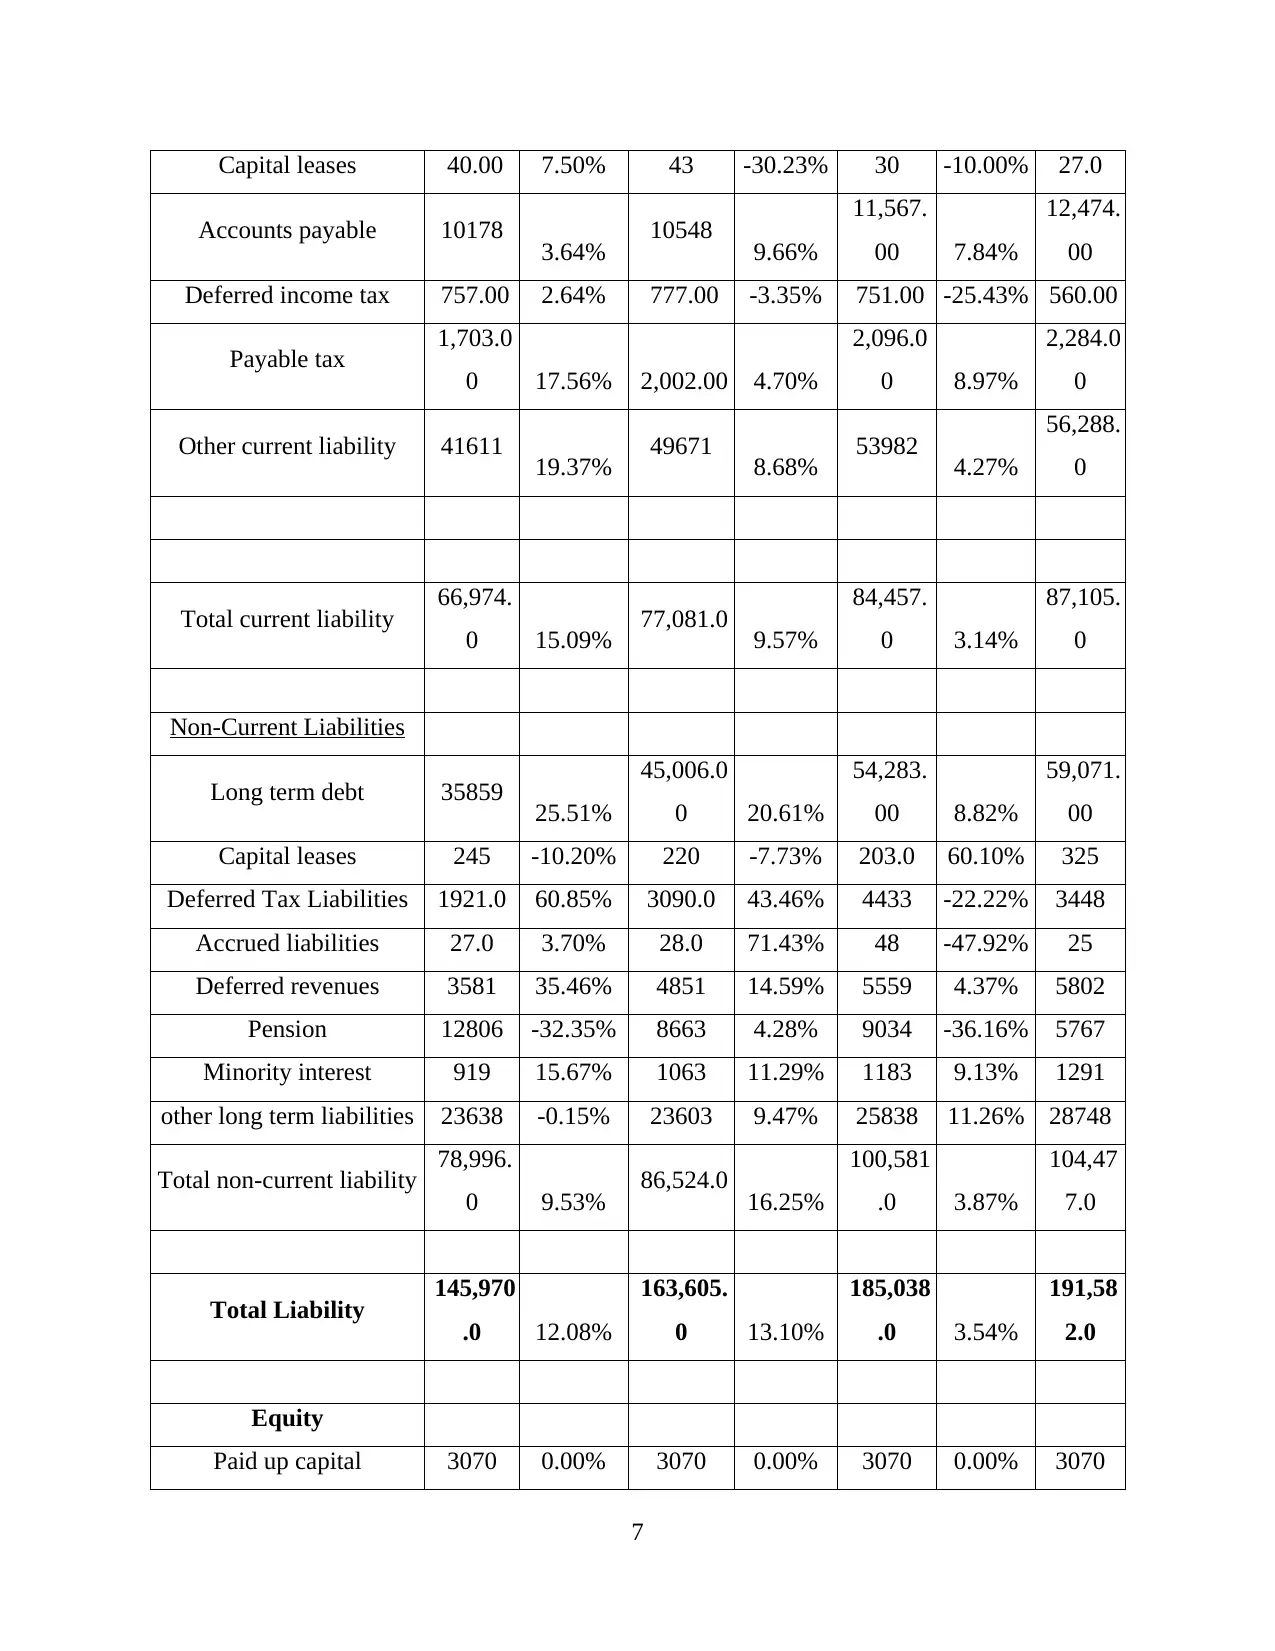
Capital leases 40.00 7.50% 43 -30.23% 30 -10.00% 27.0
Accounts payable 10178 3.64% 10548 9.66%
11,567.
00 7.84%
12,474.
00
Deferred income tax 757.00 2.64% 777.00 -3.35% 751.00 -25.43% 560.00
Payable tax 1,703.0
0 17.56% 2,002.00 4.70%
2,096.0
0 8.97%
2,284.0
0
Other current liability 41611 19.37% 49671 8.68% 53982 4.27%
56,288.
0
Total current liability 66,974.
0 15.09% 77,081.0 9.57%
84,457.
0 3.14%
87,105.
0
Non-Current Liabilities
Long term debt 35859 25.51%
45,006.0
0 20.61%
54,283.
00 8.82%
59,071.
00
Capital leases 245 -10.20% 220 -7.73% 203.0 60.10% 325
Deferred Tax Liabilities 1921.0 60.85% 3090.0 43.46% 4433 -22.22% 3448
Accrued liabilities 27.0 3.70% 28.0 71.43% 48 -47.92% 25
Deferred revenues 3581 35.46% 4851 14.59% 5559 4.37% 5802
Pension 12806 -32.35% 8663 4.28% 9034 -36.16% 5767
Minority interest 919 15.67% 1063 11.29% 1183 9.13% 1291
other long term liabilities 23638 -0.15% 23603 9.47% 25838 11.26% 28748
Total non-current liability 78,996.
0 9.53% 86,524.0 16.25%
100,581
.0 3.87%
104,47
7.0
Total Liability 145,970
.0 12.08%
163,605.
0 13.10%
185,038
.0 3.54%
191,58
2.0
Equity
Paid up capital 3070 0.00% 3070 0.00% 3070 0.00% 3070
7
⊘ This is a preview!⊘
Do you want full access?
Subscribe today to unlock all pages.
Trusted by 1+ million students worldwide
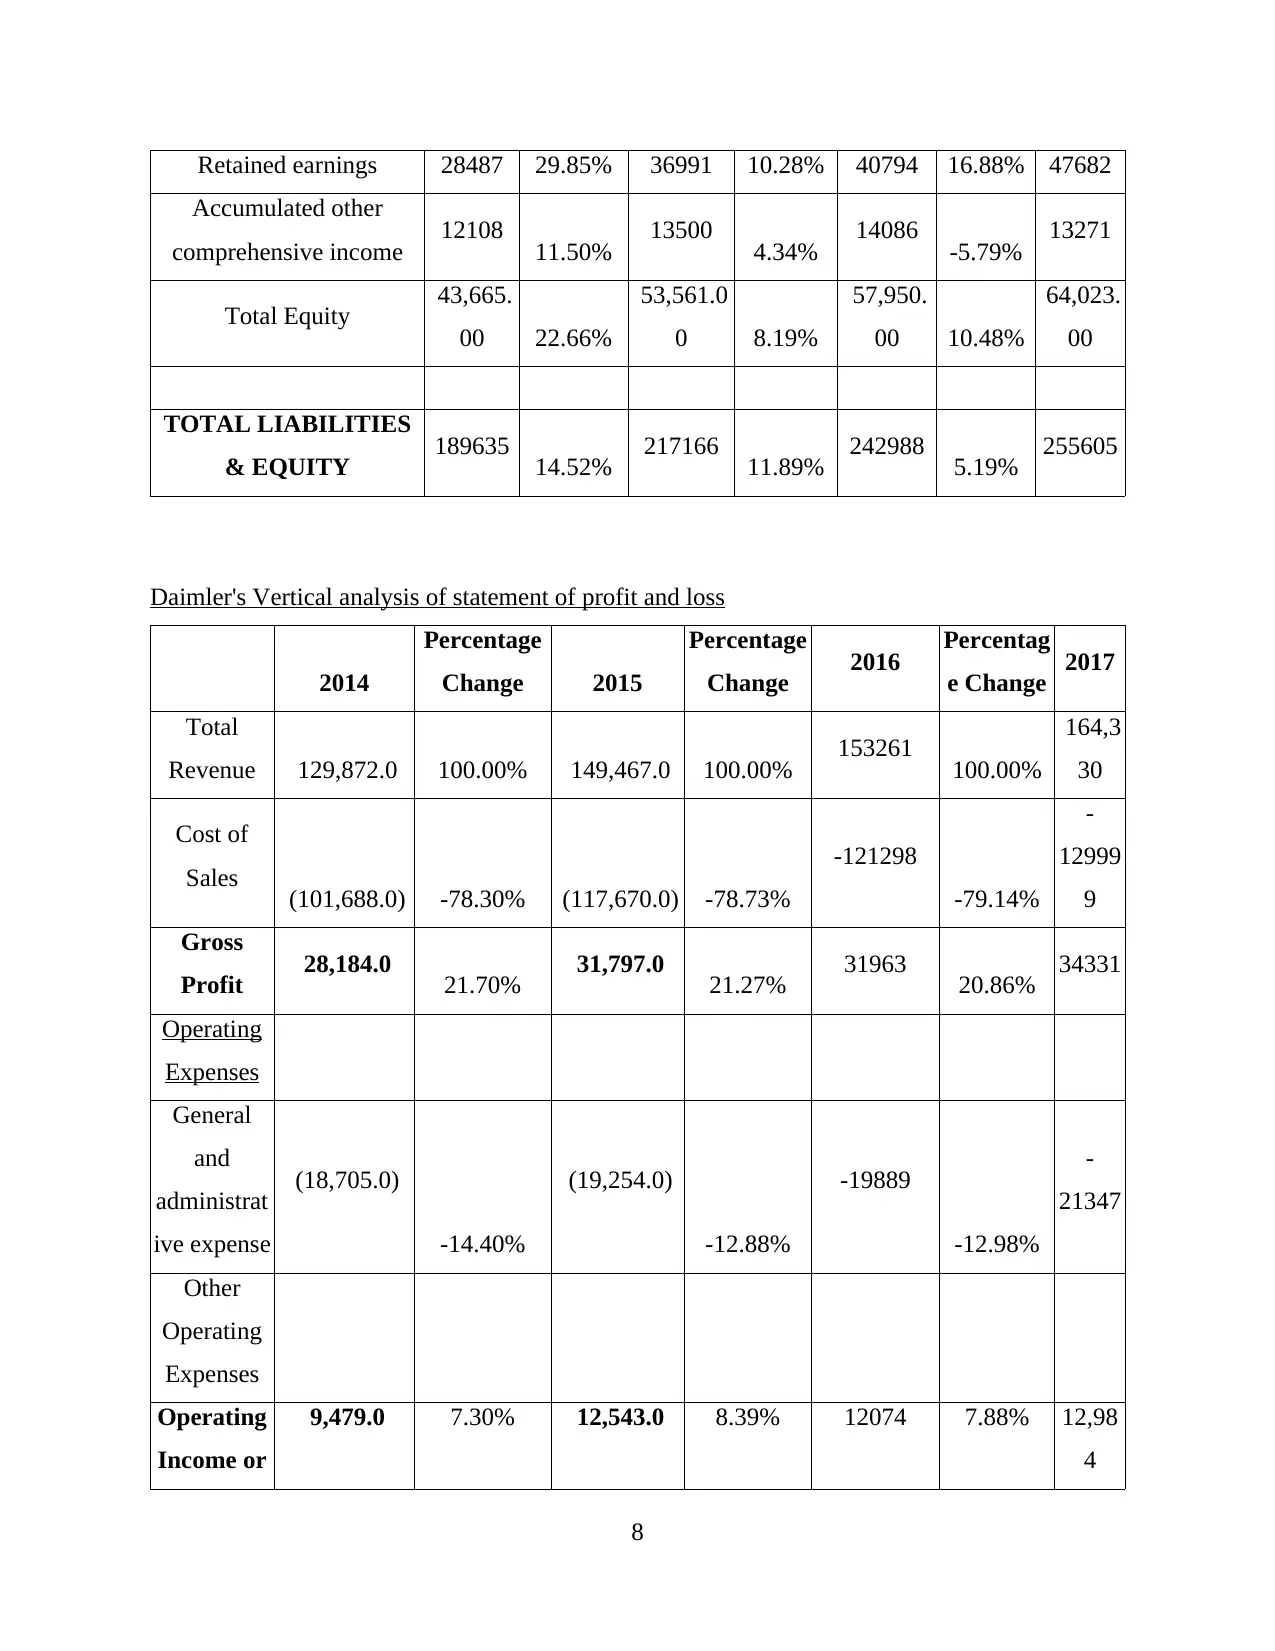
Retained earnings 28487 29.85% 36991 10.28% 40794 16.88% 47682
Accumulated other
comprehensive income 12108 11.50% 13500 4.34% 14086 -5.79% 13271
Total Equity 43,665.
00 22.66%
53,561.0
0 8.19%
57,950.
00 10.48%
64,023.
00
TOTAL LIABILITIES
& EQUITY 189635 14.52% 217166 11.89% 242988 5.19% 255605
Daimler's Vertical analysis of statement of profit and loss
2014
Percentage
Change 2015
Percentage
Change 2016 Percentag
e Change 2017
Total
Revenue 129,872.0 100.00% 149,467.0 100.00% 153261 100.00%
164,3
30
Cost of
Sales (101,688.0) -78.30% (117,670.0) -78.73%
-121298
-79.14%
-
12999
9
Gross
Profit 28,184.0 21.70% 31,797.0 21.27% 31963 20.86% 34331
Operating
Expenses
General
and
administrat
ive expense
(18,705.0)
-14.40%
(19,254.0)
-12.88%
-19889
-12.98%
-
21347
Other
Operating
Expenses
Operating
Income or
9,479.0 7.30% 12,543.0 8.39% 12074 7.88% 12,98
4
8
Paraphrase This Document
Need a fresh take? Get an instant paraphrase of this document with our AI Paraphraser
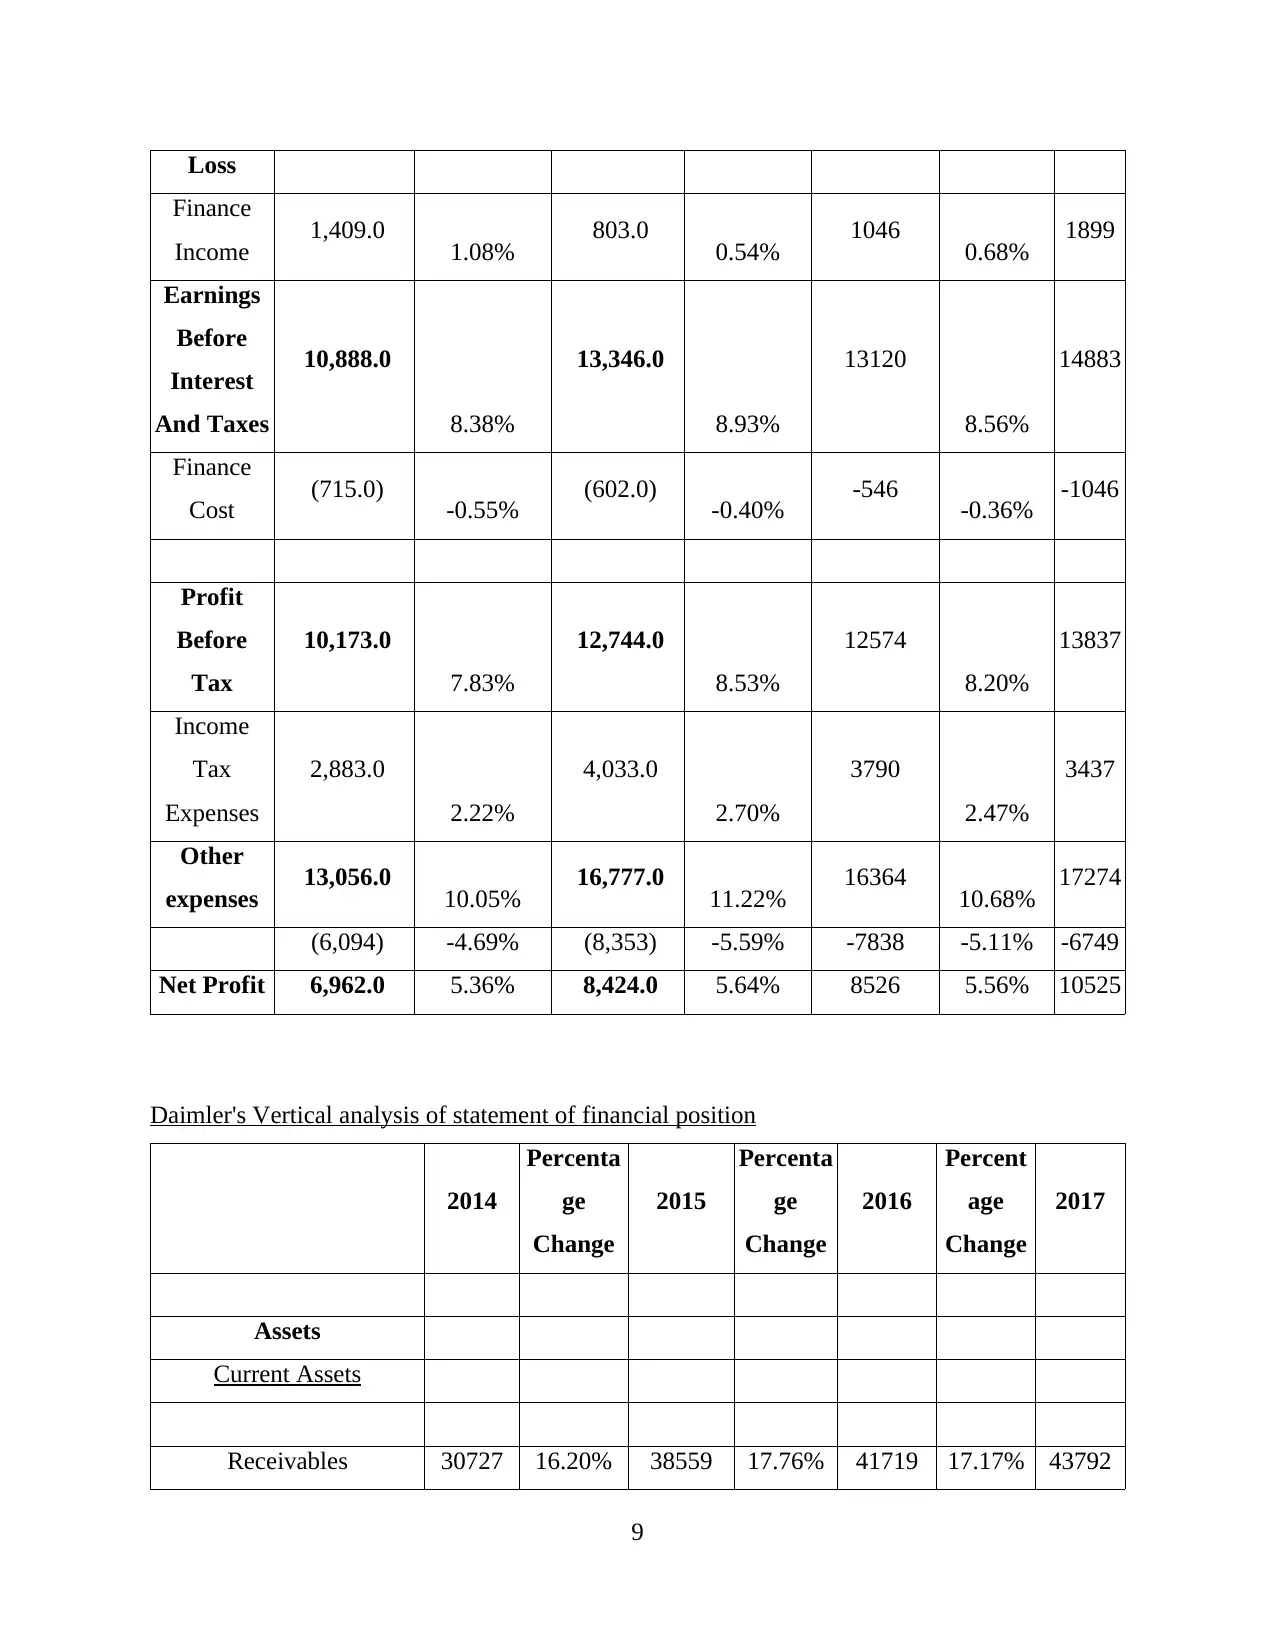
Loss
Finance
Income 1,409.0 1.08% 803.0 0.54% 1046 0.68% 1899
Earnings
Before
Interest
And Taxes
10,888.0
8.38%
13,346.0
8.93%
13120
8.56%
14883
Finance
Cost (715.0) -0.55% (602.0) -0.40% -546 -0.36% -1046
Profit
Before
Tax
10,173.0
7.83%
12,744.0
8.53%
12574
8.20%
13837
Income
Tax
Expenses
2,883.0
2.22%
4,033.0
2.70%
3790
2.47%
3437
Other
expenses 13,056.0 10.05% 16,777.0 11.22% 16364 10.68% 17274
(6,094) -4.69% (8,353) -5.59% -7838 -5.11% -6749
Net Profit 6,962.0 5.36% 8,424.0 5.64% 8526 5.56% 10525
Daimler's Vertical analysis of statement of financial position
2014
Percenta
ge
Change
2015
Percenta
ge
Change
2016
Percent
age
Change
2017
Assets
Current Assets
Receivables 30727 16.20% 38559 17.76% 41719 17.17% 43792
9
Finance
Income 1,409.0 1.08% 803.0 0.54% 1046 0.68% 1899
Earnings
Before
Interest
And Taxes
10,888.0
8.38%
13,346.0
8.93%
13120
8.56%
14883
Finance
Cost (715.0) -0.55% (602.0) -0.40% -546 -0.36% -1046
Profit
Before
Tax
10,173.0
7.83%
12,744.0
8.53%
12574
8.20%
13837
Income
Tax
Expenses
2,883.0
2.22%
4,033.0
2.70%
3790
2.47%
3437
Other
expenses 13,056.0 10.05% 16,777.0 11.22% 16364 10.68% 17274
(6,094) -4.69% (8,353) -5.59% -7838 -5.11% -6749
Net Profit 6,962.0 5.36% 8,424.0 5.64% 8526 5.56% 10525
Daimler's Vertical analysis of statement of financial position
2014
Percenta
ge
Change
2015
Percenta
ge
Change
2016
Percent
age
Change
2017
Assets
Current Assets
Receivables 30727 16.20% 38559 17.76% 41719 17.17% 43792
9
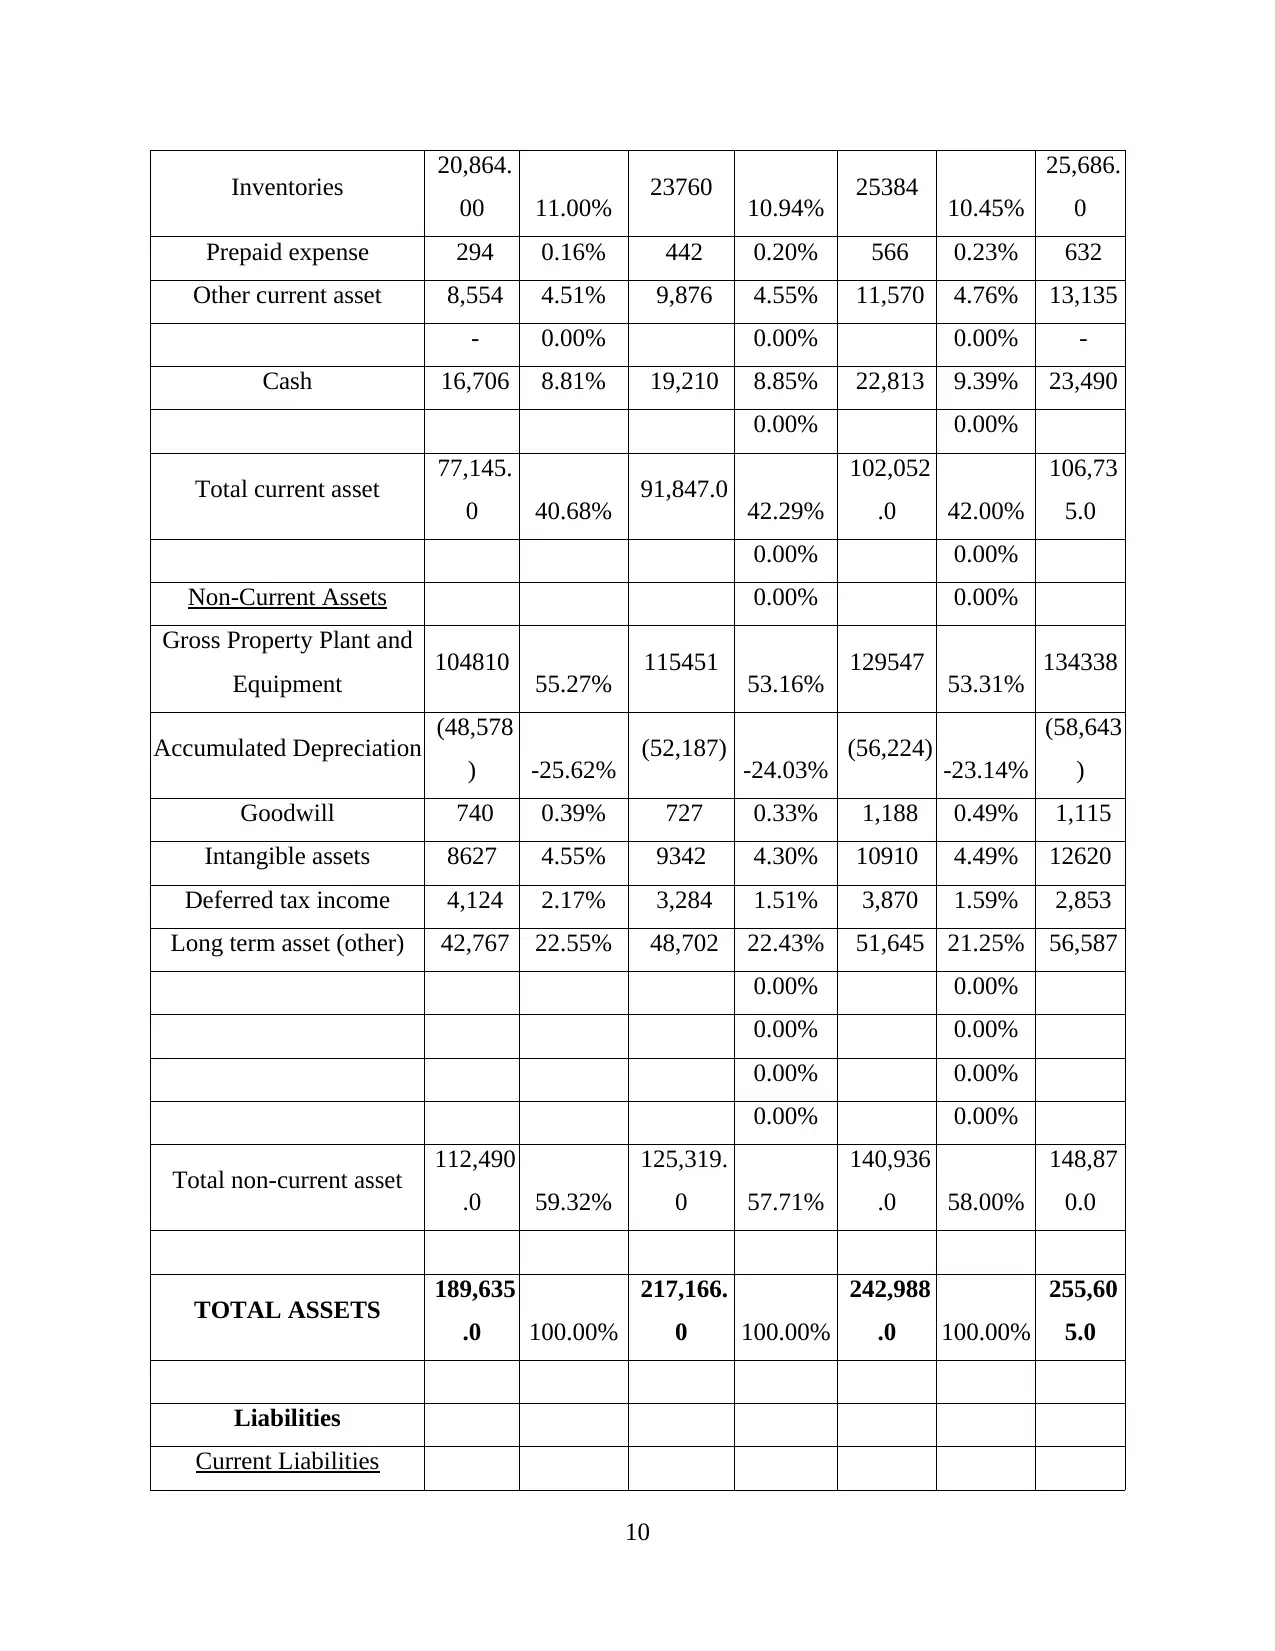
Inventories 20,864.
00 11.00% 23760 10.94% 25384 10.45%
25,686.
0
Prepaid expense 294 0.16% 442 0.20% 566 0.23% 632
Other current asset 8,554 4.51% 9,876 4.55% 11,570 4.76% 13,135
- 0.00% 0.00% 0.00% -
Cash 16,706 8.81% 19,210 8.85% 22,813 9.39% 23,490
0.00% 0.00%
Total current asset 77,145.
0 40.68% 91,847.0 42.29%
102,052
.0 42.00%
106,73
5.0
0.00% 0.00%
Non-Current Assets 0.00% 0.00%
Gross Property Plant and
Equipment 104810 55.27% 115451 53.16% 129547 53.31% 134338
Accumulated Depreciation (48,578
) -25.62% (52,187) -24.03% (56,224) -23.14%
(58,643
)
Goodwill 740 0.39% 727 0.33% 1,188 0.49% 1,115
Intangible assets 8627 4.55% 9342 4.30% 10910 4.49% 12620
Deferred tax income 4,124 2.17% 3,284 1.51% 3,870 1.59% 2,853
Long term asset (other) 42,767 22.55% 48,702 22.43% 51,645 21.25% 56,587
0.00% 0.00%
0.00% 0.00%
0.00% 0.00%
0.00% 0.00%
Total non-current asset 112,490
.0 59.32%
125,319.
0 57.71%
140,936
.0 58.00%
148,87
0.0
TOTAL ASSETS 189,635
.0 100.00%
217,166.
0 100.00%
242,988
.0 100.00%
255,60
5.0
Liabilities
Current Liabilities
10
⊘ This is a preview!⊘
Do you want full access?
Subscribe today to unlock all pages.
Trusted by 1+ million students worldwide
1 out of 27
Related Documents


Your All-in-One AI-Powered Toolkit for Academic Success.
+13062052269
info@desklib.com
Available 24*7 on WhatsApp / Email
![[object Object]](/_next/static/media/star-bottom.7253800d.svg)
Unlock your academic potential
Copyright © 2020–2026 A2Z Services. All Rights Reserved. Developed and managed by ZUCOL.