Accounting and Finance for Managers: Financial Performance
VerifiedAdded on 2023/04/05
|18
|3073
|363
Report
AI Summary
This report provides a detailed analysis of the financial health and performance of Tesco, Sainsbury, and Morrison's Plc, three major UK-based retail companies. The analysis is conducted using various financial ratios, including profitability, efficiency, and liquidity ratios, covering the period from 2010 to 2014. The report examines gross profit margin, operating profit margin, and net profit margin to assess profitability. It also evaluates management effectiveness using return on assets and return on equity. Efficiency ratios, such as inventory turnover, asset turnover, and receivable turnover, are analyzed to understand how effectively the companies manage their assets. Liquidity ratios, including current and quick ratios, are used to assess the companies' ability to meet short-term obligations. The report includes a memo to the managing director of Morrison's Plc regarding the company's financial performance and provides recommendations for improvement. Finally, it outlines the limitations of financial ratios and discusses the importance of considering non-financial factors in decision-making.
Accounting and Finance for Managers
Paraphrase This Document
Need a fresh take? Get an instant paraphrase of this document with our AI Paraphraser
Table of Contents
INTRODUCTION...........................................................................................................................3
SECTION A.....................................................................................................................................3
a. Analyzing financial health and performance of Tesco, Sainsbury and Morrison’s Plc...........3
b. Writing a memo to managing director regarding the performance of firm along with the
recommendations.......................................................................................................................10
c. Outlining the limitations of financial ratios...........................................................................11
SECTION B...................................................................................................................................12
a. Using net present value technique to assess whether three year contract is profitable or not
...................................................................................................................................................12
b. Explaining approach of taxation in appraisal........................................................................14
c. Discussing the techniques that can be used for the evaluation of project..............................14
d. Stating the other factors that need to consider while taking final decision...........................15
CONCLUSION..............................................................................................................................15
REFERENCES..............................................................................................................................17
INTRODUCTION
Accounting and finance management are vital for the organizational growth and success.
In the business organization, manager places high level emphasis on maintaining accounting
records and information which in turn helps preparing suitable statements. Hence, by making
analysis of financial statements through the means of ratio analysis both internal and external
stakeholders can take suitable decision. This report is based on three major retail or supermarket
stores such as Tesco, Sainsbury’s and Morrison Plc. All these retail stores are listed on the
recognized stock exchange of UK and known for delivering high quality products. The present
report will light on the extent to which financial condition of company is sound over others. It
will develop understanding regarding the investment appraisal techniques and its significance in
the decision making aspect.
SECTION A
a. Analyzing financial health and performance of Tesco, Sainsbury and Morrison’s Plc
Profitability analysis
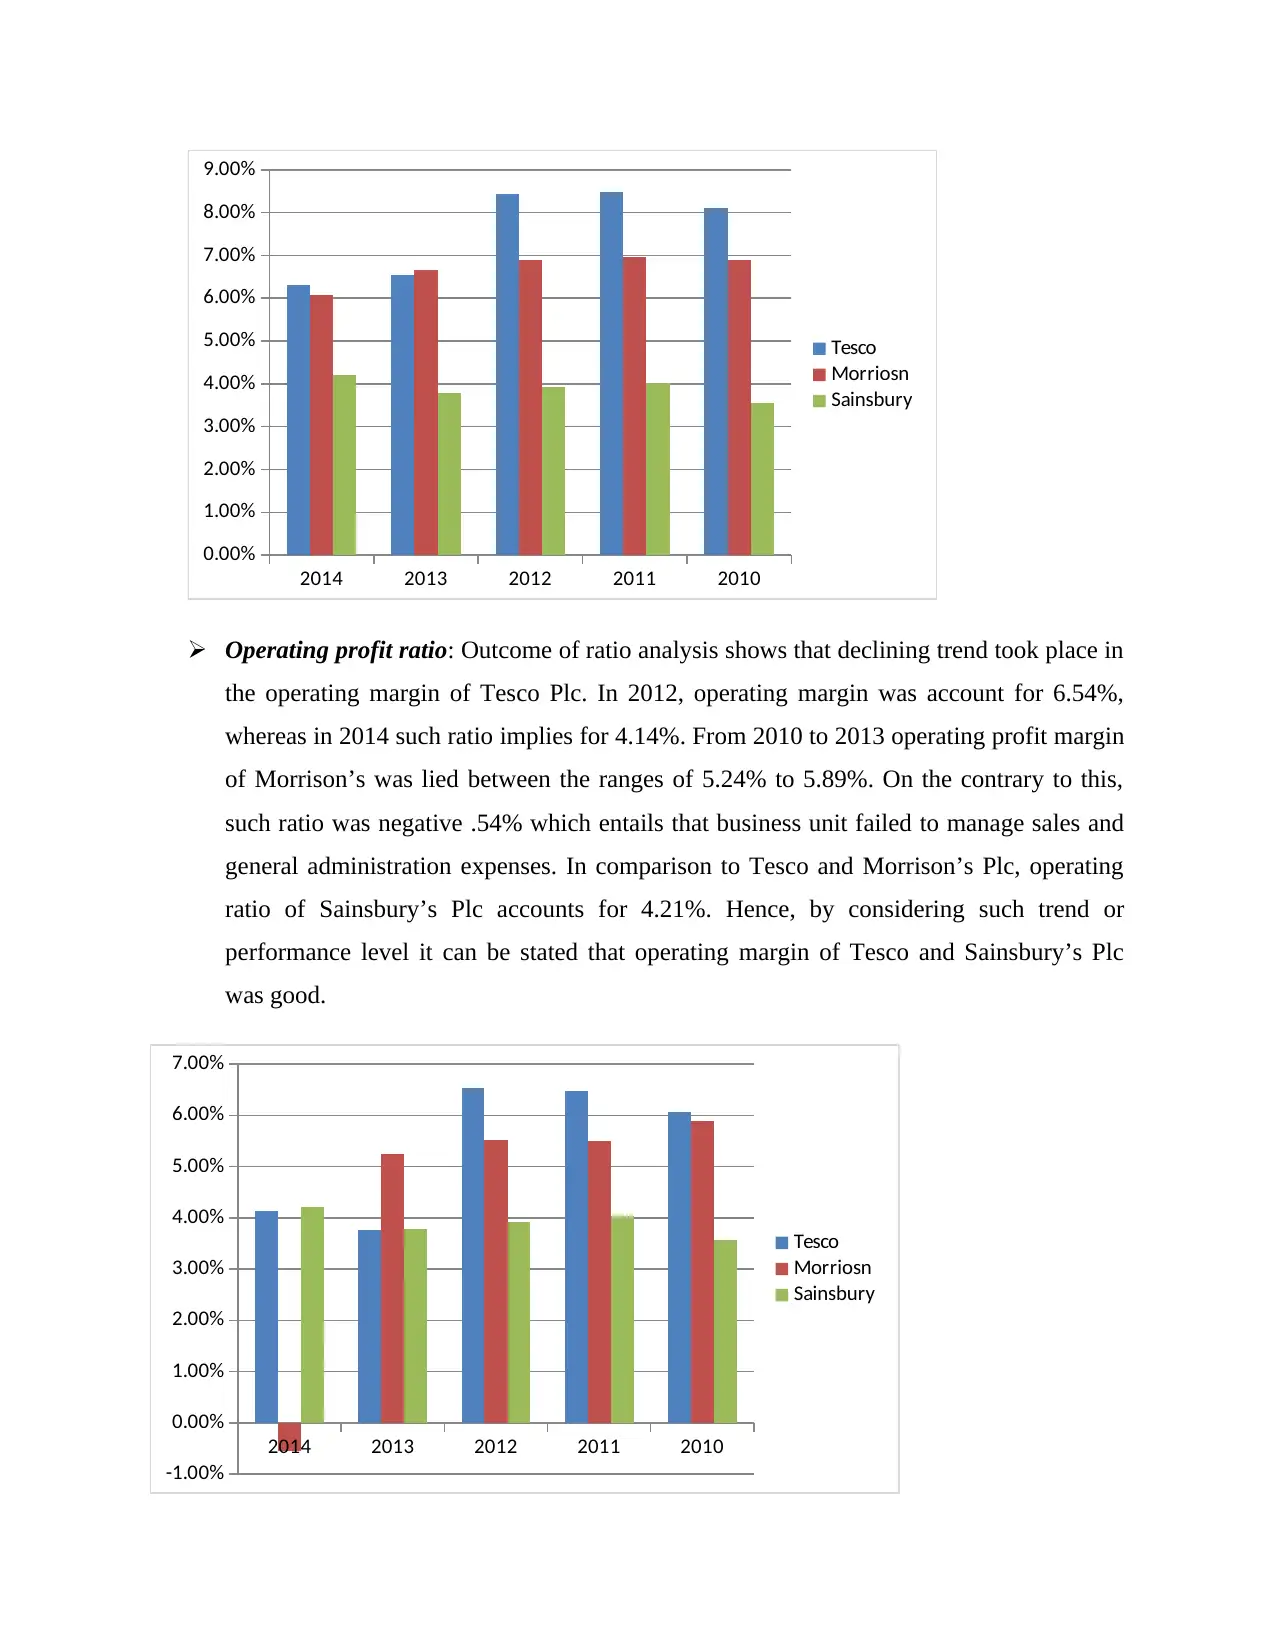
Gross margin ratio: It has been assessed from ratio analysis that GP margin of Tesco
decreased over the years and accounts for 6.31% respectively. Besides this, from 2010 to
2014 GP ratio Morrison fluctuated due to decline in sales revenue and high direct
expenses. In 2014, gross profit ratio of Morrison’s Plc was 6.07%. In comparison to this,
Sainsbury’s GP margin was 5.79% in 2014. Due to the existence of high competition
business units failed to generate more sales and profit. Hence, by considering such
aspects, it can be stated that GP margin of all such business units were not good.
Accounting and finance management are vital for the organizational growth and success.
In the business organization, manager places high level emphasis on maintaining accounting
records and information which in turn helps preparing suitable statements. Hence, by making
analysis of financial statements through the means of ratio analysis both internal and external
stakeholders can take suitable decision. This report is based on three major retail or supermarket
stores such as Tesco, Sainsbury’s and Morrison Plc. All these retail stores are listed on the
recognized stock exchange of UK and known for delivering high quality products. The present
report will light on the extent to which financial condition of company is sound over others. It
will develop understanding regarding the investment appraisal techniques and its significance in
the decision making aspect.
SECTION A
a. Analyzing financial health and performance of Tesco, Sainsbury and Morrison’s Plc
Profitability analysis
Gross margin ratio: It has been assessed from ratio analysis that GP margin of Tesco
decreased over the years and accounts for 6.31% respectively. Besides this, from 2010 to
2014 GP ratio Morrison fluctuated due to decline in sales revenue and high direct
expenses. In 2014, gross profit ratio of Morrison’s Plc was 6.07%. In comparison to this,
Sainsbury’s GP margin was 5.79% in 2014. Due to the existence of high competition
business units failed to generate more sales and profit. Hence, by considering such
aspects, it can be stated that GP margin of all such business units were not good.
⊘ This is a preview!⊘
Do you want full access?
Subscribe today to unlock all pages.
Trusted by 1+ million students worldwide
2014 2013 2012 2011 2010
0.00%
1.00%
2.00%
3.00%
4.00%
5.00%
6.00%
7.00%
8.00%
9.00%
Tesco
Morriosn
Sainsbury
Operating profit ratio: Outcome of ratio analysis shows that declining trend took place in
the operating margin of Tesco Plc. In 2012, operating margin was account for 6.54%,
whereas in 2014 such ratio implies for 4.14%. From 2010 to 2013 operating profit margin
of Morrison’s was lied between the ranges of 5.24% to 5.89%. On the contrary to this,
such ratio was negative .54% which entails that business unit failed to manage sales and
general administration expenses. In comparison to Tesco and Morrison’s Plc, operating
ratio of Sainsbury’s Plc accounts for 4.21%. Hence, by considering such trend or
performance level it can be stated that operating margin of Tesco and Sainsbury’s Plc
was good.
2014 2013 2012 2011 2010
-1.00%
0.00%
1.00%
2.00%
3.00%
4.00%
5.00%
6.00%
7.00%
Tesco
Morriosn
Sainsbury
0.00%
1.00%
2.00%
3.00%
4.00%
5.00%
6.00%
7.00%
8.00%
9.00%
Tesco
Morriosn
Sainsbury
Operating profit ratio: Outcome of ratio analysis shows that declining trend took place in
the operating margin of Tesco Plc. In 2012, operating margin was account for 6.54%,
whereas in 2014 such ratio implies for 4.14%. From 2010 to 2013 operating profit margin
of Morrison’s was lied between the ranges of 5.24% to 5.89%. On the contrary to this,
such ratio was negative .54% which entails that business unit failed to manage sales and
general administration expenses. In comparison to Tesco and Morrison’s Plc, operating
ratio of Sainsbury’s Plc accounts for 4.21%. Hence, by considering such trend or
performance level it can be stated that operating margin of Tesco and Sainsbury’s Plc
was good.
2014 2013 2012 2011 2010
-1.00%
0.00%
1.00%
2.00%
3.00%
4.00%
5.00%
6.00%
7.00%
Tesco
Morriosn
Sainsbury
Paraphrase This Document
Need a fresh take? Get an instant paraphrase of this document with our AI Paraphraser
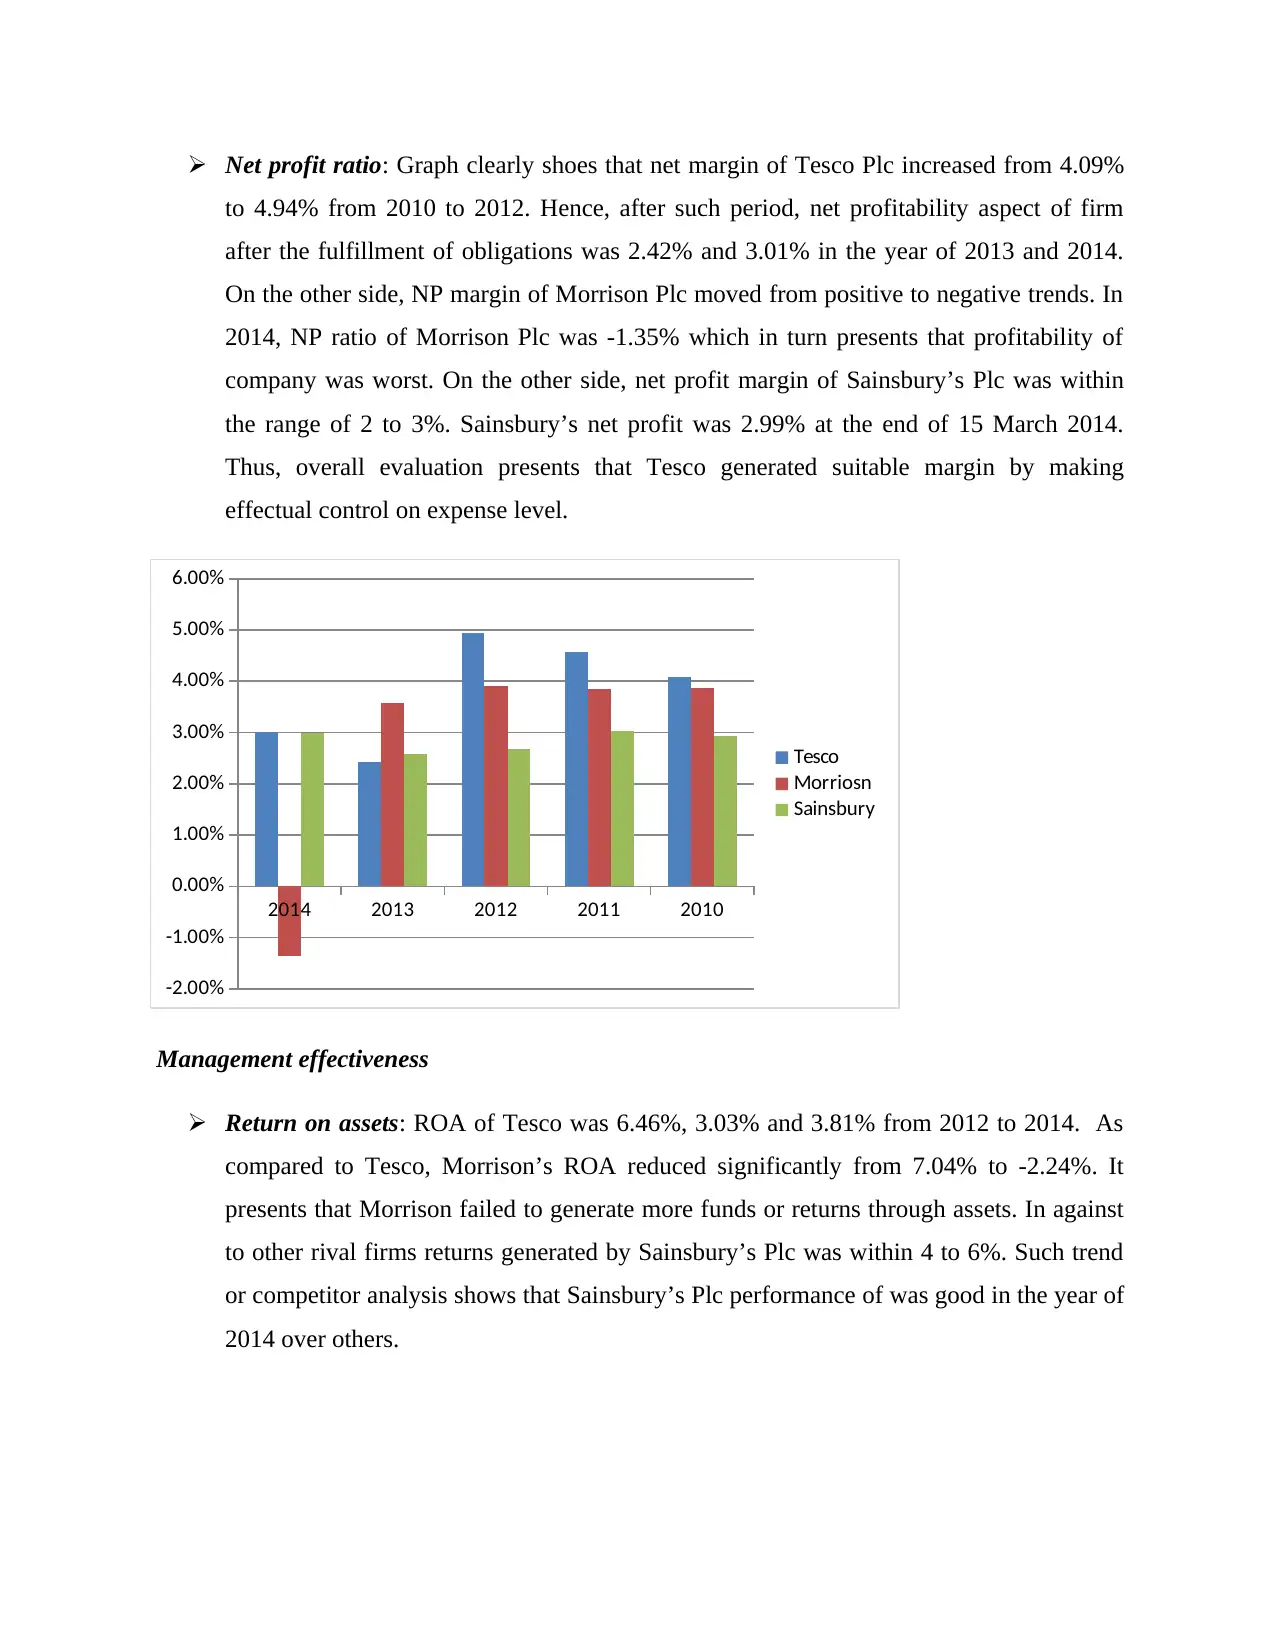
Net profit ratio: Graph clearly shoes that net margin of Tesco Plc increased from 4.09%
to 4.94% from 2010 to 2012. Hence, after such period, net profitability aspect of firm
after the fulfillment of obligations was 2.42% and 3.01% in the year of 2013 and 2014.
On the other side, NP margin of Morrison Plc moved from positive to negative trends. In
2014, NP ratio of Morrison Plc was -1.35% which in turn presents that profitability of
company was worst. On the other side, net profit margin of Sainsbury’s Plc was within
the range of 2 to 3%. Sainsbury’s net profit was 2.99% at the end of 15 March 2014.
Thus, overall evaluation presents that Tesco generated suitable margin by making
effectual control on expense level.
2014 2013 2012 2011 2010
-2.00%
-1.00%
0.00%
1.00%
2.00%
3.00%
4.00%
5.00%
6.00%
Tesco
Morriosn
Sainsbury
Management effectiveness
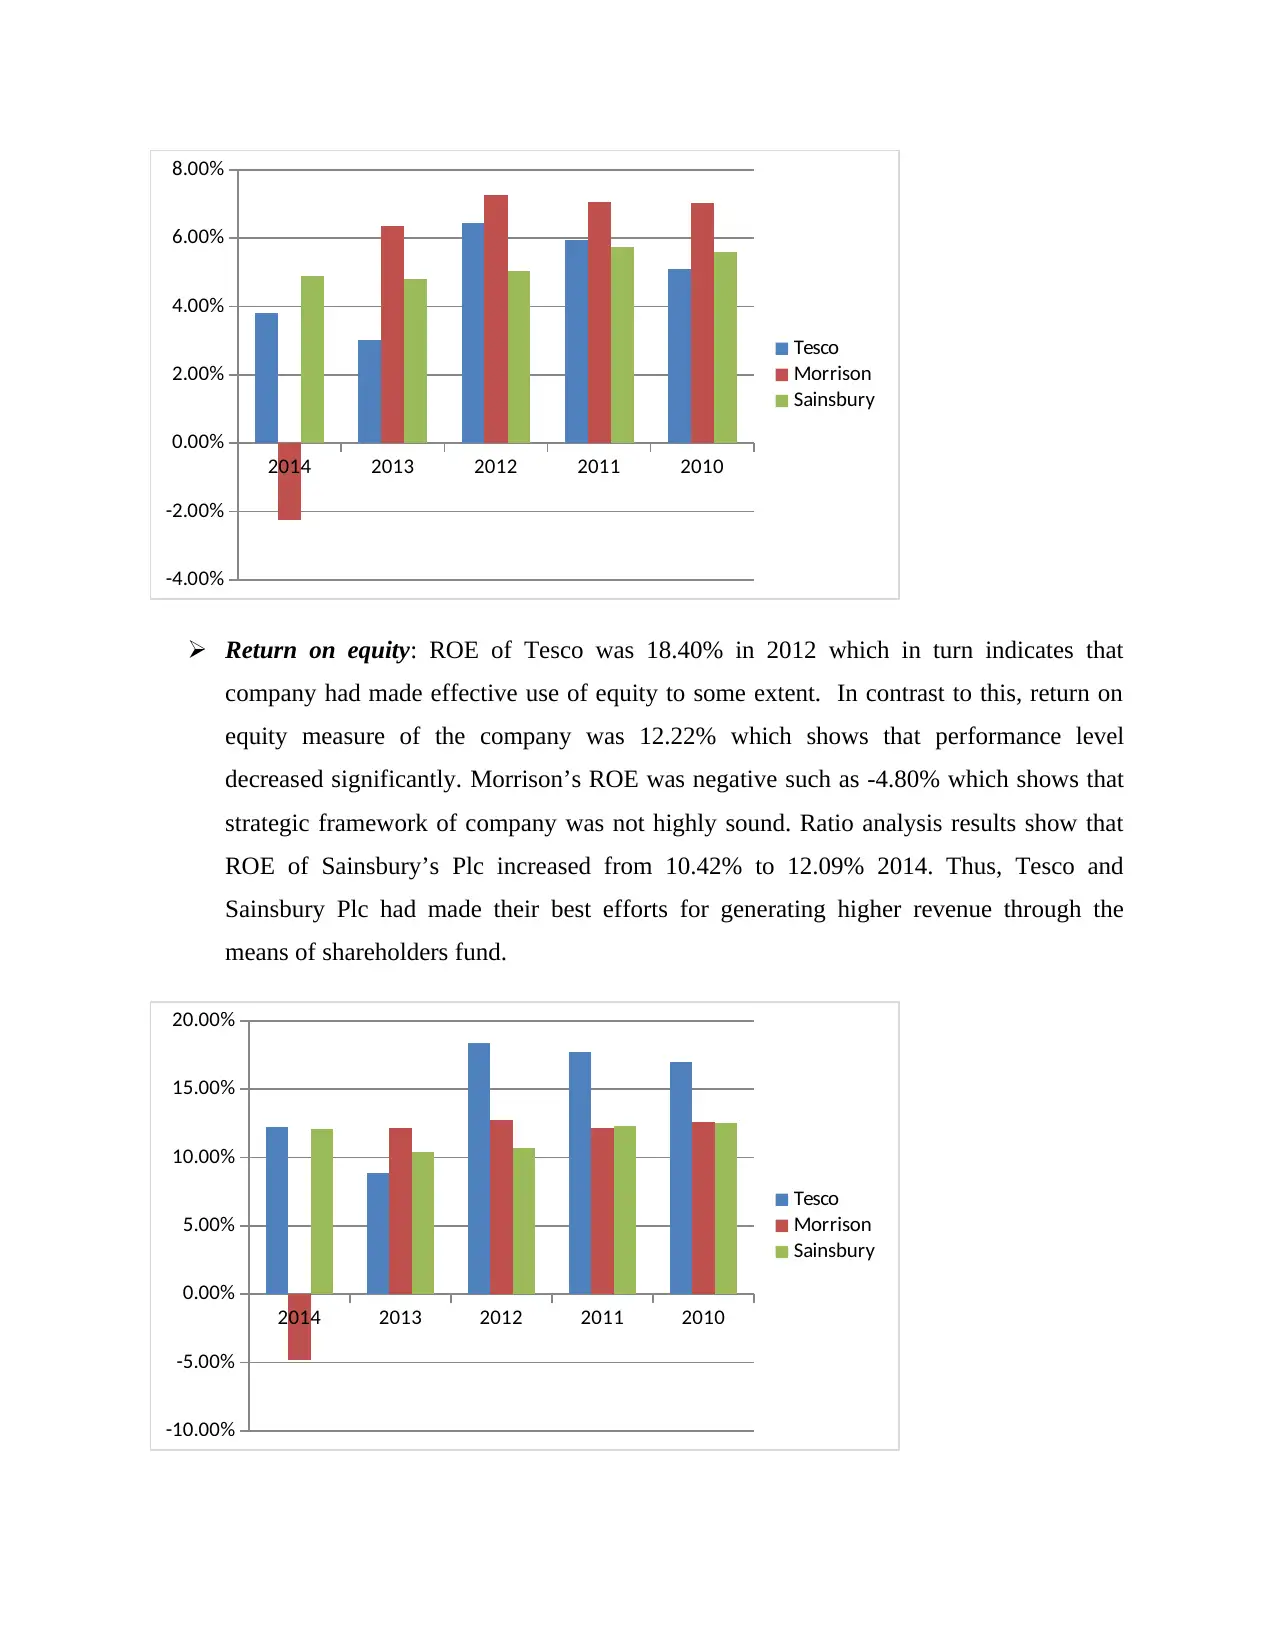
Return on assets: ROA of Tesco was 6.46%, 3.03% and 3.81% from 2012 to 2014. As
compared to Tesco, Morrison’s ROA reduced significantly from 7.04% to -2.24%. It
presents that Morrison failed to generate more funds or returns through assets. In against
to other rival firms returns generated by Sainsbury’s Plc was within 4 to 6%. Such trend
or competitor analysis shows that Sainsbury’s Plc performance of was good in the year of
2014 over others.
to 4.94% from 2010 to 2012. Hence, after such period, net profitability aspect of firm
after the fulfillment of obligations was 2.42% and 3.01% in the year of 2013 and 2014.
On the other side, NP margin of Morrison Plc moved from positive to negative trends. In
2014, NP ratio of Morrison Plc was -1.35% which in turn presents that profitability of
company was worst. On the other side, net profit margin of Sainsbury’s Plc was within
the range of 2 to 3%. Sainsbury’s net profit was 2.99% at the end of 15 March 2014.
Thus, overall evaluation presents that Tesco generated suitable margin by making
effectual control on expense level.
2014 2013 2012 2011 2010
-2.00%
-1.00%
0.00%
1.00%
2.00%
3.00%
4.00%
5.00%
6.00%
Tesco
Morriosn
Sainsbury
Management effectiveness
Return on assets: ROA of Tesco was 6.46%, 3.03% and 3.81% from 2012 to 2014. As
compared to Tesco, Morrison’s ROA reduced significantly from 7.04% to -2.24%. It
presents that Morrison failed to generate more funds or returns through assets. In against
to other rival firms returns generated by Sainsbury’s Plc was within 4 to 6%. Such trend
or competitor analysis shows that Sainsbury’s Plc performance of was good in the year of
2014 over others.
2014 2013 2012 2011 2010
-4.00%
-2.00%
0.00%
2.00%
4.00%
6.00%
8.00%
Tesco
Morrison
Sainsbury
Return on equity: ROE of Tesco was 18.40% in 2012 which in turn indicates that
company had made effective use of equity to some extent. In contrast to this, return on
equity measure of the company was 12.22% which shows that performance level
decreased significantly. Morrison’s ROE was negative such as -4.80% which shows that
strategic framework of company was not highly sound. Ratio analysis results show that
ROE of Sainsbury’s Plc increased from 10.42% to 12.09% 2014. Thus, Tesco and
Sainsbury Plc had made their best efforts for generating higher revenue through the
means of shareholders fund.
2014 2013 2012 2011 2010
-10.00%
-5.00%
0.00%
5.00%
10.00%
15.00%
20.00%
Tesco
Morrison
Sainsbury
⊘ This is a preview!⊘
Do you want full access?
Subscribe today to unlock all pages.
Trusted by 1+ million students worldwide
Efficiency ratio analysis
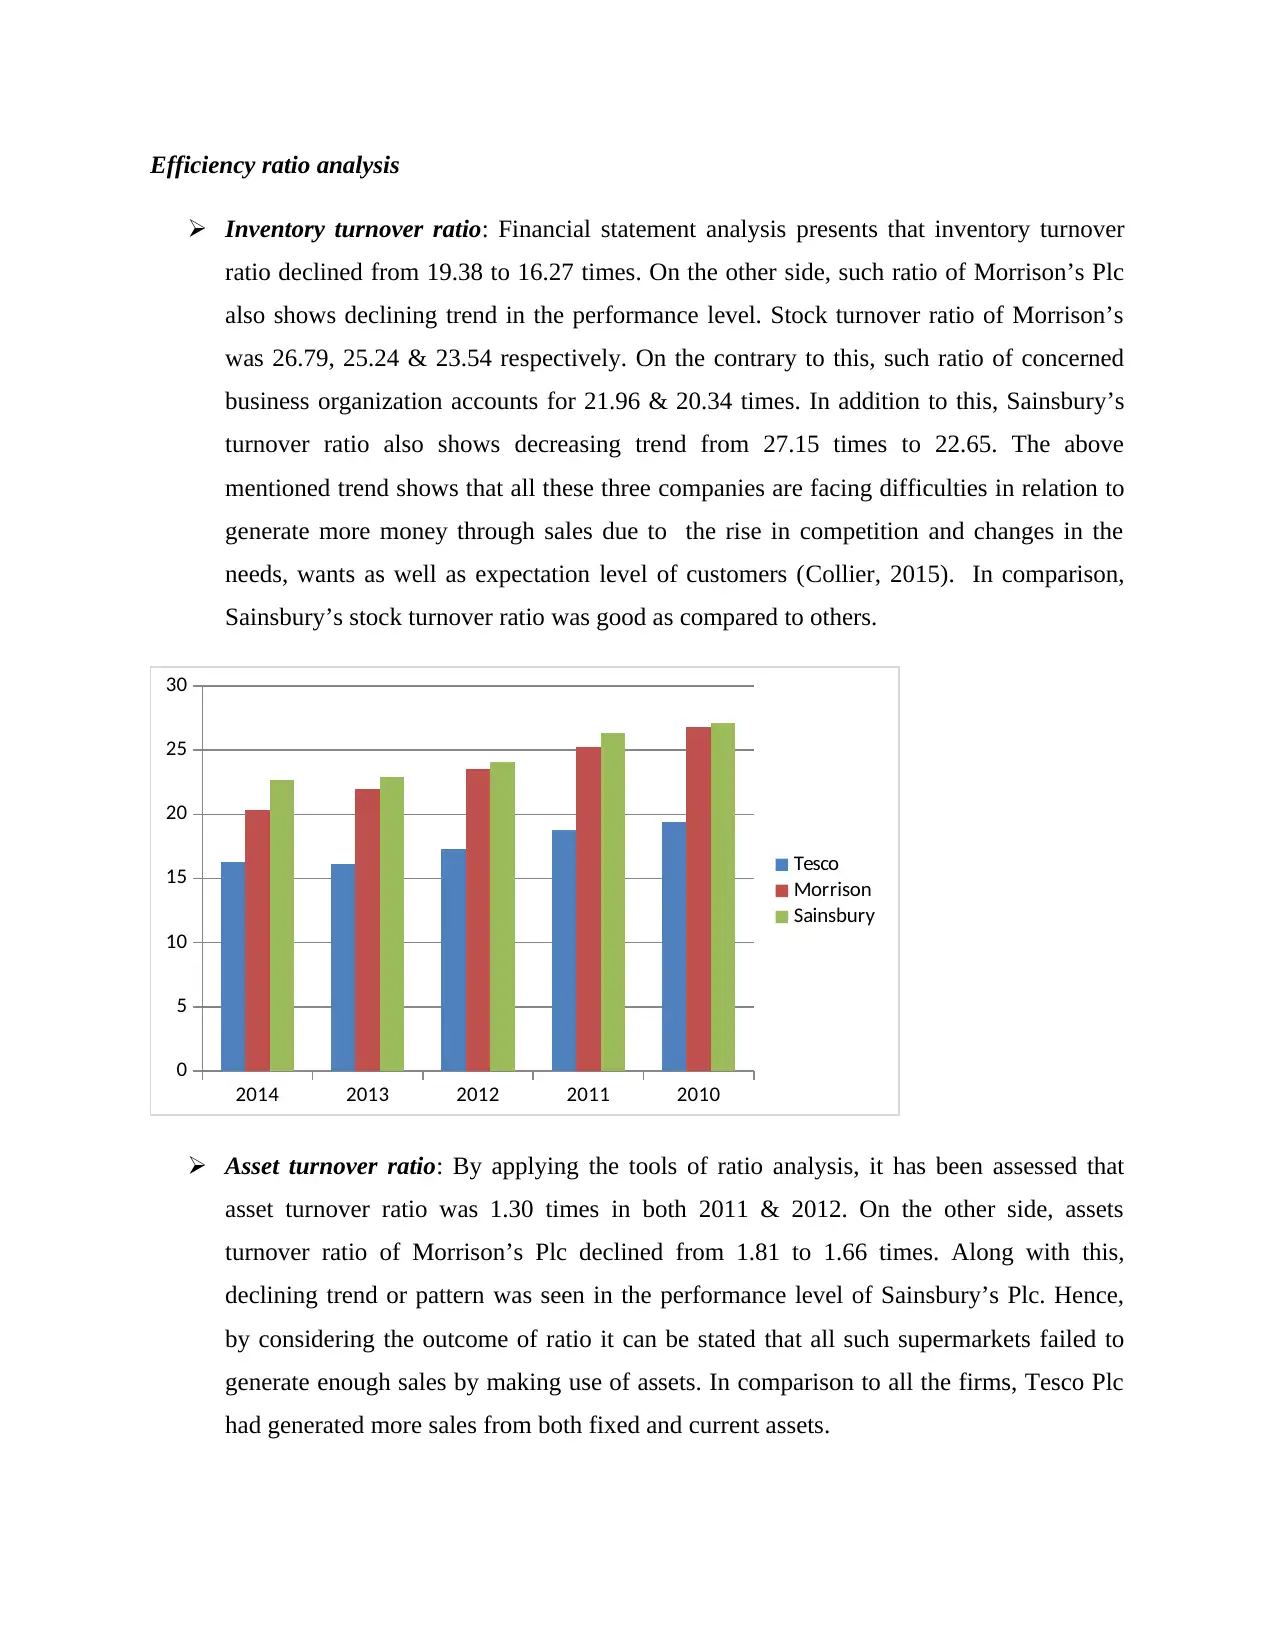
Inventory turnover ratio: Financial statement analysis presents that inventory turnover
ratio declined from 19.38 to 16.27 times. On the other side, such ratio of Morrison’s Plc
also shows declining trend in the performance level. Stock turnover ratio of Morrison’s
was 26.79, 25.24 & 23.54 respectively. On the contrary to this, such ratio of concerned
business organization accounts for 21.96 & 20.34 times. In addition to this, Sainsbury’s
turnover ratio also shows decreasing trend from 27.15 times to 22.65. The above
mentioned trend shows that all these three companies are facing difficulties in relation to
generate more money through sales due to the rise in competition and changes in the
needs, wants as well as expectation level of customers (Collier, 2015). In comparison,
Sainsbury’s stock turnover ratio was good as compared to others.
2014 2013 2012 2011 2010
0
5
10
15
20
25
30
Tesco
Morrison
Sainsbury
Asset turnover ratio: By applying the tools of ratio analysis, it has been assessed that
asset turnover ratio was 1.30 times in both 2011 & 2012. On the other side, assets
turnover ratio of Morrison’s Plc declined from 1.81 to 1.66 times. Along with this,
declining trend or pattern was seen in the performance level of Sainsbury’s Plc. Hence,
by considering the outcome of ratio it can be stated that all such supermarkets failed to
generate enough sales by making use of assets. In comparison to all the firms, Tesco Plc
had generated more sales from both fixed and current assets.
Paraphrase This Document
Need a fresh take? Get an instant paraphrase of this document with our AI Paraphraser
2014 2013 2012 2011 2010
0
0.5
1
1.5
2
2.5
Tesco
Morrison
Sainsbury
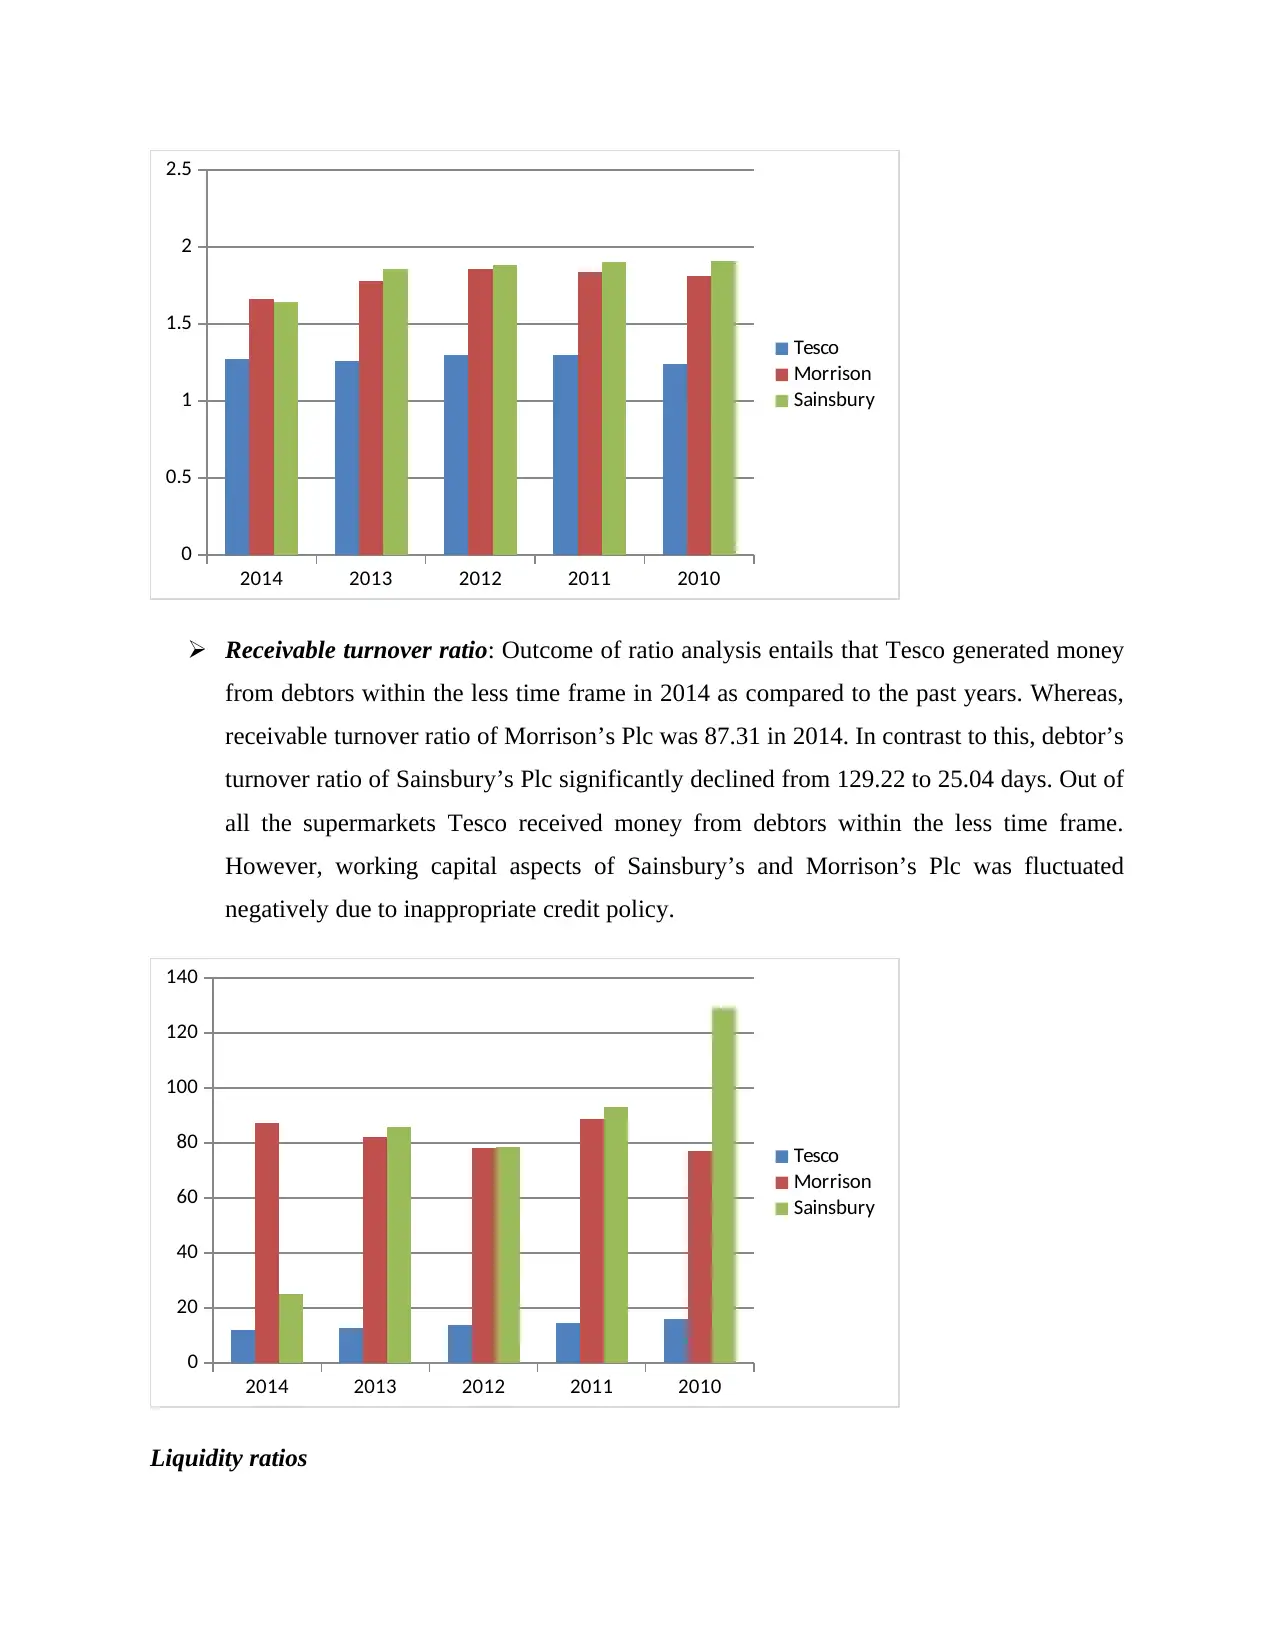
Receivable turnover ratio: Outcome of ratio analysis entails that Tesco generated money
from debtors within the less time frame in 2014 as compared to the past years. Whereas,
receivable turnover ratio of Morrison’s Plc was 87.31 in 2014. In contrast to this, debtor’s
turnover ratio of Sainsbury’s Plc significantly declined from 129.22 to 25.04 days. Out of
all the supermarkets Tesco received money from debtors within the less time frame.
However, working capital aspects of Sainsbury’s and Morrison’s Plc was fluctuated
negatively due to inappropriate credit policy.
2014 2013 2012 2011 2010
0
20
40
60
80
100
120
140
Tesco
Morrison
Sainsbury
Liquidity ratios
0
0.5
1
1.5
2
2.5
Tesco
Morrison
Sainsbury
Receivable turnover ratio: Outcome of ratio analysis entails that Tesco generated money
from debtors within the less time frame in 2014 as compared to the past years. Whereas,
receivable turnover ratio of Morrison’s Plc was 87.31 in 2014. In contrast to this, debtor’s
turnover ratio of Sainsbury’s Plc significantly declined from 129.22 to 25.04 days. Out of
all the supermarkets Tesco received money from debtors within the less time frame.
However, working capital aspects of Sainsbury’s and Morrison’s Plc was fluctuated
negatively due to inappropriate credit policy.
2014 2013 2012 2011 2010
0
20
40
60
80
100
120
140
Tesco
Morrison
Sainsbury
Liquidity ratios
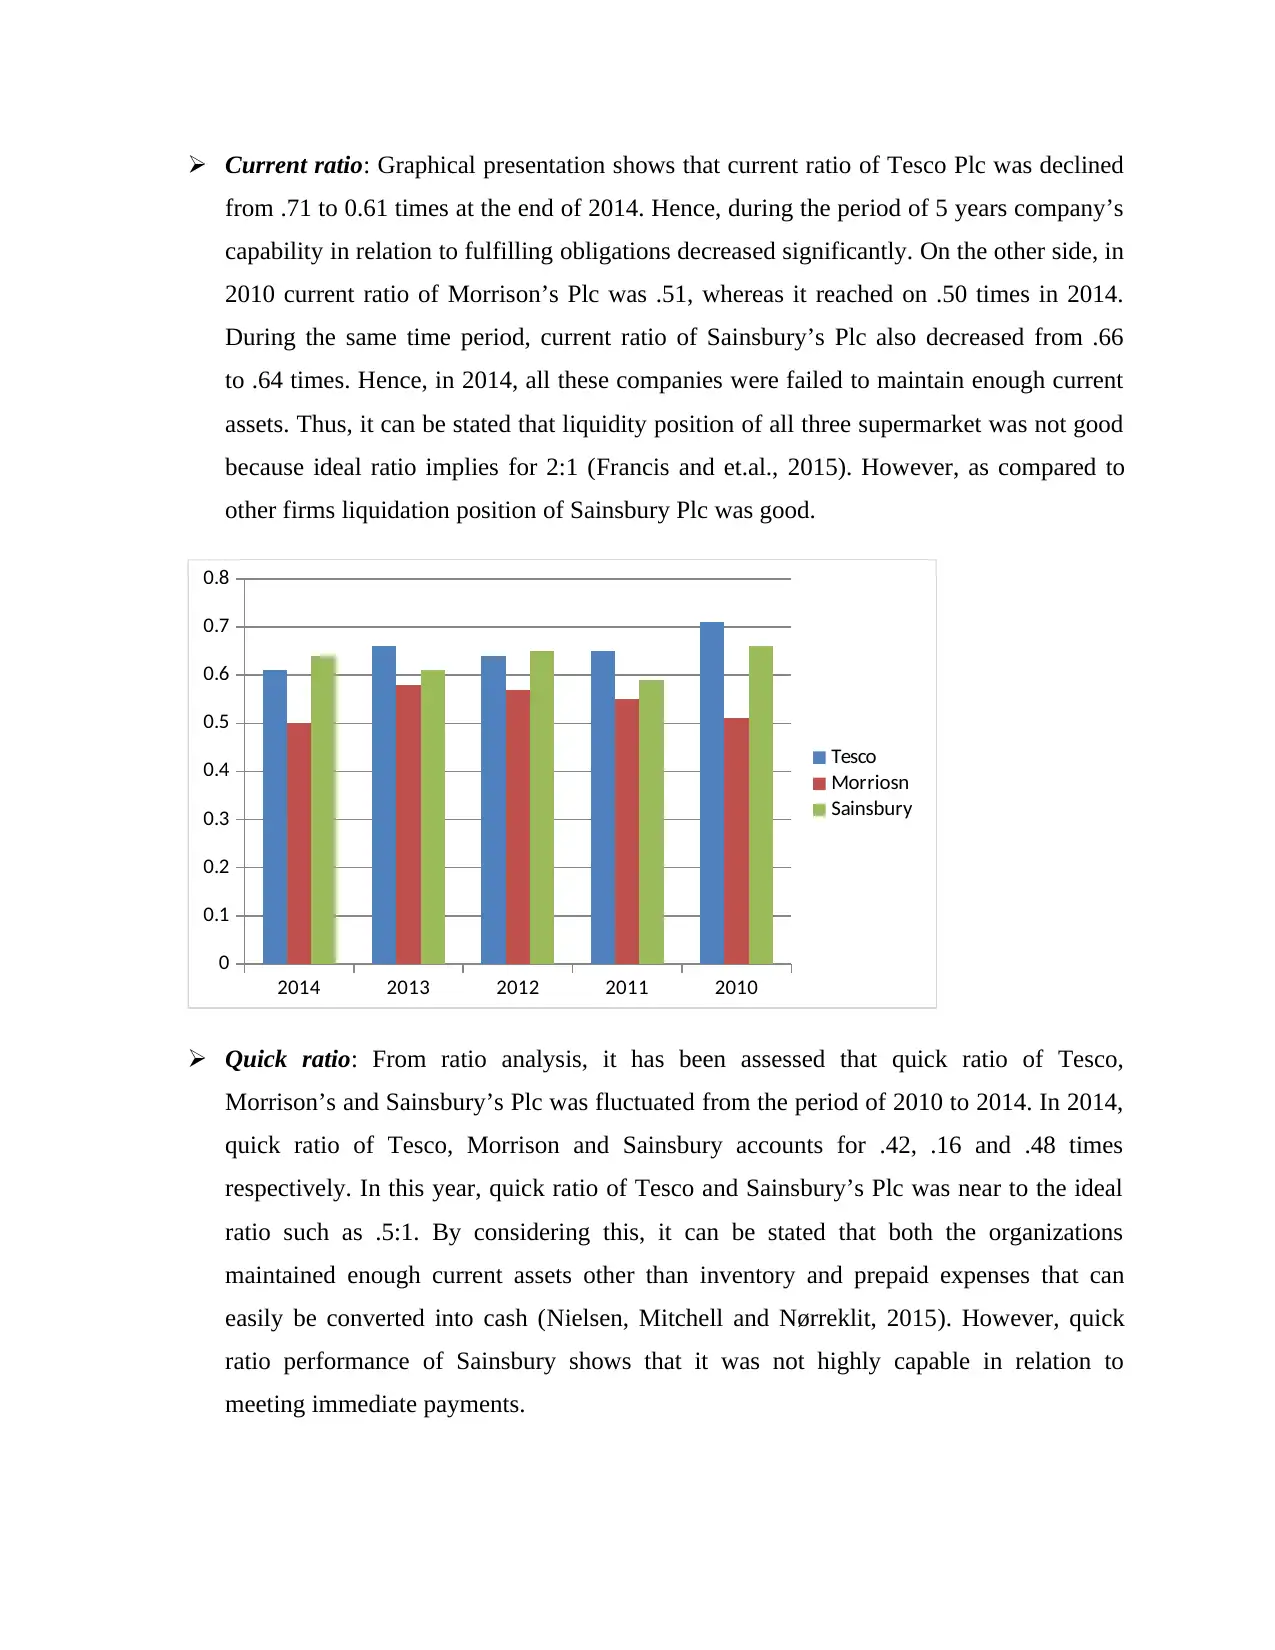
Current ratio: Graphical presentation shows that current ratio of Tesco Plc was declined
from .71 to 0.61 times at the end of 2014. Hence, during the period of 5 years company’s
capability in relation to fulfilling obligations decreased significantly. On the other side, in
2010 current ratio of Morrison’s Plc was .51, whereas it reached on .50 times in 2014.
During the same time period, current ratio of Sainsbury’s Plc also decreased from .66
to .64 times. Hence, in 2014, all these companies were failed to maintain enough current
assets. Thus, it can be stated that liquidity position of all three supermarket was not good
because ideal ratio implies for 2:1 (Francis and et.al., 2015). However, as compared to
other firms liquidation position of Sainsbury Plc was good.
2014 2013 2012 2011 2010
0
0.1
0.2
0.3
0.4
0.5
0.6
0.7
0.8
Tesco
Morriosn
Sainsbury
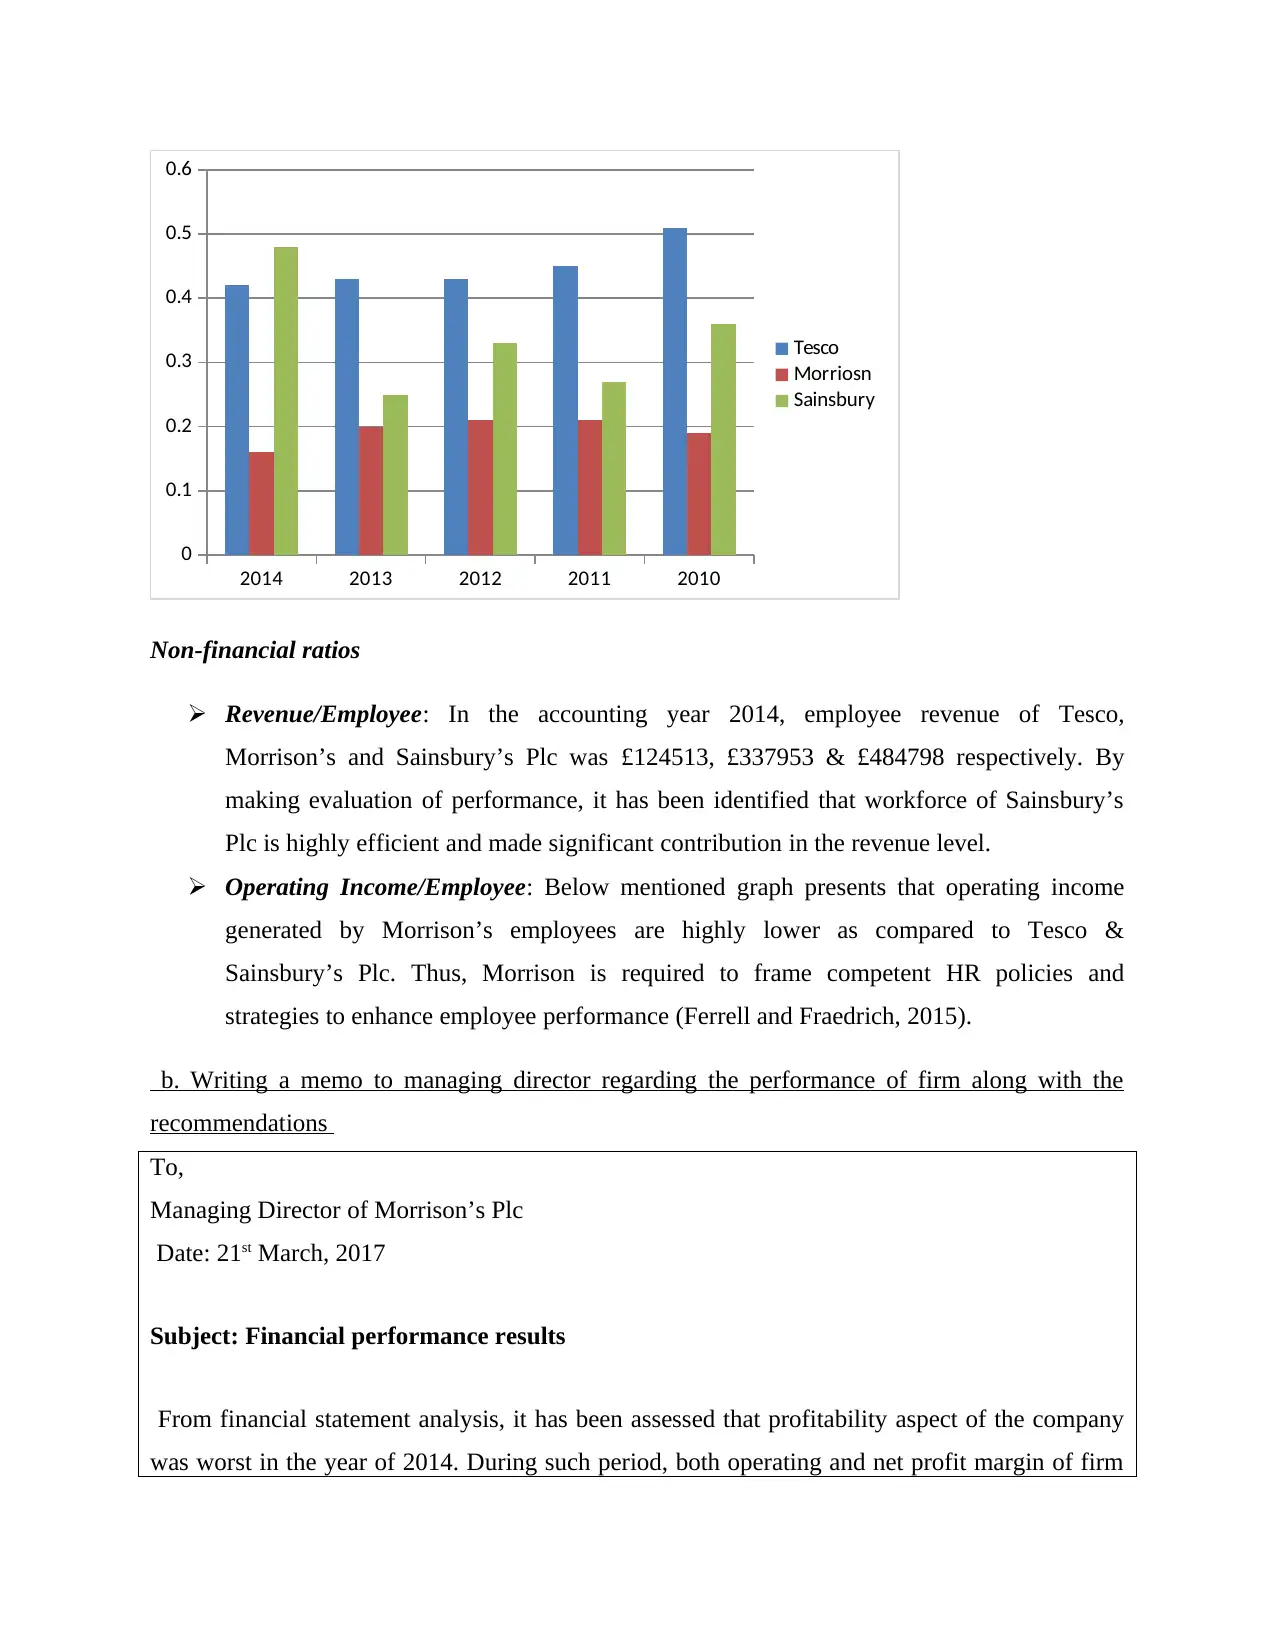
Quick ratio: From ratio analysis, it has been assessed that quick ratio of Tesco,
Morrison’s and Sainsbury’s Plc was fluctuated from the period of 2010 to 2014. In 2014,
quick ratio of Tesco, Morrison and Sainsbury accounts for .42, .16 and .48 times
respectively. In this year, quick ratio of Tesco and Sainsbury’s Plc was near to the ideal
ratio such as .5:1. By considering this, it can be stated that both the organizations
maintained enough current assets other than inventory and prepaid expenses that can
easily be converted into cash (Nielsen, Mitchell and Nørreklit, 2015). However, quick
ratio performance of Sainsbury shows that it was not highly capable in relation to
meeting immediate payments.
from .71 to 0.61 times at the end of 2014. Hence, during the period of 5 years company’s
capability in relation to fulfilling obligations decreased significantly. On the other side, in
2010 current ratio of Morrison’s Plc was .51, whereas it reached on .50 times in 2014.
During the same time period, current ratio of Sainsbury’s Plc also decreased from .66
to .64 times. Hence, in 2014, all these companies were failed to maintain enough current
assets. Thus, it can be stated that liquidity position of all three supermarket was not good
because ideal ratio implies for 2:1 (Francis and et.al., 2015). However, as compared to
other firms liquidation position of Sainsbury Plc was good.
2014 2013 2012 2011 2010
0
0.1
0.2
0.3
0.4
0.5
0.6
0.7
0.8
Tesco
Morriosn
Sainsbury
Quick ratio: From ratio analysis, it has been assessed that quick ratio of Tesco,
Morrison’s and Sainsbury’s Plc was fluctuated from the period of 2010 to 2014. In 2014,
quick ratio of Tesco, Morrison and Sainsbury accounts for .42, .16 and .48 times
respectively. In this year, quick ratio of Tesco and Sainsbury’s Plc was near to the ideal
ratio such as .5:1. By considering this, it can be stated that both the organizations
maintained enough current assets other than inventory and prepaid expenses that can
easily be converted into cash (Nielsen, Mitchell and Nørreklit, 2015). However, quick
ratio performance of Sainsbury shows that it was not highly capable in relation to
meeting immediate payments.
⊘ This is a preview!⊘
Do you want full access?
Subscribe today to unlock all pages.
Trusted by 1+ million students worldwide
2014 2013 2012 2011 2010
0
0.1
0.2
0.3
0.4
0.5
0.6
Tesco
Morriosn
Sainsbury
Non-financial ratios
Revenue/Employee: In the accounting year 2014, employee revenue of Tesco,
Morrison’s and Sainsbury’s Plc was £124513, £337953 & £484798 respectively. By
making evaluation of performance, it has been identified that workforce of Sainsbury’s
Plc is highly efficient and made significant contribution in the revenue level.
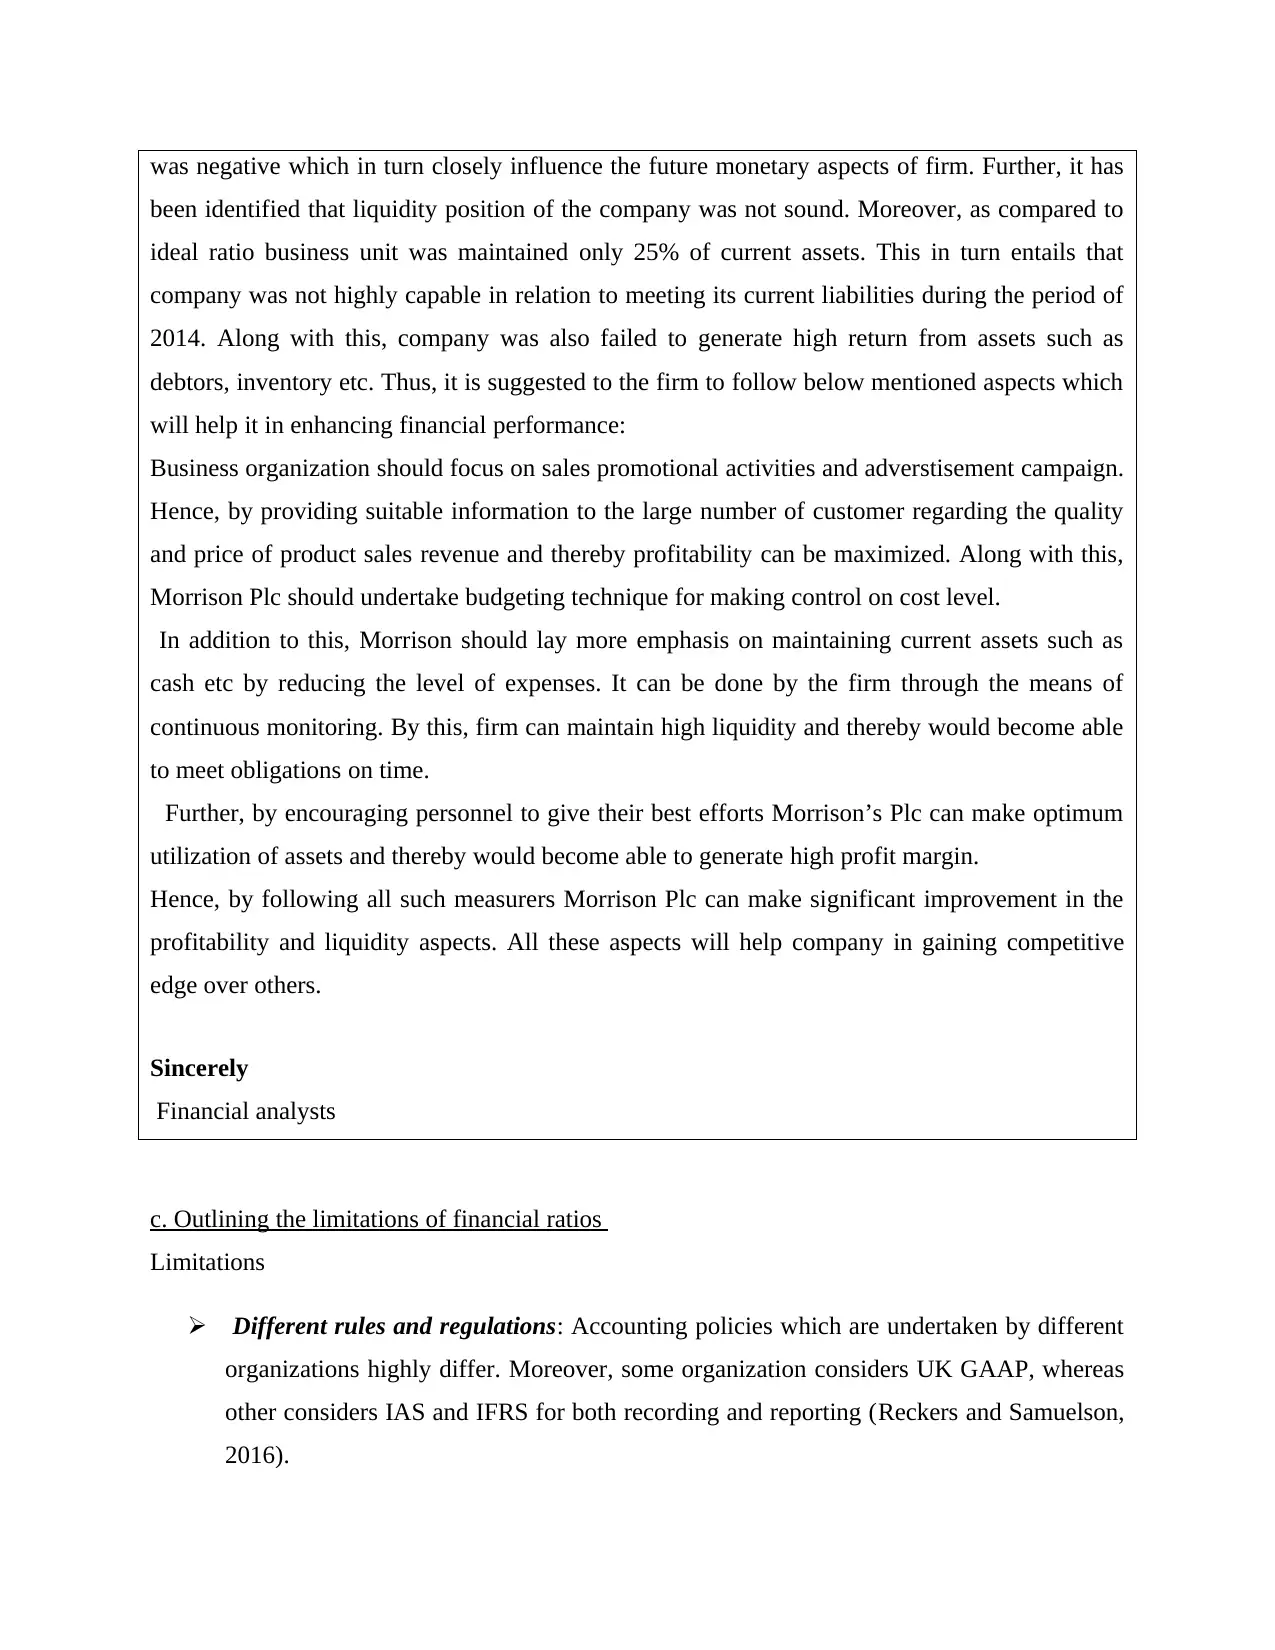
Operating Income/Employee: Below mentioned graph presents that operating income
generated by Morrison’s employees are highly lower as compared to Tesco &
Sainsbury’s Plc. Thus, Morrison is required to frame competent HR policies and
strategies to enhance employee performance (Ferrell and Fraedrich, 2015).
b. Writing a memo to managing director regarding the performance of firm along with the
recommendations
To,
Managing Director of Morrison’s Plc
Date: 21st March, 2017
Subject: Financial performance results
From financial statement analysis, it has been assessed that profitability aspect of the company
was worst in the year of 2014. During such period, both operating and net profit margin of firm
0
0.1
0.2
0.3
0.4
0.5
0.6
Tesco
Morriosn
Sainsbury
Non-financial ratios
Revenue/Employee: In the accounting year 2014, employee revenue of Tesco,
Morrison’s and Sainsbury’s Plc was £124513, £337953 & £484798 respectively. By
making evaluation of performance, it has been identified that workforce of Sainsbury’s
Plc is highly efficient and made significant contribution in the revenue level.
Operating Income/Employee: Below mentioned graph presents that operating income
generated by Morrison’s employees are highly lower as compared to Tesco &
Sainsbury’s Plc. Thus, Morrison is required to frame competent HR policies and
strategies to enhance employee performance (Ferrell and Fraedrich, 2015).
b. Writing a memo to managing director regarding the performance of firm along with the
recommendations
To,
Managing Director of Morrison’s Plc
Date: 21st March, 2017
Subject: Financial performance results
From financial statement analysis, it has been assessed that profitability aspect of the company
was worst in the year of 2014. During such period, both operating and net profit margin of firm
Paraphrase This Document
Need a fresh take? Get an instant paraphrase of this document with our AI Paraphraser
was negative which in turn closely influence the future monetary aspects of firm. Further, it has
been identified that liquidity position of the company was not sound. Moreover, as compared to
ideal ratio business unit was maintained only 25% of current assets. This in turn entails that
company was not highly capable in relation to meeting its current liabilities during the period of
2014. Along with this, company was also failed to generate high return from assets such as
debtors, inventory etc. Thus, it is suggested to the firm to follow below mentioned aspects which
will help it in enhancing financial performance:
Business organization should focus on sales promotional activities and adverstisement campaign.
Hence, by providing suitable information to the large number of customer regarding the quality
and price of product sales revenue and thereby profitability can be maximized. Along with this,
Morrison Plc should undertake budgeting technique for making control on cost level.
In addition to this, Morrison should lay more emphasis on maintaining current assets such as
cash etc by reducing the level of expenses. It can be done by the firm through the means of
continuous monitoring. By this, firm can maintain high liquidity and thereby would become able
to meet obligations on time.
Further, by encouraging personnel to give their best efforts Morrison’s Plc can make optimum
utilization of assets and thereby would become able to generate high profit margin.
Hence, by following all such measurers Morrison Plc can make significant improvement in the
profitability and liquidity aspects. All these aspects will help company in gaining competitive
edge over others.
Sincerely
Financial analysts
c. Outlining the limitations of financial ratios
Limitations
Different rules and regulations: Accounting policies which are undertaken by different
organizations highly differ. Moreover, some organization considers UK GAAP, whereas
other considers IAS and IFRS for both recording and reporting (Reckers and Samuelson,
2016).
Inflation: Rate of inflation changes over the years or time frame which in turn closely
influences the financial health and performance (Anderson and et.al., 2015). Hence, rate
of inflation highly varied from one year to another. In this, it is not possible to evaluate
company’s performance over the years.
Historical evaluation: Financial statement analysis presents information regarding the
past performance. However, it does not reflect trend in relation to future performance and
aspects (Bebbington, Unerman and O'Dwyer, 2014). Hence, by considering this it can be
stated ratio analysis tool does not help in making suitable decision regarding investment.
SECTION B
a. Using net present value technique to assess whether three year contract is profitable or not
Calculation of cash inflow
Particulars Year 1 Year 2 year 3
Sales revenue / turnover 180000 216000 259200
Material 60000 63000 66150
Labor 40000 42000 44100
Depreciation 11250 11250 11250
total outflow 111250 116250 121500
EBIT 68750 99750 137700
Taxation 0
22687.
5
32917.
5
EAT 68750
77062.
5 104783
⊘ This is a preview!⊘
Do you want full access?
Subscribe today to unlock all pages.
Trusted by 1+ million students worldwide
1 out of 18
Related Documents


Your All-in-One AI-Powered Toolkit for Academic Success.
+13062052269
info@desklib.com
Available 24*7 on WhatsApp / Email
![[object Object]](/_next/static/media/star-bottom.7253800d.svg)
Unlock your academic potential
Copyright © 2020–2026 A2Z Services. All Rights Reserved. Developed and managed by ZUCOL.