Analysis of Costing, Budgeting, and Financial Performance Metrics
VerifiedAdded on 2023/06/15
|12
|2666
|90
Report
AI Summary
This assignment solution covers key aspects of managing financial resources, including cost sheet calculations, variance analysis, and performance metrics. The cost sheet details prime cost, production cost, and other costs related to sales, distribution, and administration. Variance analysis explains adverse and favorable variances with real-world examples from companies like Tesco and Morrison. The report also discusses flexible budgets and direct labor variance. Furthermore, it explains and illustrates performance metrics such as Average Daily Rate (ADR), Revenue per Available Room (RevPAR), Average Rate Index (ARI), Market Penetration Index (MPI), and Average Length of Stay (ALOS) with examples from the hospitality industry, particularly Premier Inn hotel. Desklib offers this solved assignment and many other resources to support students in their studies.

MANAGING FINANCIAL
RESOURCES
RESOURCES
Paraphrase This Document
Need a fresh take? Get an instant paraphrase of this document with our AI Paraphraser
Table of Contents
SECTION A.....................................................................................................................................3
Question 1....................................................................................................................................3
SECTION B.....................................................................................................................................5
Question 4....................................................................................................................................5
Question 5....................................................................................................................................7
REFERENCES................................................................................................................................1

SECTION A
Question 1
Calculation of the following cost:
(a) Prime cost
(b) Production cost
(c) Other cost related to sales and distribution & administration
(d) Total cost
Calculation of Cost sheet
For the Costa
Particulars Details Amounts (£)
Direct Raw Material (a) Material used or consumed by
the company in production
process.
320000
Direct Labour (b) Cost of labour which is
directly associated with the
level of production
200000
Direct Expenses (Royalties)
(c)
Expenses which is directly
associated with the
production. For example,
Royalties in this question.
3600
PRIME COST (d) (a) + (b) + (c) 523600
Production Overheads:
Computer overheads expenses 2/3rd of expenses which is
associated with factory
= 9000 * 2 / 3 = 6000
6000
Wages paid for factory
supervision
It is associated with
production.
120000
Depreciation Depreciation on Machinery
used for production +
13000
⊘ This is a preview!⊘
Do you want full access?
Subscribe today to unlock all pages.
Trusted by 1+ million students worldwide
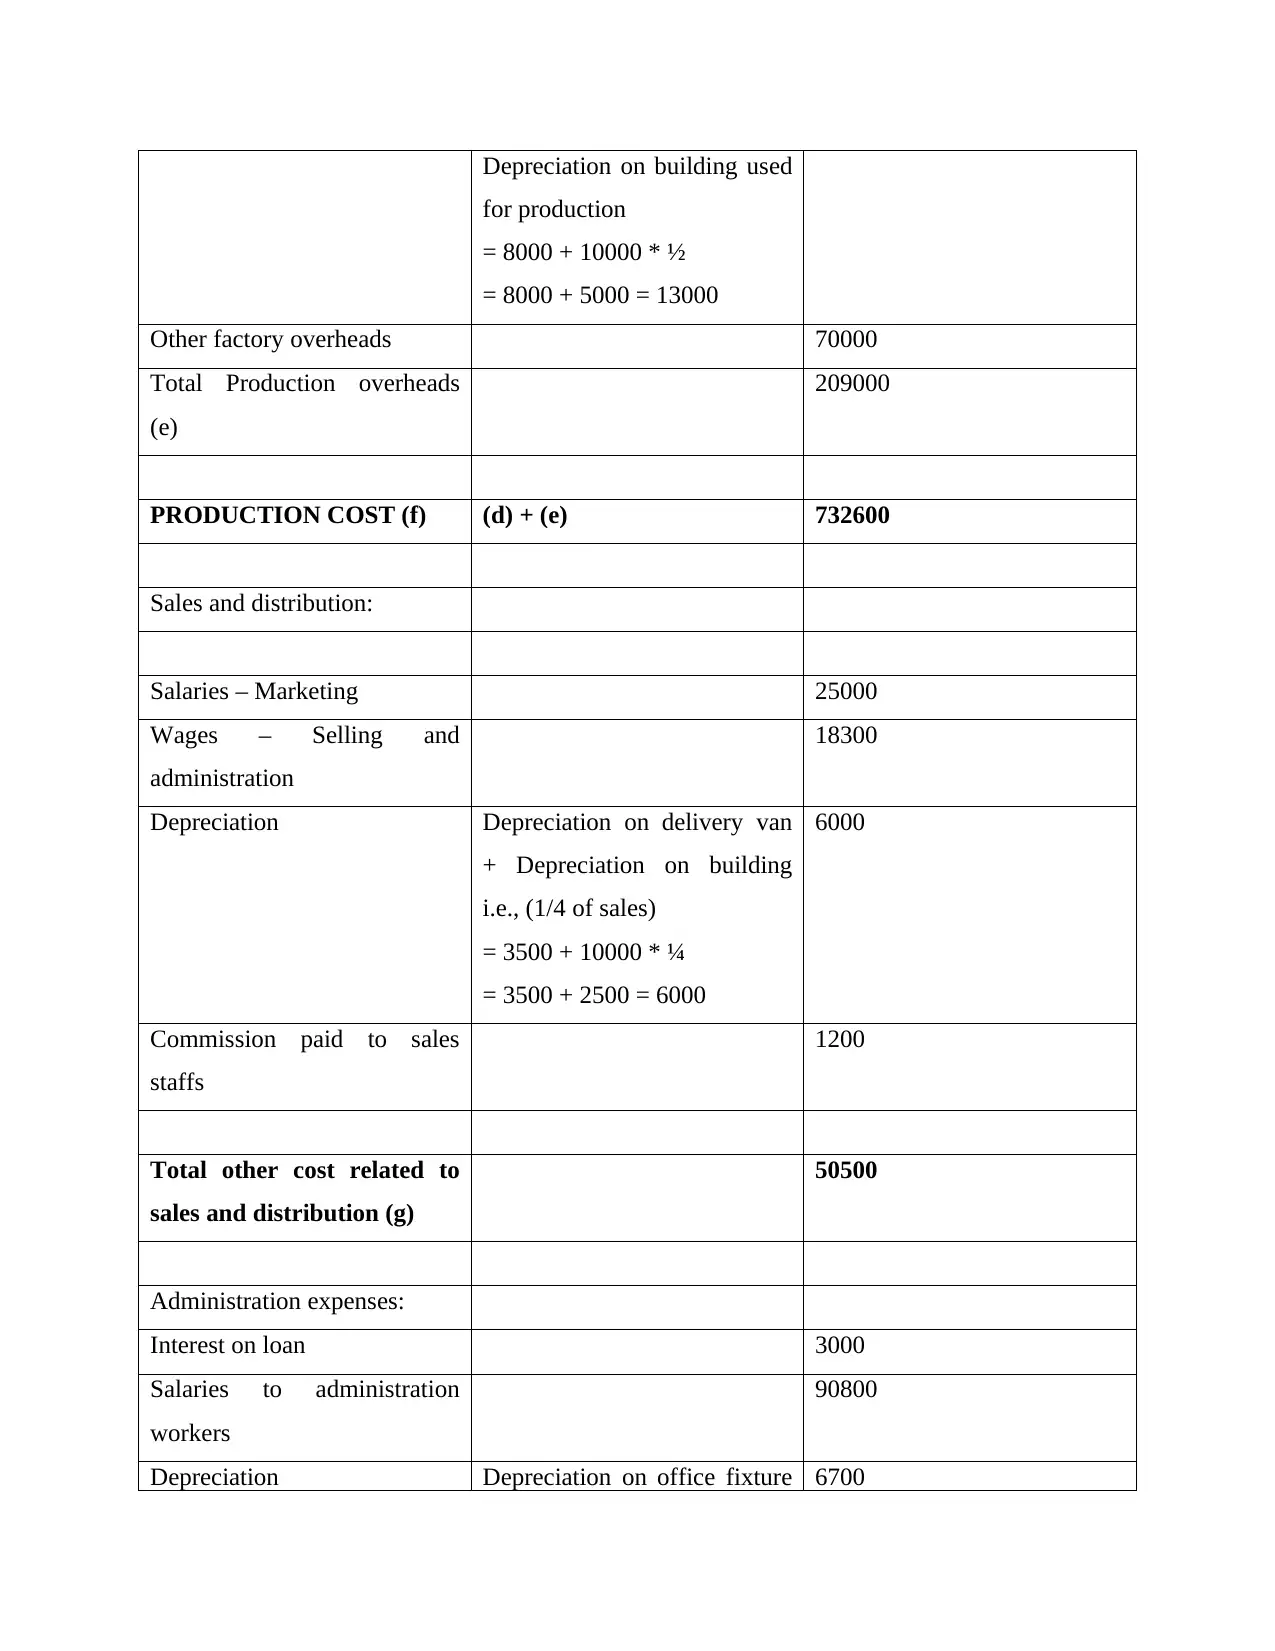
Depreciation on building used
for production
= 8000 + 10000 * ½
= 8000 + 5000 = 13000
Other factory overheads 70000
Total Production overheads
(e)
209000
PRODUCTION COST (f) (d) + (e) 732600
Sales and distribution:
Salaries – Marketing 25000
Wages – Selling and
administration
18300
Depreciation Depreciation on delivery van
+ Depreciation on building
i.e., (1/4 of sales)
= 3500 + 10000 * ¼
= 3500 + 2500 = 6000
6000
Commission paid to sales
staffs
1200
Total other cost related to
sales and distribution (g)
50500
Administration expenses:
Interest on loan 3000
Salaries to administration
workers
90800
Depreciation Depreciation on office fixture 6700
Paraphrase This Document
Need a fresh take? Get an instant paraphrase of this document with our AI Paraphraser

and fittings + Depreciation on
building i.e., 1/4 of office
= 4200 + 10000 * ¼
= 4200 + 2500 = 6700
Computer overhead expenses 1/3 of total expenses
= 9000 * 1/3 = 3000
3000
Total other cost related to
administration (h)
103500
TOTAL COST (f) + (g) + (h) 886600
SECTION B
Question 4
Analysis of following concept with example:
Variance Analysis
This is a technique of management accounting with the help of which companies analyses
the gap between its standard and actual cost. Every company prepare the budget in advance and
in order to control that budget uses the variance analysis to identify key area causing variance.
For example, Tesco Plc has prepared the budget specifying the quantity of direct material
required in next year is 50000 kg. But in reality, the actual material used by the production
department is 55000 kg. This higher 5000 kg i.e., actual – standard is leading to higher cost to
the company. But with the help of this gap identification, the company can adopt the proper
strategy to control it or correct the adverse cost (Dai and et.al., 2021). The management of Tesco
able to identify the occurrence and factors responsible for this adverse expenses such as
fluctuation in demand and supply, wastage of resources at high level etc.
Adverse Variance
This are those variances which are unfavourable to the firms and might be arises because
of the low sales as planned or high cost as budgeted. The cash receipt lower than the expected
and high payments more than the forecasted is also one of the reason behind the adverse
variance. The real life example of adverse variance is as follows: Morrison is a UK based retail
company that projected that in the year 2021 they will make a total sale of £200000 but in actual
they have only generated £170000 from the sales. This will cause them unfavourable and adverse
variance of £30000 i.e., £170000 - £200000. Another example of adverse variance is that the
company expected the total cost of production in the same year will be only £120000 but in
reality the company actual cost is £140000 which means an increase in the cost by £20000. This
is known an adverse variance or gap (Salles, Rocha and Goncalves, 2021).
Favourable Variance
Favourable variance is just opposite of adverse variance in which the actual income of the
company is higher than the standard one and actual expenses of the company is lower than the
projected expense. With the help of this positive results, the company and its staffs get the
motivation towards their work. For example, Eagle eye is a technology company which prepare
flexible budget every year and expect the next year expenses. The total expenses they are
expecting in the next year from its business is around £100000 but in actual they only incur
£75000. This means that actual – expected = £100000 - £75000 = £25000 favourable is a surplus
for the company which helps them in further expansion of the business (da Silva Alves and da
Rocha, 2021). Thus, every company have to use the variance analysis as a budgetary control
technique.
Flexible Budget
The flexible budgets are the budgets which is prepare by the company along with the
proper adjustment as per change in the level of activity. The flexible budget is totally different
from the static or fixed budget because it gets change over the period of time with the change in
the business internal and external environment. In order to prepare the flexible budget, the
company first need to identify its fixed and variable cost. It is because variable cost changes in
flexible budget and fixed cost remain the same at all level of activity. For example, Mark and
Spenser company has a budgeted revenue of £10 million and the cost of goods sold is £5 million.
In this total cost of goods sold the variable cost is only £3 million which changes over the change
in sales revenue (Fenny and et.al., 2021).
⊘ This is a preview!⊘
Do you want full access?
Subscribe today to unlock all pages.
Trusted by 1+ million students worldwide
But the remaining of £2 million does not changes because this are fixed in nature. In this
way, the company able to manage and control its budgets and enjoy the higher revenue and
profitability. The benefit of flexible budget to the M&S company is that it helps the manager to
pursue the new opportunities and mitigate the risk. In simple term, the flexible budget reflects
the state of finance more accurately.
Direct Labour Variance
This is a type of variance with the help of which the company can identify the gap
between the standard and actual direct labour cost. Formula of calculating the direct labour
variance is = (standard hours * standard rate) – (actual hours * actual rate). For example, Tesco
company has the following information regarding its direct labour and that they expected
standard hours require for 1 unit is 3 hours and actual hours the company worker takes is 200
hours for the total production of 50 units (Fernando, Samita and Peiris, 2021). The standard rate
of direct labour per hour is £20 and actual is £15 so the direct labour variance is as follows:
(50 * 3 * 20) – (200 * 16) = £200 adverse.
This means that the actual direct labour cost incurred by company is higher than the
expected one which need to be reduce. It might be because of the laziness of the worker and for
improving it the company have to motivate its employees.
Question 5
Explanation of the following using the formula and example:
Average Daily Rate (ADR)
This is basically a metric which is largely and widely used by the hospitality industry in
order to calculate the average revenue earned from an occupied room in a day. With the help of
this measure, the hotel and other loading company determine their operating performance and
make decision accordingly.
Formula of average daily rate = Rooms revenue earned / Number of rooms sold
Paraphrase This Document
Need a fresh take? Get an instant paraphrase of this document with our AI Paraphraser
Example: Premier Inn hotel of UK has around 72000 rooms in their total 800 hotels and the total
amount of revenue the company earn from its 800 hotel is £1440000. So, the average daily rates
of Premier Inn hotel are £1440000 / 72000 rooms = 20 per room
But on the other side, it is also noted that company does not consider the complimentary
rooms and rooms occupied by staff in the calculation of ADR. The benefit, the company are
enjoying with this measure is that its reduces their stress level and they able to increase the
money. In case if ADR is high, the company get to know that they are moving on a right track
(Rovella, 2017).
Revenue per available room (RevPAR)
This is another measure which help the hospitality sector companies in identifying the
revenue generated per available room. This helps them in measuring their revenue generation
performance.
Formula of revenue per available room = Average daily room rates * occupancy rate
The occupancy rate represents the rate of the rooms which are occupied by the customers.
Example; In the above case, the average daily rate of Premier Inn hotel is £20 per room from
total 72000 rooms. But the occupancy rate of the rooms is only 80% than the revenue per
available room is as follows:
£20 * 80% = £16 per room
So, on this basis it can be said that the total revenue Premier Inn hotel generated from its
one available room is £16. It is benefit for the company to use this measure also along with the
ADR measure because it provides more accurate result (Kuang, 2021). It is not possible that all
the time, all the rooms of the hotel is occupied by someone. So, it is important for company to
keep in mind this fact.
Average Rate Index (ARI)
This measure helps the hospitality industry and companies in identifying their own
average daily rate as compared with the competitors ADR. With the help of this, the company
such as hotels can determine whether they can exist or raise in the competitive market or not.
Formula of average rate index = Own ADR / Competitors average ADR
Example; Premier Inn is the largest brand of UK and its main or closet competitor is Gloria hotel
and resort. From the above calculation, it is identified that average daily rate of Premier Inn is
£20, while from the research it is identified that the ADR of Gloria hotel and resort is £15. So, on
this basis the ARI is as follows:
= £20 / £25 = 0.8
On this basis, it is identified that the price of the Premier Inn hotel is lower as compared
to its competitor (Murimi, Wadongo and Olielo, 2021). So, in order to improve it the company
need to increase their marketing for increasing bookings, attracting lower occupancy but on the
same side higher revenue in order to exist in the market.
Market Penetration Index (MPI)
This is also known as occupancy index with the help of which hospitality companies
measure its performance with the aggregate grouping of hotels. The higher MPI i.e., more than
100 is denote that the company’s occupancy performance is better than the aggregate number of
hotels (Caley and et.al., 2021). The occupancy is computed using the formula of rooms sold
divided by rooms available.
Formula of MPI = Subject hotel occupancy rate / aggregate group of hotels occupancy rate * 100
For example, Premier Inn has the occupancy rate of 80% and the aggregate group of hotels
occupancy rate is 70% than MPI is as follows:
= 80 / 70 * 100 = 114 which is more than 100.
So, on this basis it can be said that the overall occupancy performance of Premier Inn
hotel as compared to its aggregate other hotels is high and best. It is because Premier Inn hotel
has captured more than its expected shares.
Average Length of Stay (ALOS)
This is also one of the best measure which is used by hospitality industry in order to
identify the average number of days the tourist or other people spend in the hotels.
Formula = Total room nights / number of reservation checked in
For example, Premier Inn hotel had around 5 guest within a certain period and that five guest
spent 6, 4, 5, 3, 7 days respectively at hotel. So, the average length of stay of 5 guest at Premier
Inn hotel are as follows:
⊘ This is a preview!⊘
Do you want full access?
Subscribe today to unlock all pages.
Trusted by 1+ million students worldwide
= 6 + 4 + 5 + 3 + 7 / 5 guest = 25 days / 5 = 5 days
On this basis, it is state that the average length of stay of a guest in Premier Inn hotel is 5
days (Hoang, 2021). It is because the time spent by each guest in the hotel was different as their
arrival date and departure date are different from each other.
On this basis, it is state that the average length of stay of a guest in Premier Inn hotel is 5
days (Hoang, 2021). It is because the time spent by each guest in the hotel was different as their
arrival date and departure date are different from each other.
Paraphrase This Document
Need a fresh take? Get an instant paraphrase of this document with our AI Paraphraser
REFERENCES
Books and journals
Dai, M. and et.al., 2021. A dynamic mean-variance analysis for log returns. Management
Science. 67(2). pp.1093-1108.
Salles, T., Rocha, L. and Goncalves, M., 2021. A bias-variance analysis of state-of-the-art
random forest text classifiers. Advances in Data Analysis and Classification. 15(2).
pp.379-405.
da Silva Alves, L. A. and da Rocha, C. H. M., 2021. The Strategic Variance Analysis of LAN
and TAM airlines merger in the early 2010’s. Transportation Research Procedia. 58.
pp.503-510.
Fernando, D. R., Samita, S. and Peiris, T. U. S., 2021. Identifying Panel Inconsistency in
Sensory Profiles using Multivariate Analysis of Variance (MANOVA) and follow–up
Canonical Variate Analysis (CVA). Tropical Agricultural Research. 33(1).
Rovella, A., 2017. SIGLA: a flexible, portable and reusable ERP System for Research
Management.
Kuang, W., 2021. Conditional covariance matrix forecast using the hybrid exponentially
weighted moving average approach. Journal of Forecasting.
Murimi, M., Wadongo, B. and Olielo, T., 2021. Determinants of revenue management practices
and their impacts on the financial performance of hotels in Kenya: a proposed theoretical
framework. Future Business Journal. 7(1). pp.1-7.
Caley, L. and et.al., 2021. Average rate of lung function decline in adults with cystic fibrosis in
the United Kingdom: Data from the UK CF registry. Journal of Cystic Fibrosis. 20(1).
pp.86-90.
Hoang, A. D., 2021. Influence of culture on French sauna market penetration: case company:
Zenestar.
Fenny, A. P. and et.al., 2021. Costs and Extra Length of Stay because of Neonatal Bloodstream
Infection at a Teaching Hospital in Ghana. PharmacoEconomics-Open. 5(1). pp.111-120.
1

2
⊘ This is a preview!⊘
Do you want full access?
Subscribe today to unlock all pages.
Trusted by 1+ million students worldwide
1 out of 12
Related Documents

Your All-in-One AI-Powered Toolkit for Academic Success.
+13062052269
info@desklib.com
Available 24*7 on WhatsApp / Email
![[object Object]](/_next/static/media/star-bottom.7253800d.svg)
Unlock your academic potential
Copyright © 2020–2026 A2Z Services. All Rights Reserved. Developed and managed by ZUCOL.