Applied Business Finance: Financial Statements & Ratio Analysis Report
VerifiedAdded on 2023/06/17
|13
|2728
|392
Report
AI Summary
This report provides an analysis of applied business finance, focusing on the meaning and significance of financial management, key financial statements, and ratio analysis. It includes an income statement and balance sheet created using Excel, along with calculations of profitability, liquidity, and efficiency ratios based on case study information. The report interprets these ratios, highlighting the company's ability to generate profits and manage its resources. It also describes how business structure can improve financial performance, emphasizing the importance of sales, resource utilization, and cash management strategies. The conclusion emphasizes that effective financial management is crucial for a successful firm, aiding in planning, organizing, and maximizing earnings.

Applied Business
Finance
Finance
Paraphrase This Document
Need a fresh take? Get an instant paraphrase of this document with our AI Paraphraser
Table of Contents
INTRODUCTION...........................................................................................................................3
SECTION 1......................................................................................................................................3
Determine the meaning of financial management and its significance..................................3
SECTION 2......................................................................................................................................4
Explain the key financial statements and how ratios are used in financial management.......4
SECTION 3......................................................................................................................................5
(ii) Income statement using Excel.......................................................................................6
(iii) Completed the Balance sheet using excel.......................................................................6
(iv) Using case study information, calculate the Profitability, Liquidity, and Efficiency ratios
based on the company's analysis results .................................................................................7
SECTION 4......................................................................................................................................9
Describe the business structure that is being used to improve financial performance, using
examples from the case study.................................................................................................9
CONCLUSION................................................................................................................................9
REFERENCES..............................................................................................................................10
APPENDIX....................................................................................................................................11
INTRODUCTION
Financial management can be described as the activity of organising and controlling a
company's financial activities in order to assist the organisation earn higher returns. It monitors
the company's performance and the effectiveness of the finance management team using a
variety of accounting statements and procedures (Fang and et. al., 2018). In this report, the
concept and importance of financial management, as well as numerous accounting statements
and ratio analysis is explained. The income statement in the appendix further discusses the
performance of an organisation on the basis of its profitability, liquidity, and efficiency.
SECTION 1
Determine the meaning of financial management and its significance.
Finance is the foundation of any company. It is required to keep the business running
smoothly and efficiently. Financial management refers to the part of an organisation that is
responsible for the planning, arranging, directing, and managing of financial activities. It aids in
addressing the needs of shareholders while also maximising the company's income, profit, and
growth.
Financial Management’s importance:
1. Profitability: It examines the firm's efficiency and growth, which will aid in growing
profitability and providing a long-term strategy for the company.
2. Financial Decisions: It aids in the making of crucial financial decisions inside the firm.
A poor decision can jeopardise the entire company. It informs us of the many dangers and
possibilities, as well as assisting us in determining the percentage of shareholder capital
and borrowed cash.
3. Fund Allocation: The profit can be allocated to the right distribution of monetary
resources and dividends. It improves the functional ratio, lowers the cost of capital, and
raises the firm's economic worth.
4. Capital structure formation: It must be developed in order to estimate the amount of
capital necessary. Every venture is reliant on the amount of capital a company has and
how much it needs to raise from outside sources (Haw and et. al., 2018).
⊘ This is a preview!⊘
Do you want full access?
Subscribe today to unlock all pages.
Trusted by 1+ million students worldwide
5. Economic Stability: It gives the business a sense of security since it reflects a stable
financial structure. It can help the company gain more revenues by preventing degrading
activities.
SECTION 2
Explain the key financial statements and how ratios are used in financial management.
Financial Statements are the records that the corporation is required to keep. It depicts the
company's economic activity and status. Government officials, accountants, and firms audit these
both internally and externally to ensure the reliability and validity of the tax and for investment
considerations (Huang and et. al., 2018). The following are some of the most important financial
statements:
Balance Sheet: It shows the assets, liabilities, and shareholder equity of a company
throughout the course of a fiscal year. Both the asset and liability sections should be
equal; if they aren't, there is a problem with the transaction recording. It also displays the
current fiscal year's cash and bank balances.
Income Statement: It focuses on the company's revenues and expenses to determine the
profit, which is known as net income. It's kept in order to show how much money the
company makes. It is calculated by summing the revenue and subtracting the expenses
incurred throughout the fiscal year to arrive at the fiscal year's net profit or loss. It is split
into two sections. First, it calculates gross profit based on operating income and expenses.
The net profit is derived by subtracting non-operating expenses and adding non-operating
income.
Cash Flow Statements: It aids in determining the requirement for external funding. It
calculates the cash inflow and outflow for operating, investing, and financing activities.
The changes in current assets and current liabilities, as well as interest and tax payments,
are all part of operating activities. The purchase or sale of fixed assets, as well as any
payment related to the company's merger and acquisition, are all examples of investing
activities. The issuance of equity capital, debentures, loans, and dividend payments are all
examples of financing activities.
Ratios: These are used to assess the state of two or more financial statement parts. It
summarises the financial data seen in the financial statements. It assesses the company's financial
Paraphrase This Document
Need a fresh take? Get an instant paraphrase of this document with our AI Paraphraser
performance, allowing the company to be proactive. It assesses both short- and long-term
financial and operational performance, assisting in the identification of company trends
(Mahpour and Mortaheb, 2018). It refers to the relationship or comparison that is established
between the various statistics in the profit and loss account and the balance sheet. These ratios
aid in evaluating a company's performance by comparing it to prior year's results or to the
performance of other companies in the same field. It also aids in detecting the current trend and
forecasting future trends. There are a variety of ratios that businesses can employ to manage their
cash.
Uses of Ratios:
Comparisons: It assesses the financial performance of the company and compares it to
that of other companies in the same industry.
Decision-Making: Gainfulness, trends, paying and borrowing capacity may all be
assessed using financial statements, which aids in making the best selections.
Operational Efficiency: It aids in the determination of a company's liquidity, solvency,
and profitability. And it also shows management's ability to keep costs low while creating
revenue and profit (Mestry, 2018).
Financial Resource Utilization: It provides quantitative information about the company
that aids in evaluating resource overuse and underutilization.
SECTION 3
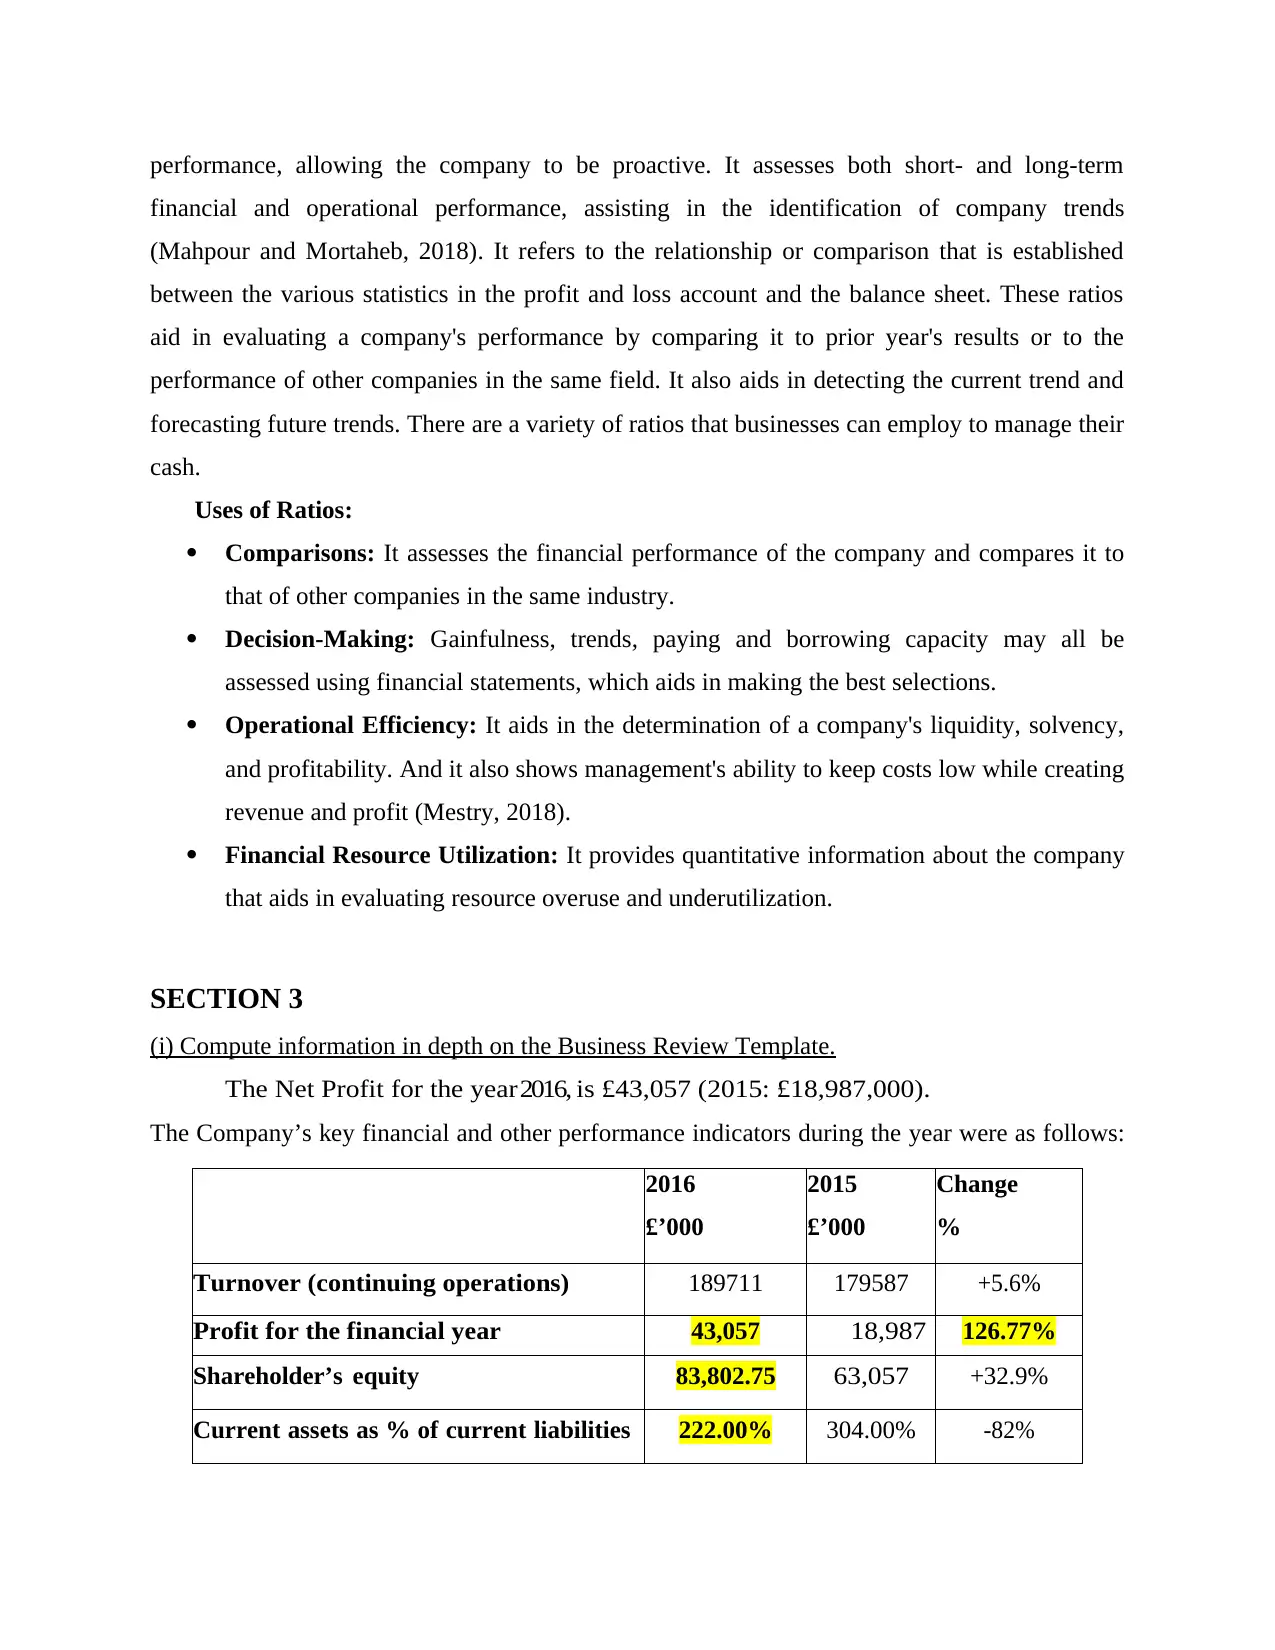
(i) Compute information in depth on the Business Review Template.
The Net Profit for the year 2016, is £43,057 (2015: £18,987,000).
The Company’s key financial and other performance indicators during the year were as follows:
2016
£’000
2015
£’000
Change
%
Turnover (continuing operations) 189711 179587 +5.6%
Profit for the financial year 43,057 18,987 126.77%
Shareholder’s equity 83,802.75 63,057 +32.9%
Current assets as % of current liabilities 222.00% 304.00% -82%
financial and operational performance, assisting in the identification of company trends
(Mahpour and Mortaheb, 2018). It refers to the relationship or comparison that is established
between the various statistics in the profit and loss account and the balance sheet. These ratios
aid in evaluating a company's performance by comparing it to prior year's results or to the
performance of other companies in the same field. It also aids in detecting the current trend and
forecasting future trends. There are a variety of ratios that businesses can employ to manage their
cash.
Uses of Ratios:
Comparisons: It assesses the financial performance of the company and compares it to
that of other companies in the same industry.
Decision-Making: Gainfulness, trends, paying and borrowing capacity may all be
assessed using financial statements, which aids in making the best selections.
Operational Efficiency: It aids in the determination of a company's liquidity, solvency,
and profitability. And it also shows management's ability to keep costs low while creating
revenue and profit (Mestry, 2018).
Financial Resource Utilization: It provides quantitative information about the company
that aids in evaluating resource overuse and underutilization.
SECTION 3
(i) Compute information in depth on the Business Review Template.
The Net Profit for the year 2016, is £43,057 (2015: £18,987,000).
The Company’s key financial and other performance indicators during the year were as follows:
2016
£’000
2015
£’000
Change
%
Turnover (continuing operations) 189711 179587 +5.6%
Profit for the financial year 43,057 18,987 126.77%
Shareholder’s equity 83,802.75 63,057 +32.9%
Current assets as % of current liabilities 222.00% 304.00% -82%
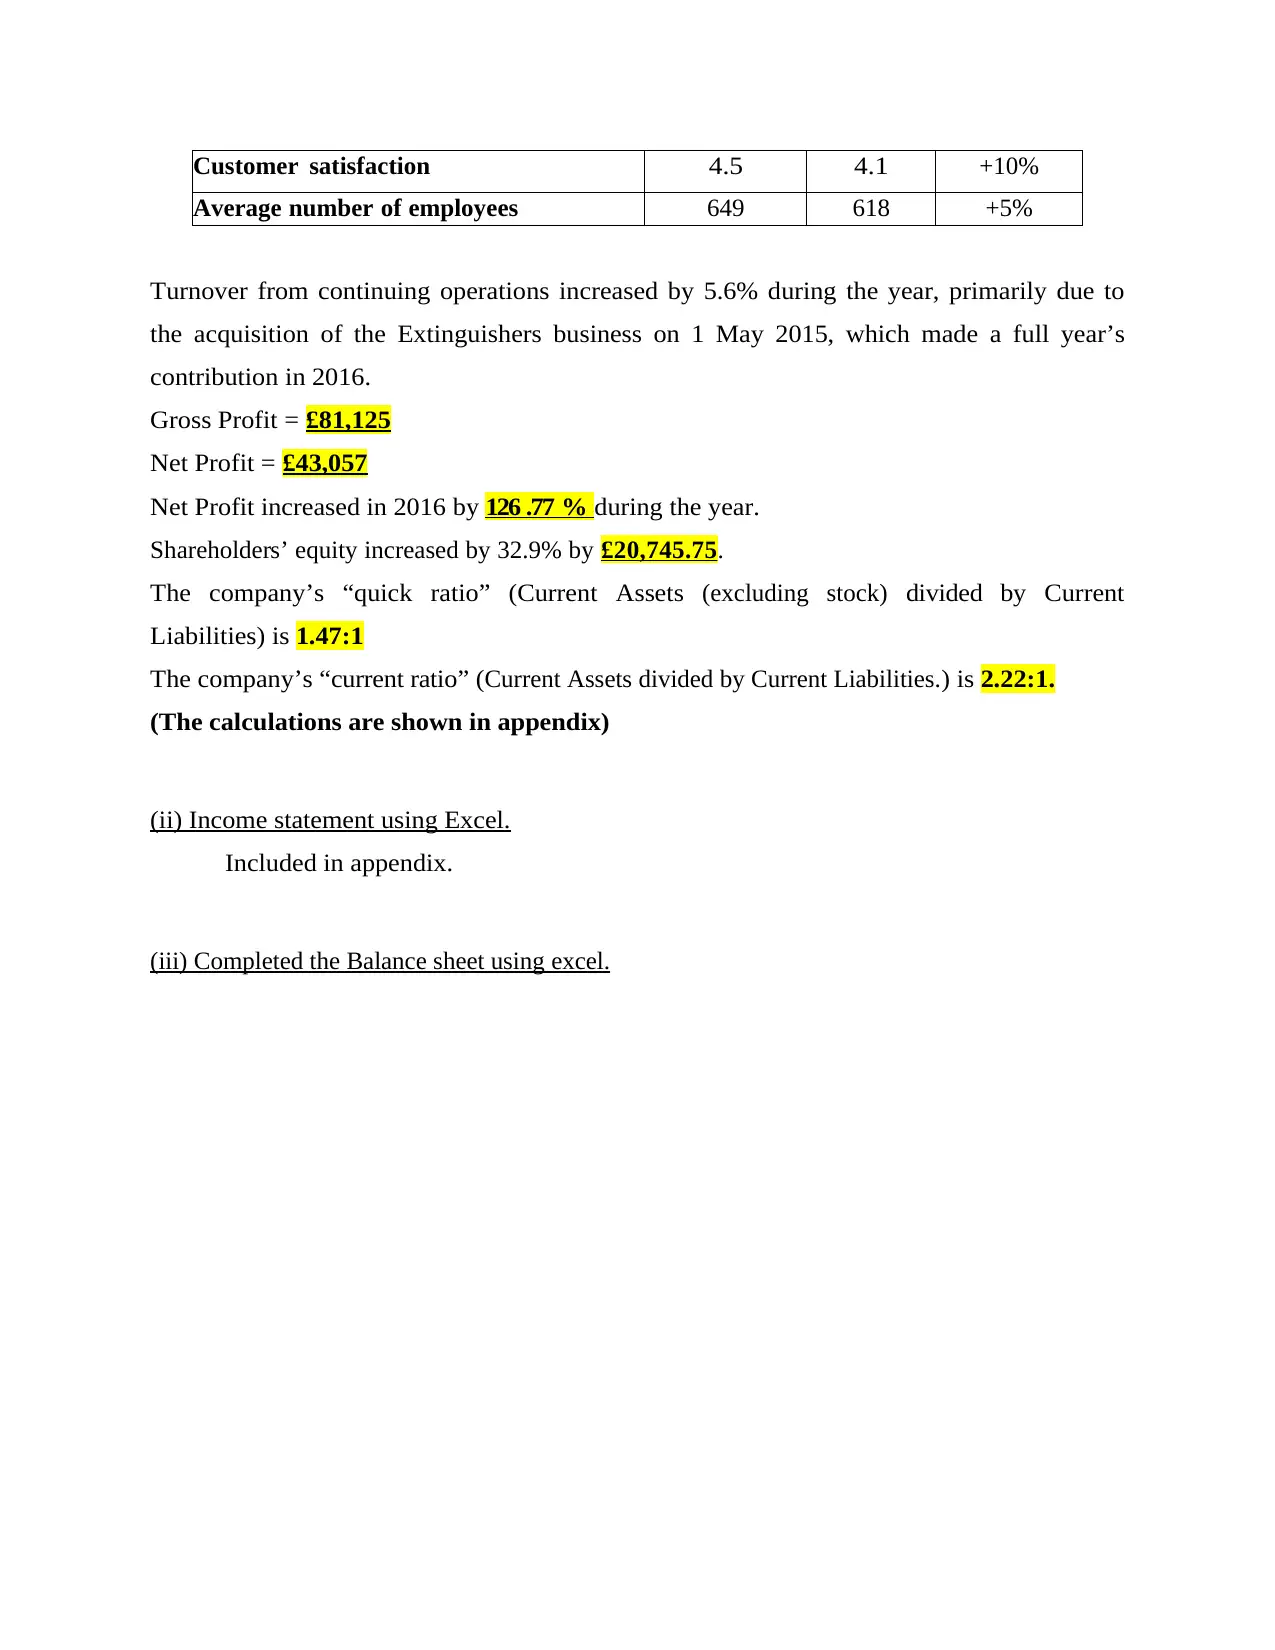
Customer satisfaction 4.5 4.1 +10%
Average number of employees 649 618 +5%
Turnover from continuing operations increased by 5.6% during the year, primarily due to
the acquisition of the Extinguishers business on 1 May 2015, which made a full year’s
contribution in 2016.
Gross Profit = £81,125
Net Profit = £43,057
Net Profit increased in 2016 by 126 .77 % during the year.
Shareholders’ equity increased by 32.9% by £20,745.75.
The company’s “quick ratio” (Current Assets (excluding stock) divided by Current
Liabilities) is 1.47:1
The company’s “current ratio” (Current Assets divided by Current Liabilities. ) is 2.22:1.
(The calculations are shown in appendix)
(ii) Income statement using Excel.
Included in appendix.
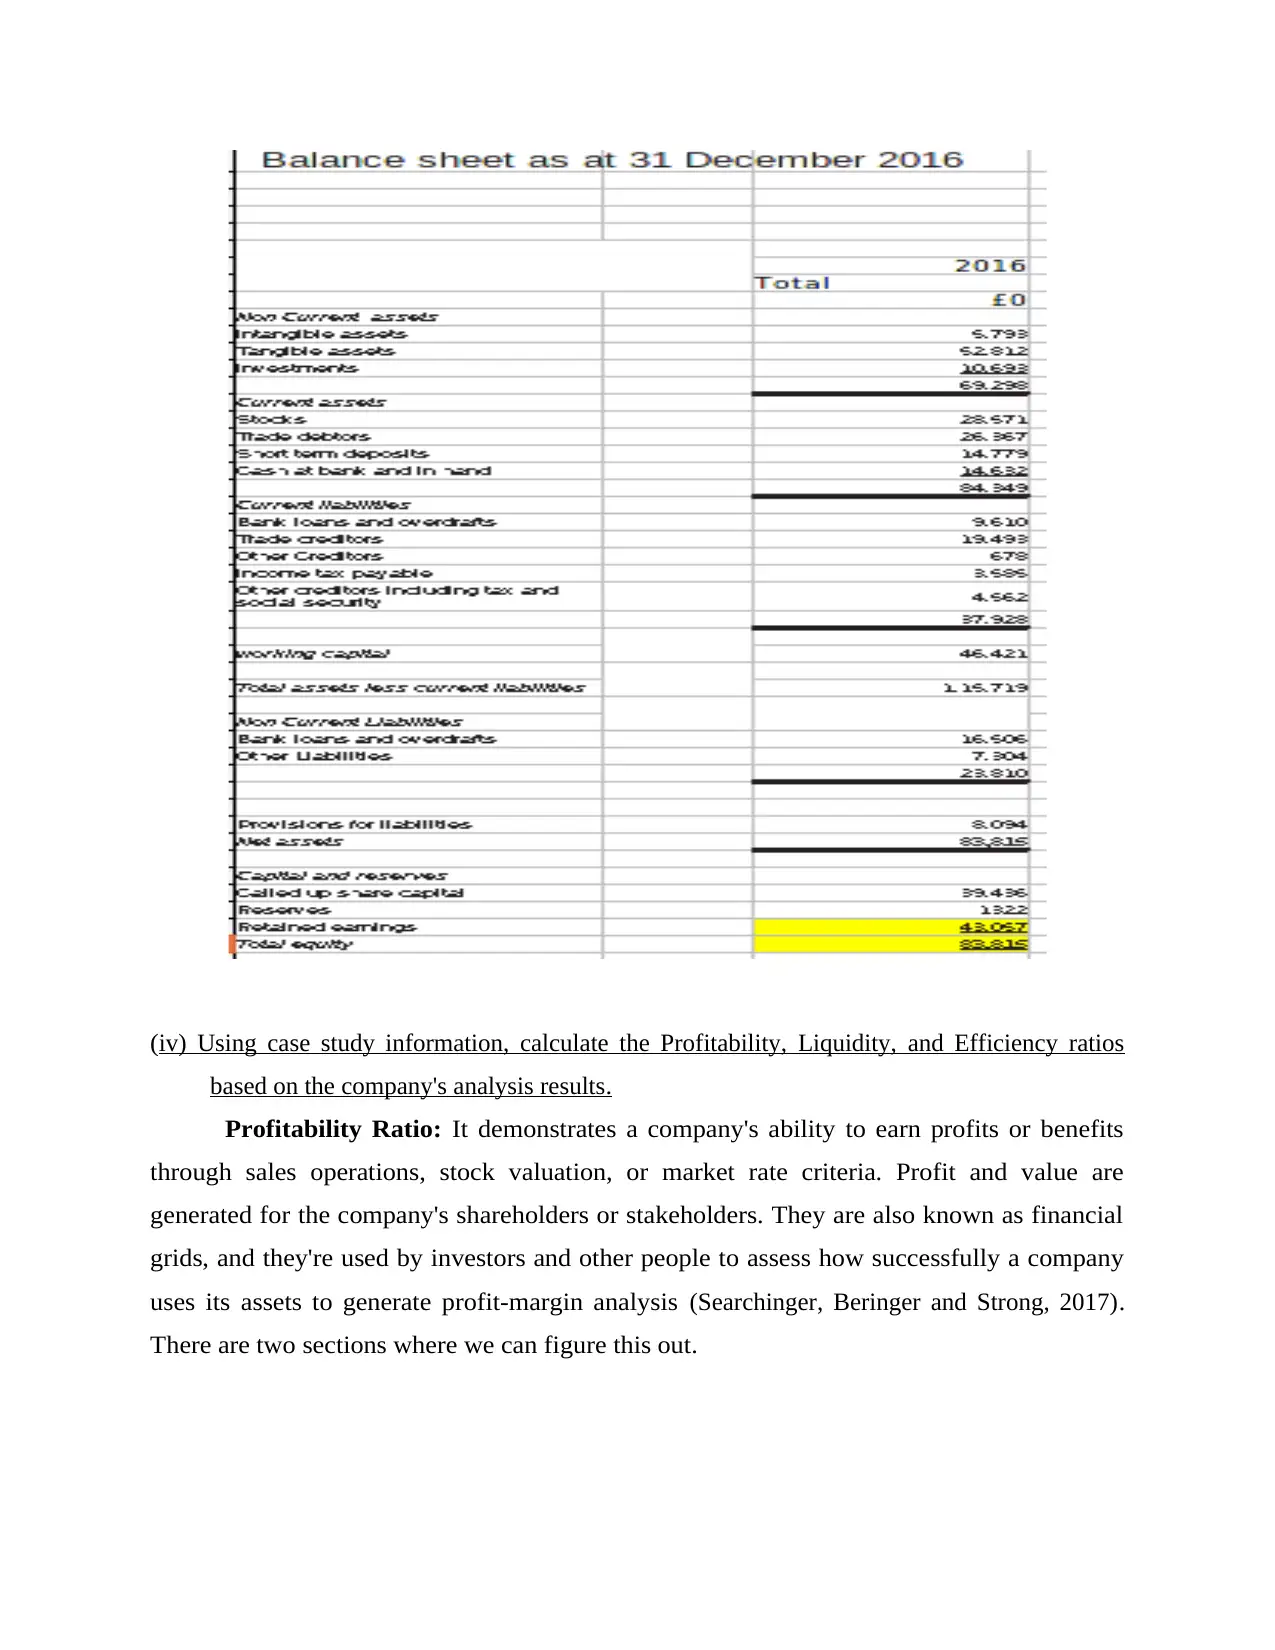
(iii) Completed the Balance sheet using excel.
Average number of employees 649 618 +5%
Turnover from continuing operations increased by 5.6% during the year, primarily due to
the acquisition of the Extinguishers business on 1 May 2015, which made a full year’s
contribution in 2016.
Gross Profit = £81,125
Net Profit = £43,057
Net Profit increased in 2016 by 126 .77 % during the year.
Shareholders’ equity increased by 32.9% by £20,745.75.
The company’s “quick ratio” (Current Assets (excluding stock) divided by Current
Liabilities) is 1.47:1
The company’s “current ratio” (Current Assets divided by Current Liabilities. ) is 2.22:1.
(The calculations are shown in appendix)
(ii) Income statement using Excel.
Included in appendix.
(iii) Completed the Balance sheet using excel.
⊘ This is a preview!⊘
Do you want full access?
Subscribe today to unlock all pages.
Trusted by 1+ million students worldwide
(iv) Using case study information, calculate the Profitability, Liquidity, and Efficiency ratios
based on the company's analysis results.
Profitability Ratio: It demonstrates a company's ability to earn profits or benefits
through sales operations, stock valuation, or market rate criteria. Profit and value are
generated for the company's shareholders or stakeholders. They are also known as financial
grids, and they're used by investors and other people to assess how successfully a company
uses its assets to generate profit-margin analysis (Searchinger, Beringer and Strong, 2017) .
There are two sections where we can figure this out.
Paraphrase This Document
Need a fresh take? Get an instant paraphrase of this document with our AI Paraphraser
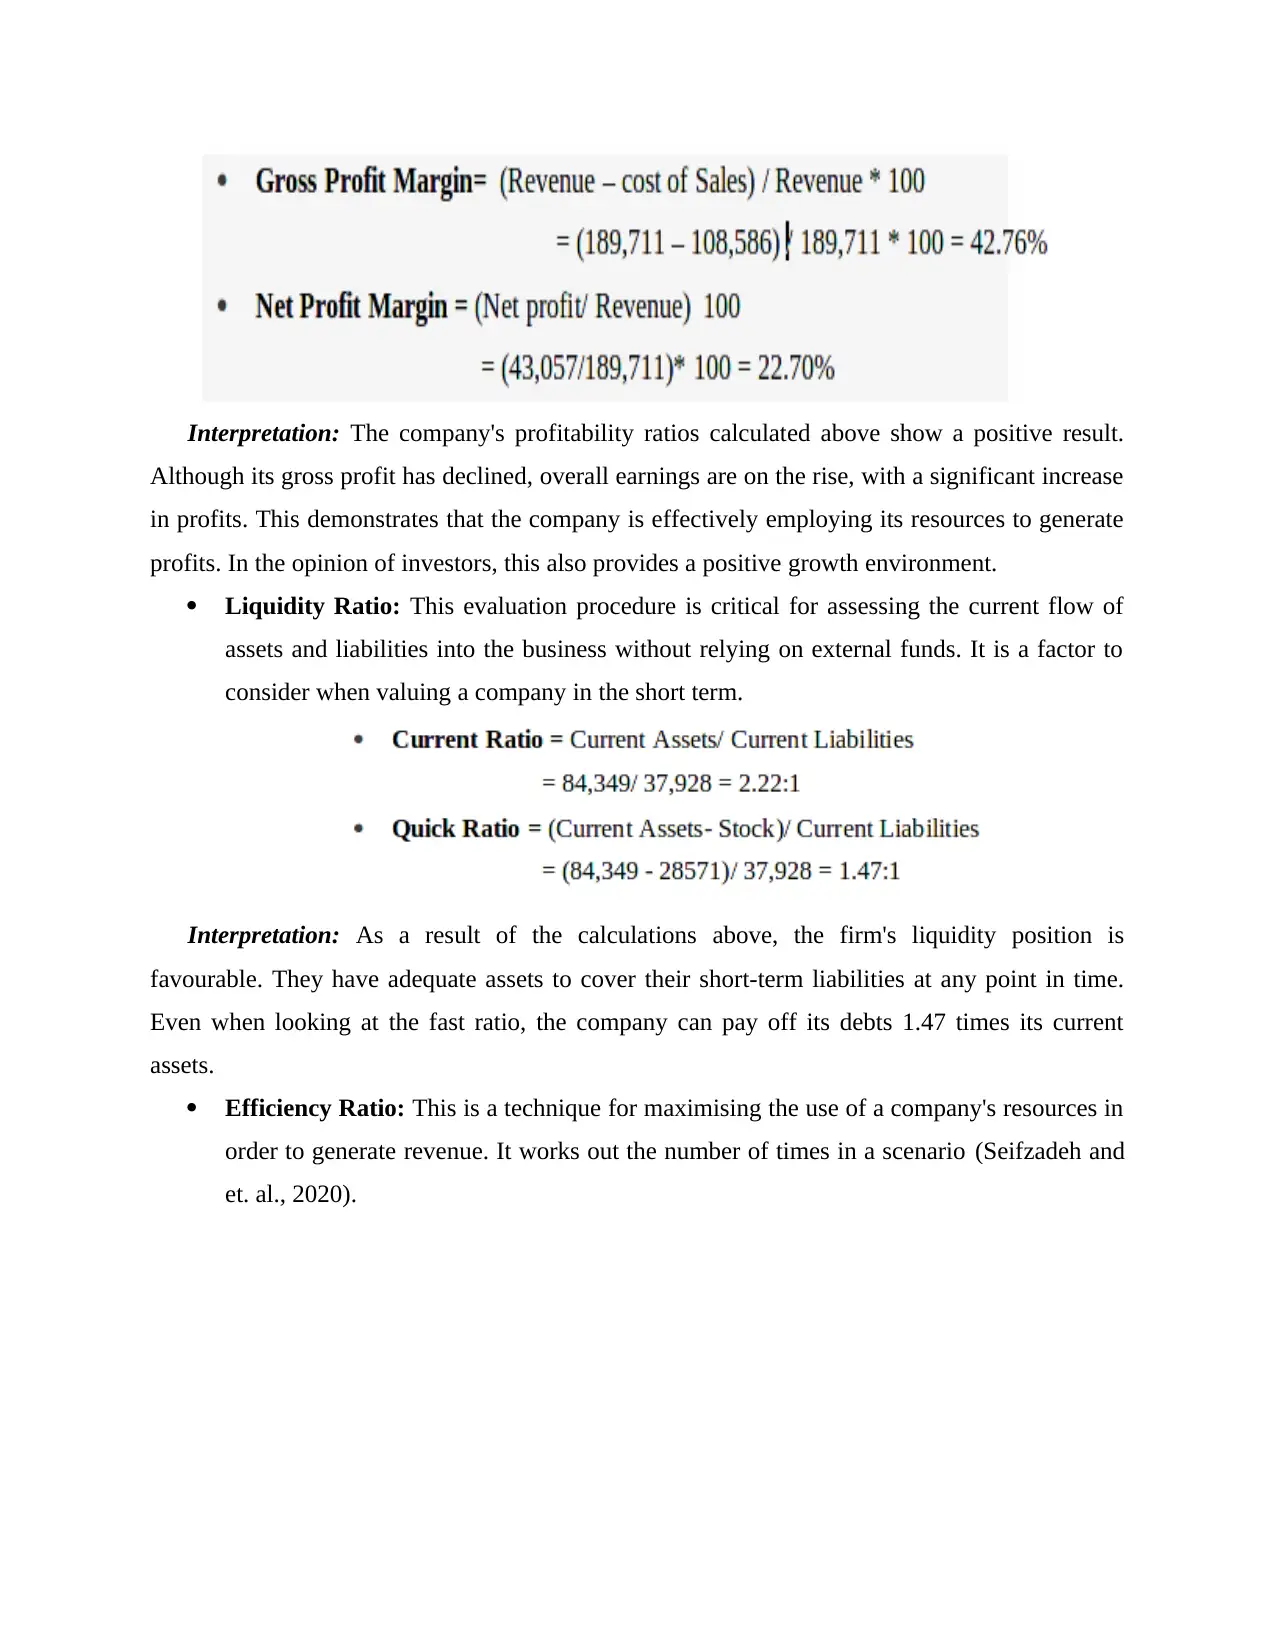
Interpretation: The company's profitability ratios calculated above show a positive result.
Although its gross profit has declined, overall earnings are on the rise, with a significant increase
in profits. This demonstrates that the company is effectively employing its resources to generate
profits. In the opinion of investors, this also provides a positive growth environment.
Liquidity Ratio: This evaluation procedure is critical for assessing the current flow of
assets and liabilities into the business without relying on external funds. It is a factor to
consider when valuing a company in the short term.
Interpretation: As a result of the calculations above, the firm's liquidity position is
favourable. They have adequate assets to cover their short-term liabilities at any point in time.
Even when looking at the fast ratio, the company can pay off its debts 1.47 times its current
assets.
Efficiency Ratio: This is a technique for maximising the use of a company's resources in
order to generate revenue. It works out the number of times in a scenario (Seifzadeh and
et. al., 2020).
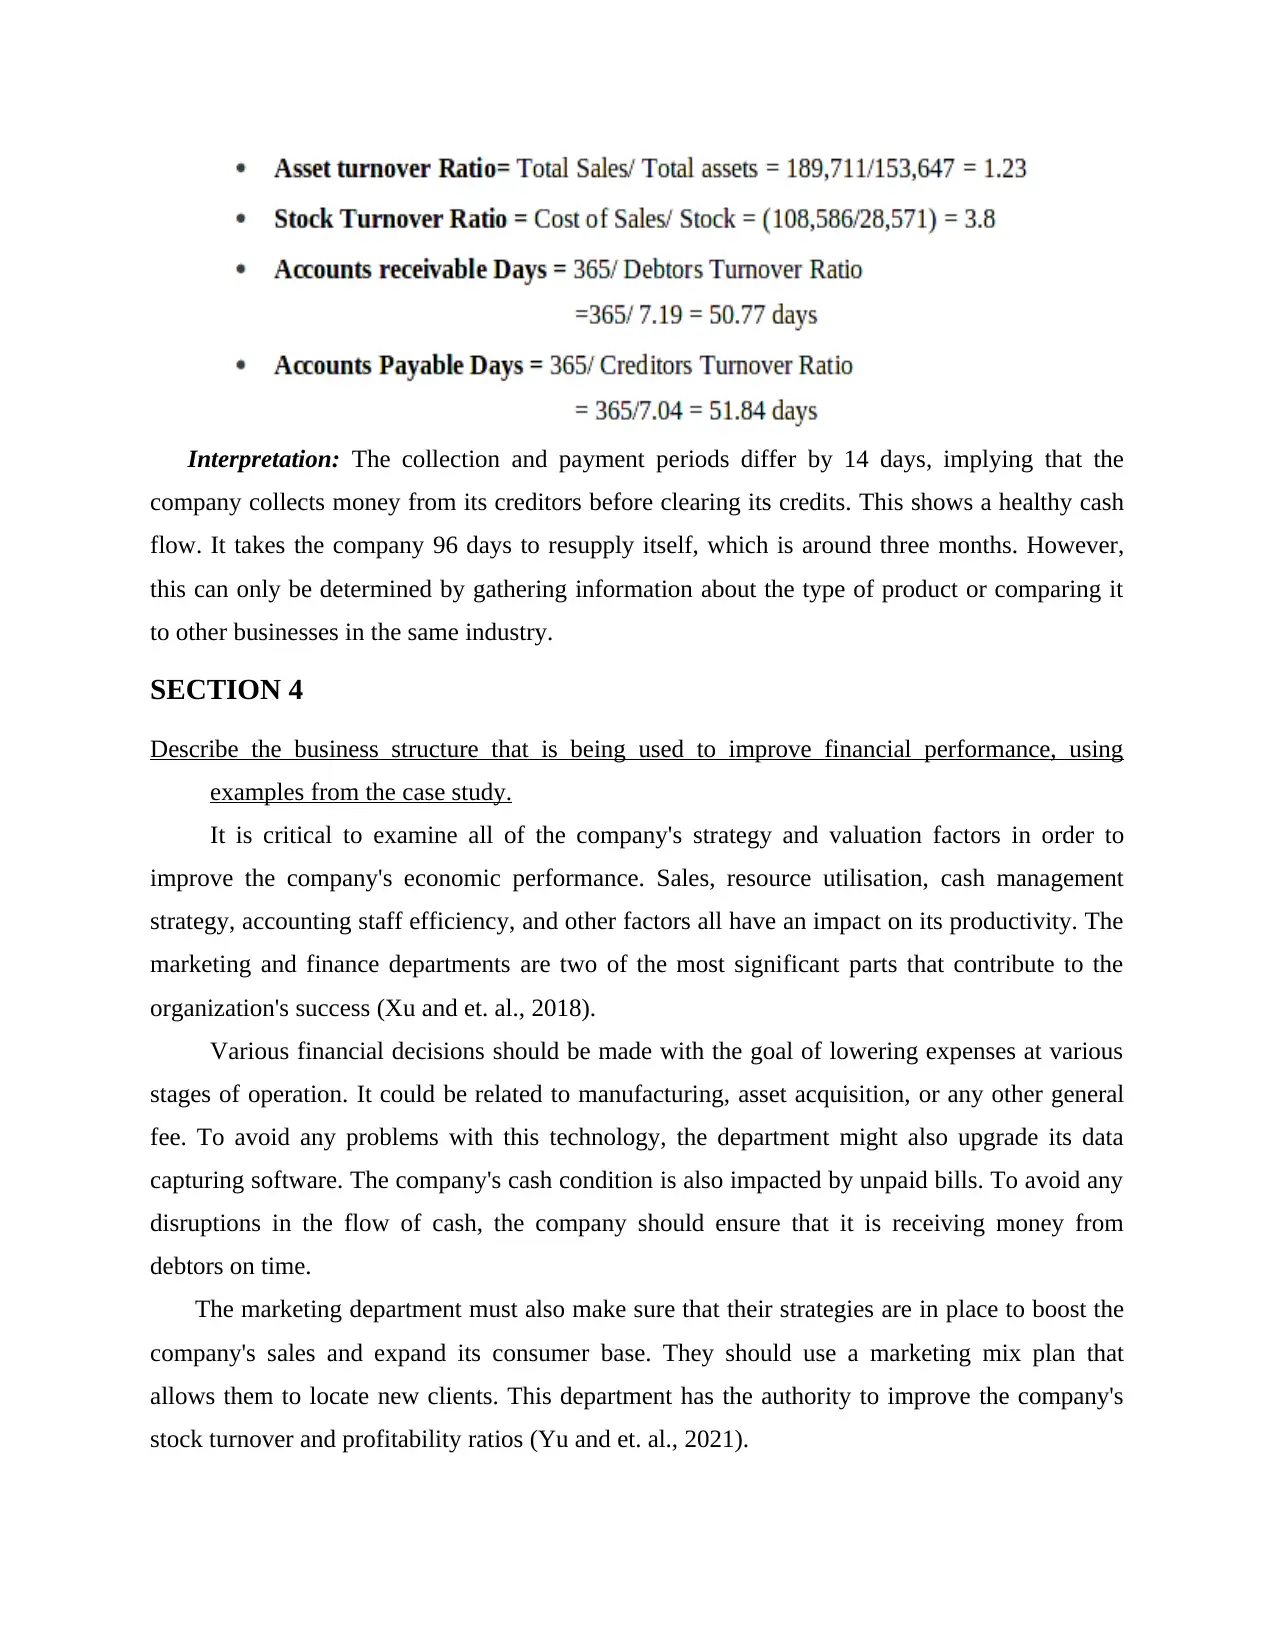
Interpretation: The collection and payment periods differ by 14 days, implying that the
company collects money from its creditors before clearing its credits. This shows a healthy cash
flow. It takes the company 96 days to resupply itself, which is around three months. However,
this can only be determined by gathering information about the type of product or comparing it
to other businesses in the same industry.
SECTION 4
Describe the business structure that is being used to improve financial performance, using
examples from the case study.
It is critical to examine all of the company's strategy and valuation factors in order to
improve the company's economic performance. Sales, resource utilisation, cash management
strategy, accounting staff efficiency, and other factors all have an impact on its productivity. The
marketing and finance departments are two of the most significant parts that contribute to the
organization's success (Xu and et. al., 2018).
Various financial decisions should be made with the goal of lowering expenses at various
stages of operation. It could be related to manufacturing, asset acquisition, or any other general
fee. To avoid any problems with this technology, the department might also upgrade its data
capturing software. The company's cash condition is also impacted by unpaid bills. To avoid any
disruptions in the flow of cash, the company should ensure that it is receiving money from
debtors on time.
The marketing department must also make sure that their strategies are in place to boost the
company's sales and expand its consumer base. They should use a marketing mix plan that
allows them to locate new clients. This department has the authority to improve the company's
stock turnover and profitability ratios (Yu and et. al., 2021).
⊘ This is a preview!⊘
Do you want full access?
Subscribe today to unlock all pages.
Trusted by 1+ million students worldwide
CONCLUSION
From the above report, it can be stated that a successful firm requires an effective
financial management system. It plans and organises all of the finances in order to maximise
earnings and maximise utility. It employs a variety of financial accounts to assess the
performance of a corporation using techniques such as accounting ratios and to identify solutions
for improving the firm's situation. These ratios aid in the interpretation of the company's
profitability, efficiency, and liquidity status by establishing a relationship between the various
figures in the financial statements.
Paraphrase This Document
Need a fresh take? Get an instant paraphrase of this document with our AI Paraphraser
REFERENCES
Books and Journals
Fang, W and et. al., 2018. Falls from heights: A computer vision-based approach for safety
harness detection. Automation in Construction. 91. pp.53-61.
Haw, I.M and et. al., 2018. Having a finger in the pie: labor power and corporate payout
policy. Financial Management. 47(4). pp.993-1027.
Huang, J and et. al., 2018. Build financial capability for all. Grand challenges for social work
and society. pp.227-247.
Mahpour, A. and Mortaheb, M.M., 2018. Financial-based incentive plan to reduce construction
waste. Journal of Construction Engineering and Management. 144(5). p.04018029.
Mestry, R., 2018. The role of governing bodies in the management of financial resources in
South African no-fee public schools. Educational Management Administration &
Leadership. 46(3). pp.385-400.
Searchinger, T.D., Beringer, T. and Strong, A., 2017. Does the world have low-carbon bioenergy
potential from the dedicated use of land? Energy Policy. 110. pp.434-446.
Seifzadeh, M and et. al., 2020. The relationship between management characteristics and
financial statement readability. EuroMed Journal of Business.
Xu, H and et. al., 2018. Personal exposure of PM2. 5 emitted from solid fuels combustion for
household heating and cooking in rural Guanzhong Plain, northwestern
China. Atmospheric Environment. 185. pp.196-206.
Yu, H and et. al., 2021. Polycyclic aromatic hydrocarbons in surface waters from the seven main
river basins of China: Spatial distribution, source apportionment, and potential risk
assessment. Science of the Total Environment. 752. p.141764.
Zelenkov, Y., Fedorova, E. and Chekrizov, D., 2017. Two-step classification method based on
genetic algorithm for bankruptcy forecasting. Expert Systems with Applications. 88.
pp.393-401.
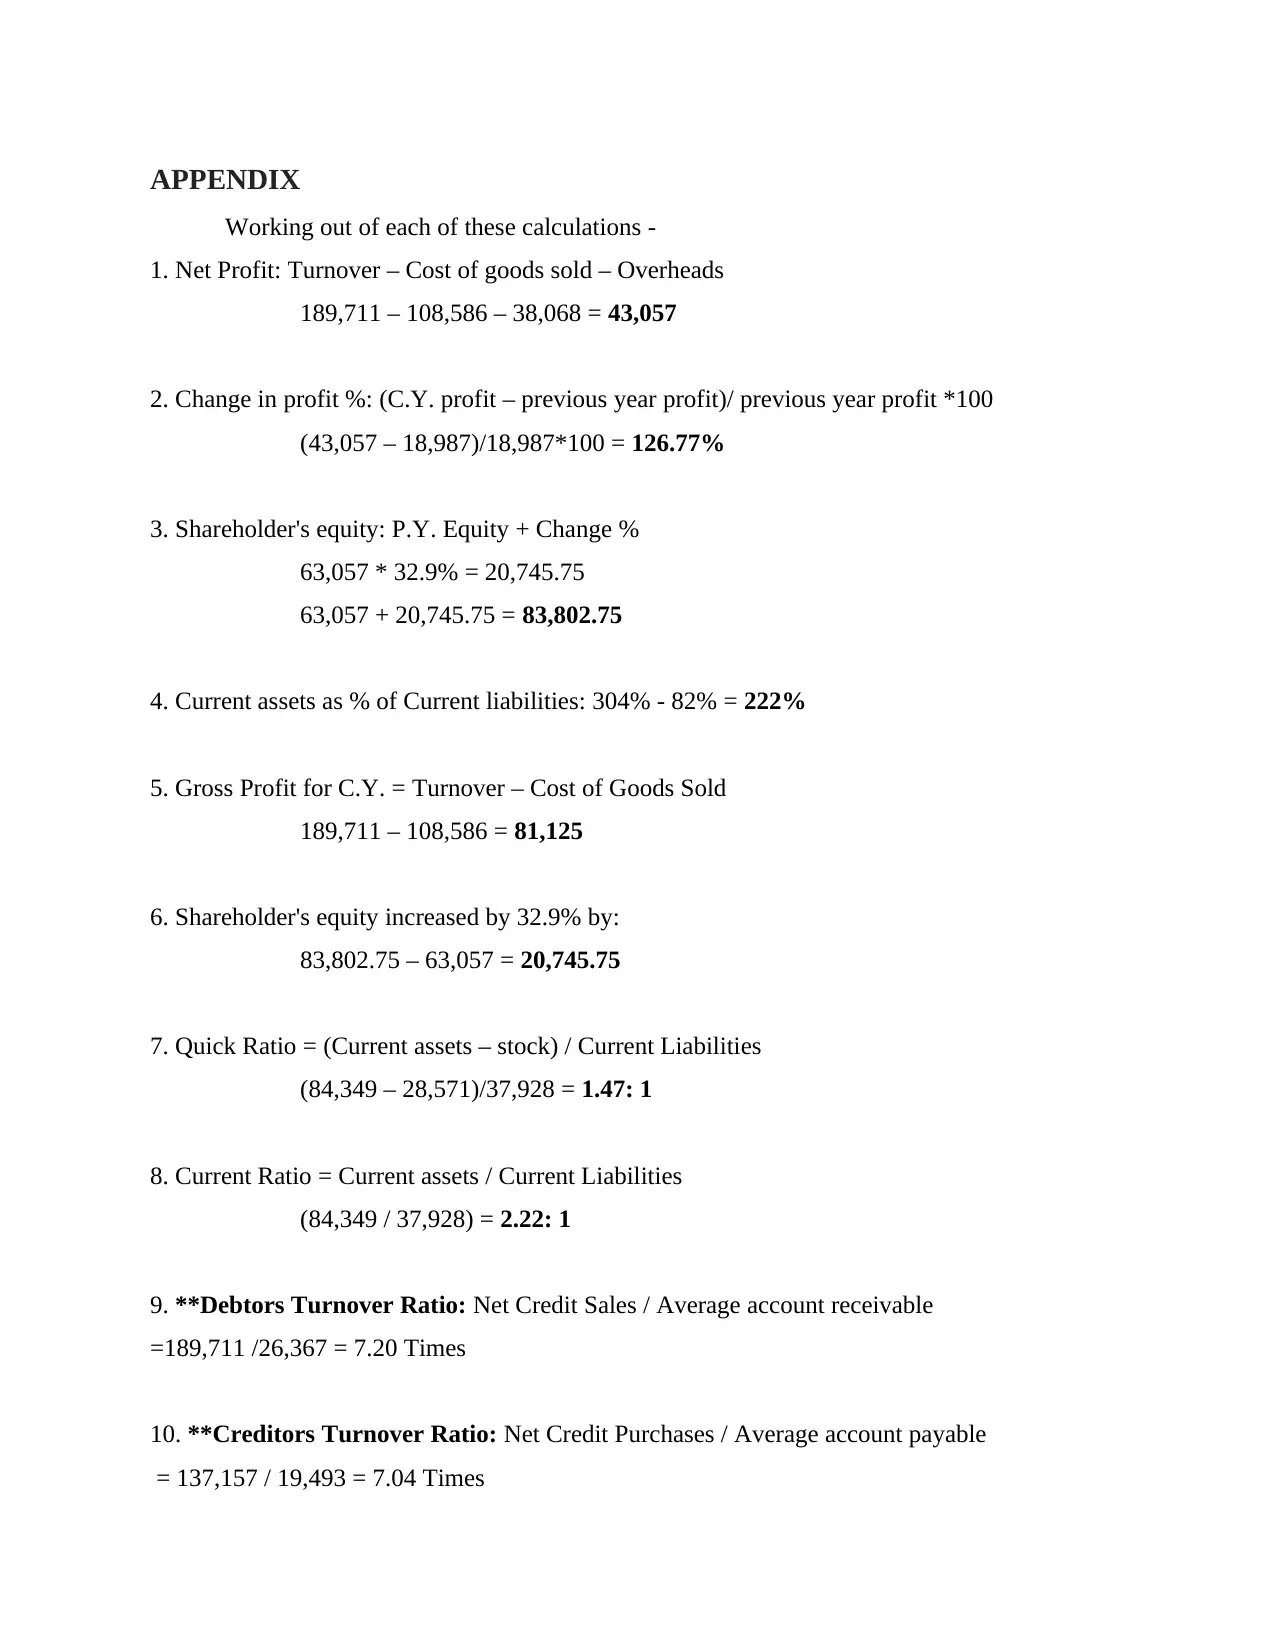
APPENDIX
Working out of each of these calculations -
1. Net Profit: Turnover – Cost of goods sold – Overheads
189,711 – 108,586 – 38,068 = 43,057
2. Change in profit %: (C.Y. profit – previous year profit)/ previous year profit *100
(43,057 – 18,987)/18,987*100 = 126.77%
3. Shareholder's equity: P.Y. Equity + Change %
63,057 * 32.9% = 20,745.75
63,057 + 20,745.75 = 83,802.75
4. Current assets as % of Current liabilities: 304% - 82% = 222%
5. Gross Profit for C.Y. = Turnover – Cost of Goods Sold
189,711 – 108,586 = 81,125
6. Shareholder's equity increased by 32.9% by:
83,802.75 – 63,057 = 20,745.75
7. Quick Ratio = (Current assets – stock) / Current Liabilities
(84,349 – 28,571)/37,928 = 1.47: 1
8. Current Ratio = Current assets / Current Liabilities
(84,349 / 37,928) = 2.22: 1
9. **Debtors Turnover Ratio: Net Credit Sales / Average account receivable
=189,711 /26,367 = 7.20 Times
10. **Creditors Turnover Ratio: Net Credit Purchases / Average account payable
= 137,157 / 19,493 = 7.04 Times
⊘ This is a preview!⊘
Do you want full access?
Subscribe today to unlock all pages.
Trusted by 1+ million students worldwide
1 out of 13
Related Documents


Your All-in-One AI-Powered Toolkit for Academic Success.
+13062052269
info@desklib.com
Available 24*7 on WhatsApp / Email
![[object Object]](/_next/static/media/star-bottom.7253800d.svg)
Unlock your academic potential
Copyright © 2020–2026 A2Z Services. All Rights Reserved. Developed and managed by ZUCOL.