Financial Analysis and Comparison of Farsons and Heiniken Enterprises
VerifiedAdded on 2023/01/18
|36
|7567
|69
Report
AI Summary
This report presents a comprehensive financial analysis of Farsons and Heiniken, two companies operating in the beverage sector. The analysis utilizes financial statements from 2015 to 2018 to evaluate the companies' financial performance. The report employs vertical, horizontal, and ratio analysis techniques to assess trends in income statements, balance sheets, and cash flow. Vertical analysis, also known as common-size analysis, is used to express each item as a percentage of a base amount, providing insights into the composition of financial statements. Horizontal analysis, or trend analysis, compares financial data over multiple periods to identify changes and patterns. Ratio analysis, including net profit and gross profit margins, is used to evaluate profitability, efficiency, and liquidity. The analysis offers a comparative overview of the financial health of both companies, highlighting their strengths, weaknesses, and overall financial positions. The report also includes an evaluation of working capital and cash flow, providing a complete assessment of the financial performance of Farsons and Heiniken.
Financial Analysis
Management
Enterprise
Management
Enterprise
Paraphrase This Document
Need a fresh take? Get an instant paraphrase of this document with our AI Paraphraser
Table of Contents
INTRODUCTION...........................................................................................................................3
MAIN BODY...................................................................................................................................3
TASK 1. Complete vertical, horizontal and ratio analysis of the financial statements of chosen
companies....................................................................................................................................3
Task 2.Evaluation of the Working Capital...............................................................................11
Task 3. Evaluation of the Cash Flow........................................................................................12
CONCLUSION..............................................................................................................................13
REFERENCES..............................................................................................................................14
APPENDIX....................................................................................................................................15
.......................................................................................................................................................26
INTRODUCTION
The term financial analysis can be defined as a way of analysing monetary aspect of
business entities for a particular time frame. In order to do an effective financial analysis, various
kinds of financial statements are interpreted such as income statement, balance sheet and many
more (Morden, 2016). Basically, there are different types of techniques of doing financial
analysis such as vertical analysis, horizontal analysis, ratio analysis and many more. The aim of
project report to do a detailed financial analysis of given enterprises. The project report is based
on two companies which are Farsons and Heiniken. Under the project report four years financial
statements are assessed in order to evaluate about efficiency of both of companies. The Farsons
company operates its business and activities in beverage sector. They produce a wide range of
beers and soft drinks. The company is headquartered in Malta and it was founded in year 1928.
The another company, Heiniken is also involved in process of beer manufacturing and located in
Netherlands.
MAIN BODY
TASK 1. Complete vertical, horizontal and ratio analysis of the financial statements of chosen
companies.
Vertical analysis: This can be defined as a type of financial statement analysis technique in
which every item is presented as a percentage of base amount in various statements (Yinping,
2015). It is also known by common size analysis. In order to convert elements of different
elements to do vertical analysis, there is a particular formula which is as follows :
Vertical analysis formula (Income statement) = Item of income statement / Total sales * 100.
Vertical analysis formula (Balance sheet) = Item of balance sheet / Total sales * 100.
In the context of above mentioned both of companies, there vertical analysis is done below in
such manner :
Heiniken:
Income Statement:
On the basis of produced income statement of Heiniken Plc, this can be find out that all
the elements of this statement are based on total value of sales. Their income statement presents
that the value of gross profit was increasing during year of 2015 to 2017. Though, in year 2018,
⊘ This is a preview!⊘
Do you want full access?
Subscribe today to unlock all pages.
Trusted by 1+ million students worldwide
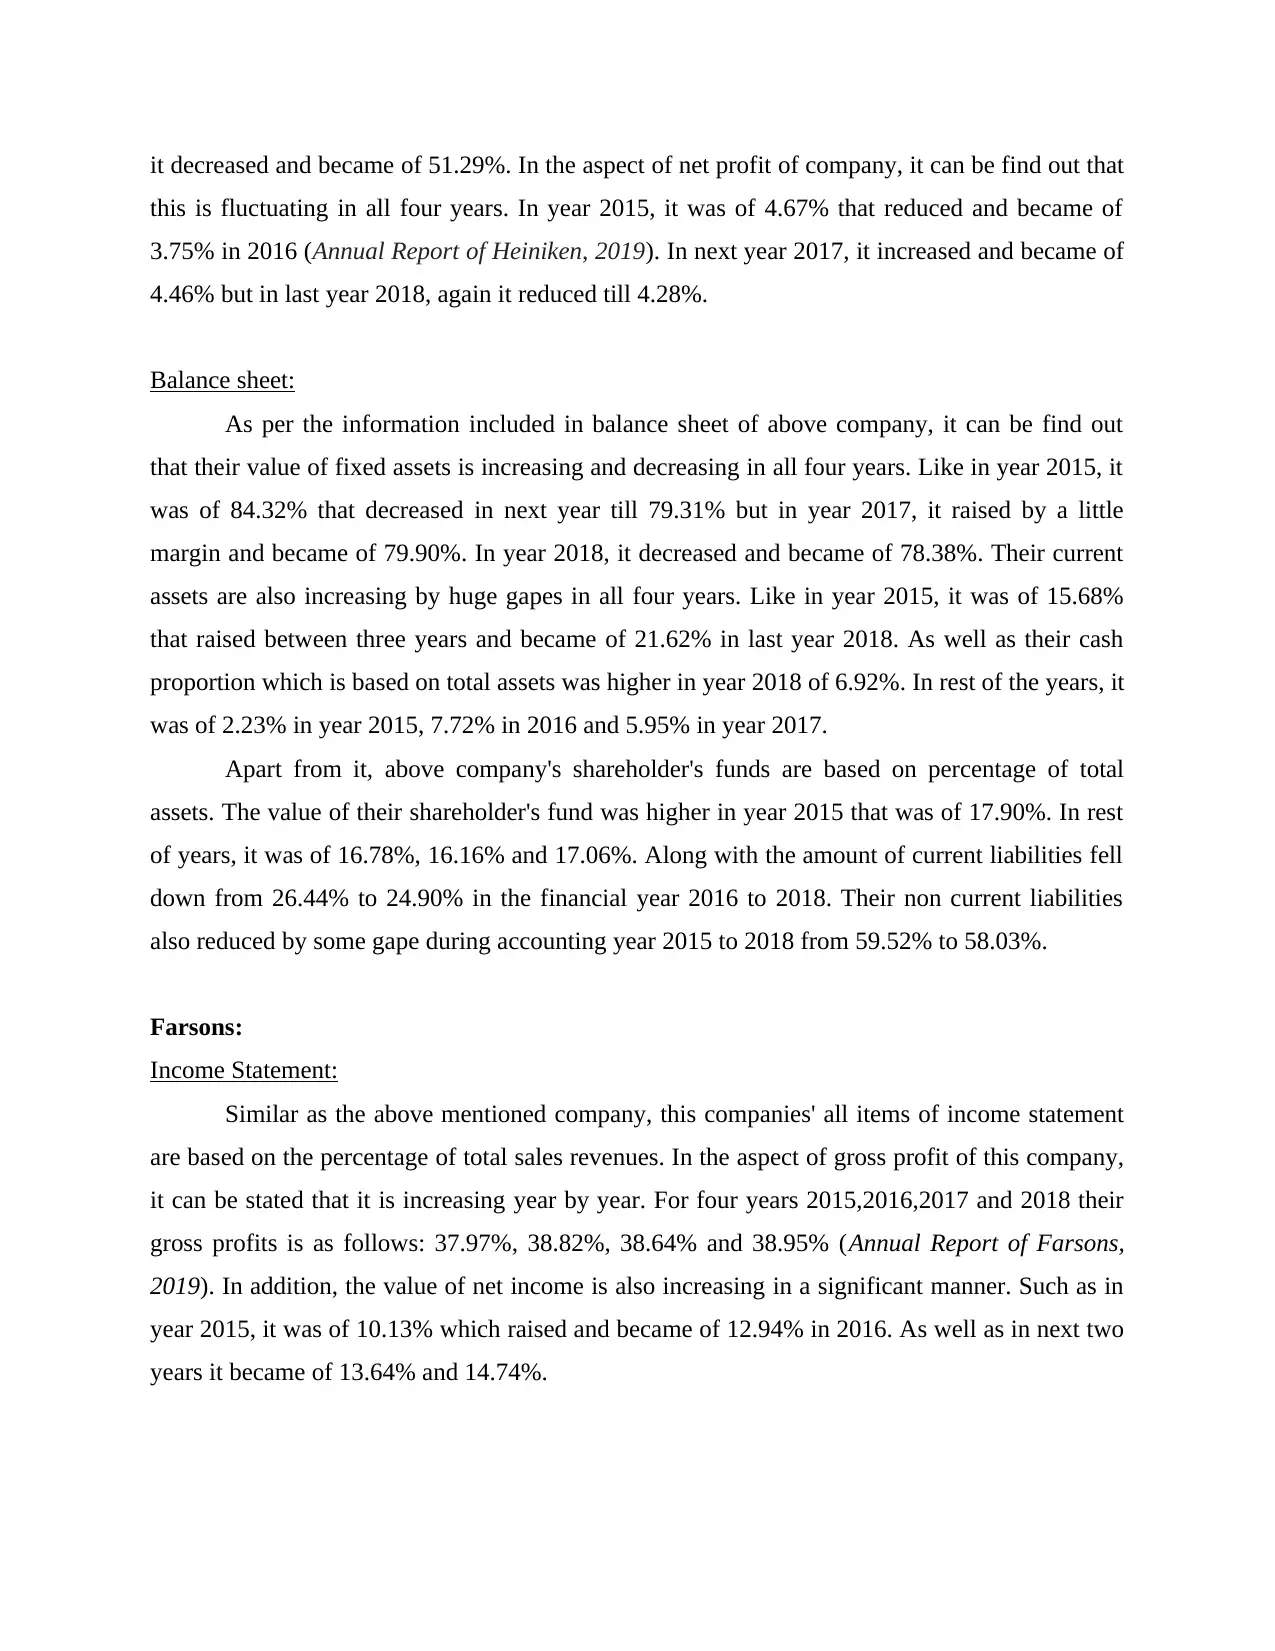
it decreased and became of 51.29%. In the aspect of net profit of company, it can be find out that
this is fluctuating in all four years. In year 2015, it was of 4.67% that reduced and became of
3.75% in 2016 (Annual Report of Heiniken, 2019). In next year 2017, it increased and became of
4.46% but in last year 2018, again it reduced till 4.28%.
Balance sheet:
As per the information included in balance sheet of above company, it can be find out
that their value of fixed assets is increasing and decreasing in all four years. Like in year 2015, it
was of 84.32% that decreased in next year till 79.31% but in year 2017, it raised by a little
margin and became of 79.90%. In year 2018, it decreased and became of 78.38%. Their current
assets are also increasing by huge gapes in all four years. Like in year 2015, it was of 15.68%
that raised between three years and became of 21.62% in last year 2018. As well as their cash
proportion which is based on total assets was higher in year 2018 of 6.92%. In rest of the years, it
was of 2.23% in year 2015, 7.72% in 2016 and 5.95% in year 2017.
Apart from it, above company's shareholder's funds are based on percentage of total
assets. The value of their shareholder's fund was higher in year 2015 that was of 17.90%. In rest
of years, it was of 16.78%, 16.16% and 17.06%. Along with the amount of current liabilities fell
down from 26.44% to 24.90% in the financial year 2016 to 2018. Their non current liabilities
also reduced by some gape during accounting year 2015 to 2018 from 59.52% to 58.03%.
Farsons:
Income Statement:
Similar as the above mentioned company, this companies' all items of income statement
are based on the percentage of total sales revenues. In the aspect of gross profit of this company,
it can be stated that it is increasing year by year. For four years 2015,2016,2017 and 2018 their
gross profits is as follows: 37.97%, 38.82%, 38.64% and 38.95% (Annual Report of Farsons,
2019). In addition, the value of net income is also increasing in a significant manner. Such as in
year 2015, it was of 10.13% which raised and became of 12.94% in 2016. As well as in next two
years it became of 13.64% and 14.74%.
Paraphrase This Document
Need a fresh take? Get an instant paraphrase of this document with our AI Paraphraser
Balance sheet:
All the items of balance sheet are based on the total value of assets. Such as their
shareholder's equity was of 67.11% in year 2015 which fluctuated in next three years. In year
2016, it reduced and became of 66.87% but in year 2017, it raised and became of 67.21. While in
last year 2018, it decreased by huge gape till 59.88%. In addition, the amount of total liabilities
increased year by year. Starting from 2015, it was of 20.37% that raised continuously and
became of 32.79% in 2016, 32.52% in year 2017 and ended with 32.89% in year 2018.
In addition, the value of non current assets are also fluctuating such as in year 2015, it
was of 78.52% that raised and became of 79.14% as well as in next year, it increased till 81.42%.
In last year 2018, it minimized and became of 77.16%. Their value of total assets are as: 21.48%,
20.25%, 18.58% and 22.22% for year 2015,2016,2017 and 2018 respectively.
Horizontal Analysis: It is also known as Trend analysis. This can be defined as a type of
financial-statements analysis technique in which variation in the value of different elements of
financial is presented for a particular time period. In this kinds of analyzing technique, financial
statements of two or more then two years are taken to make a proper comparison. In the aspect of
above mentioned both of companies, the horizontal analysis is done below in such manner:
Heiniken:
Income Statement:
On the basis of horizontal analysis of income statement of this company, it can be find
out that variation in total sales revenue is raised in year 2017 till 5.27% that decreased in next
year and became of 2.66% in 2018. In addition, the gross profit of this company also decreased
by 2.08% in year 2018 and in year 2017, there was higher increased in variation of 6.04%. In the
aspect of net profit of company, it can be find out that it decreased in year 2018 from 1.64% and
in year 2017, it raised from 25.42%.
Balance sheet:
On the basis of balance sheet of company, it can be find out that the value of
shareholder's funds is increased by 7.91% in year 2018. Though, during year 2016-17, it was of -
2.25% and 0.53%. In the context of non current liabilities of this company, it can be find out that
in year 2017 it increased by 7.24% and in year 2018, it raised by just 1.69%. Their current
liabilities were increased during year 2016-17 from 22.09% and 0.59%. While in year 2018, it
reduced by -0.08%.
In the context of cash funds of this company, it can be find out that in year 2018, it
increased by 18.88% but in year 2017, there was decreasing in its value by 19.54%. While in
year 2016, it was raised by huge margin of 268.33%. Their current assets were raised from
37.59%, 1.36% and 9.97% in year 2016, 2017 and 2018 respectively. On the other hand, value of
non current assets raised by just 0.31% in year 2018. As well as their non current assets were
decreased from 1.94% in financial year 2016.
Farsons:
Income Statement:
As per the analysis of income statement of this company, it can be find out that it is
raised from 7.95% in year 2016. While in year 2017-18, its increasing value was of 3.53% and
7.59%. Along with the value of gross-profit also increased from 8.82% in year 2018, though in
year 2016, 2017 its increasing was of 10% and 3.03%. The net profit of company raised as:
37.50%, 9.09% and 16.67% throughout year 2016, 2017 and 2018.
Balance sheet:
As per the balance sheet of above company, it can be find out that shareholder's funds
decreased from 9% in year 2016 and 12.84% in year 2017. While in year 2018, it fell down from
21.14%. In addition, their non current liabilities raised by 8.16%, 13.21% and 11.67% for year
2016, 2017 and 2018. In the aspect of current liabilities, it can be find out that it increased by
33.33% in year 2018 and it remain unchanged in year 2017. As well as their total assets
decreased by 11.48% in year 2018 and in year 2016 & 2017, it raised by 12.27% and 9.40%. In
addition, the fixed assets decreased by 16.11% in year 2018 while in last years, it raised from
15.50% and 10.26% in year 2016 and 2017. Their current assets also raised from 5.88%, 3.03%
and 3.13% for year 2018, 2017 and 2016.
Ratio analysis- It can be defined as a type financial analysis technique which is based on
completely calculation and analysis of ratios for a particular time period (Vogel, 2014). In this
technique, a wide range of ratios are included such as profitability ratio, efficiency ratio and
⊘ This is a preview!⊘
Do you want full access?
Subscribe today to unlock all pages.
Trusted by 1+ million students worldwide
many more. The main objective of this analysis technique is to assessing companies strength and
weakness of different kinds of aspects. In the aspect of above mentioned Farsons and Heiniken
companies, ratio analysis is done below that is as follows:
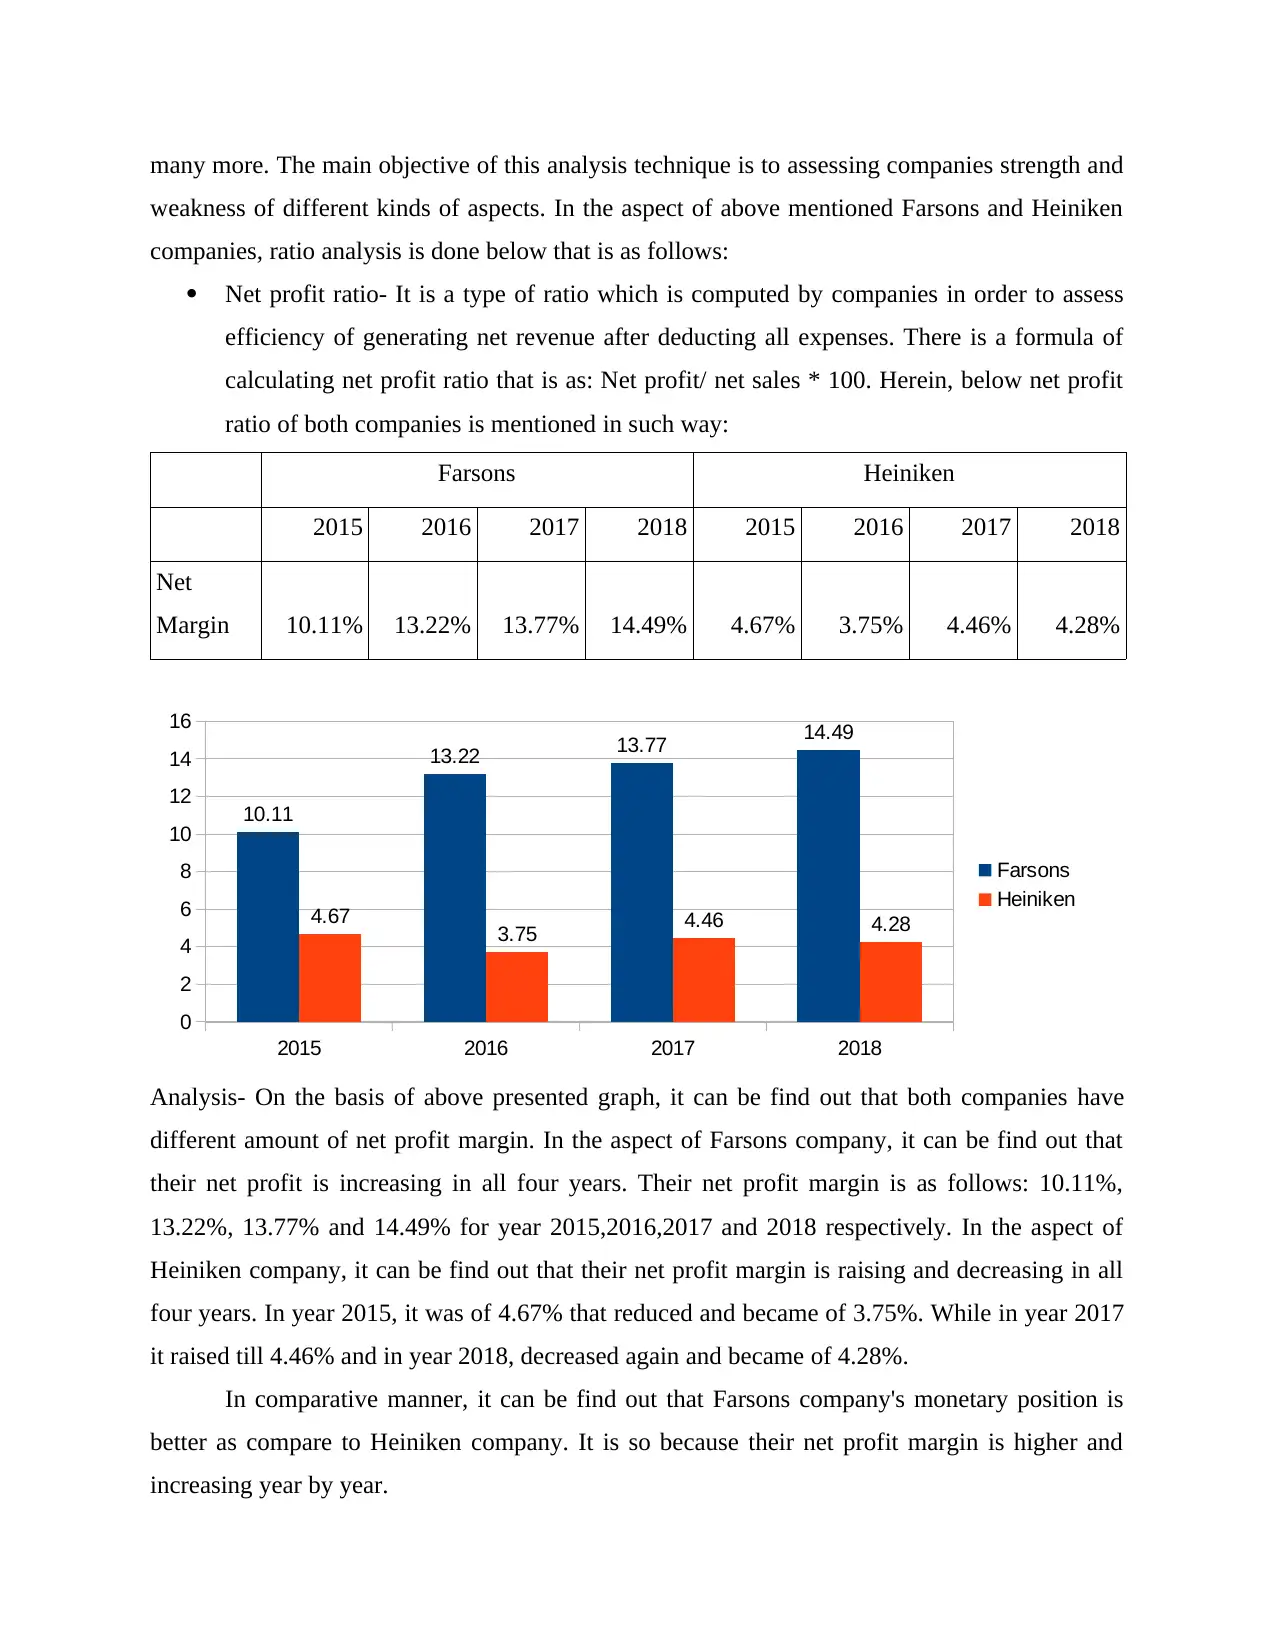
Net profit ratio- It is a type of ratio which is computed by companies in order to assess
efficiency of generating net revenue after deducting all expenses. There is a formula of
calculating net profit ratio that is as: Net profit/ net sales * 100. Herein, below net profit
ratio of both companies is mentioned in such way:
Farsons Heiniken
2015 2016 2017 2018 2015 2016 2017 2018
Net
Margin 10.11% 13.22% 13.77% 14.49% 4.67% 3.75% 4.46% 4.28%
2015 2016 2017 2018
0
2
4
6
8
10
12
14
16
10.11
13.22 13.77 14.49
4.67 3.75 4.46 4.28
Farsons
Heiniken
Analysis- On the basis of above presented graph, it can be find out that both companies have
different amount of net profit margin. In the aspect of Farsons company, it can be find out that
their net profit is increasing in all four years. Their net profit margin is as follows: 10.11%,
13.22%, 13.77% and 14.49% for year 2015,2016,2017 and 2018 respectively. In the aspect of
Heiniken company, it can be find out that their net profit margin is raising and decreasing in all
four years. In year 2015, it was of 4.67% that reduced and became of 3.75%. While in year 2017
it raised till 4.46% and in year 2018, decreased again and became of 4.28%.
In comparative manner, it can be find out that Farsons company's monetary position is
better as compare to Heiniken company. It is so because their net profit margin is higher and
increasing year by year.
weakness of different kinds of aspects. In the aspect of above mentioned Farsons and Heiniken
companies, ratio analysis is done below that is as follows:
Net profit ratio- It is a type of ratio which is computed by companies in order to assess
efficiency of generating net revenue after deducting all expenses. There is a formula of
calculating net profit ratio that is as: Net profit/ net sales * 100. Herein, below net profit
ratio of both companies is mentioned in such way:
Farsons Heiniken
2015 2016 2017 2018 2015 2016 2017 2018
Net
Margin 10.11% 13.22% 13.77% 14.49% 4.67% 3.75% 4.46% 4.28%
2015 2016 2017 2018
0
2
4
6
8
10
12
14
16
10.11
13.22 13.77 14.49
4.67 3.75 4.46 4.28
Farsons
Heiniken
Analysis- On the basis of above presented graph, it can be find out that both companies have
different amount of net profit margin. In the aspect of Farsons company, it can be find out that
their net profit is increasing in all four years. Their net profit margin is as follows: 10.11%,
13.22%, 13.77% and 14.49% for year 2015,2016,2017 and 2018 respectively. In the aspect of
Heiniken company, it can be find out that their net profit margin is raising and decreasing in all
four years. In year 2015, it was of 4.67% that reduced and became of 3.75%. While in year 2017
it raised till 4.46% and in year 2018, decreased again and became of 4.28%.
In comparative manner, it can be find out that Farsons company's monetary position is
better as compare to Heiniken company. It is so because their net profit margin is higher and
increasing year by year.
Paraphrase This Document
Need a fresh take? Get an instant paraphrase of this document with our AI Paraphraser
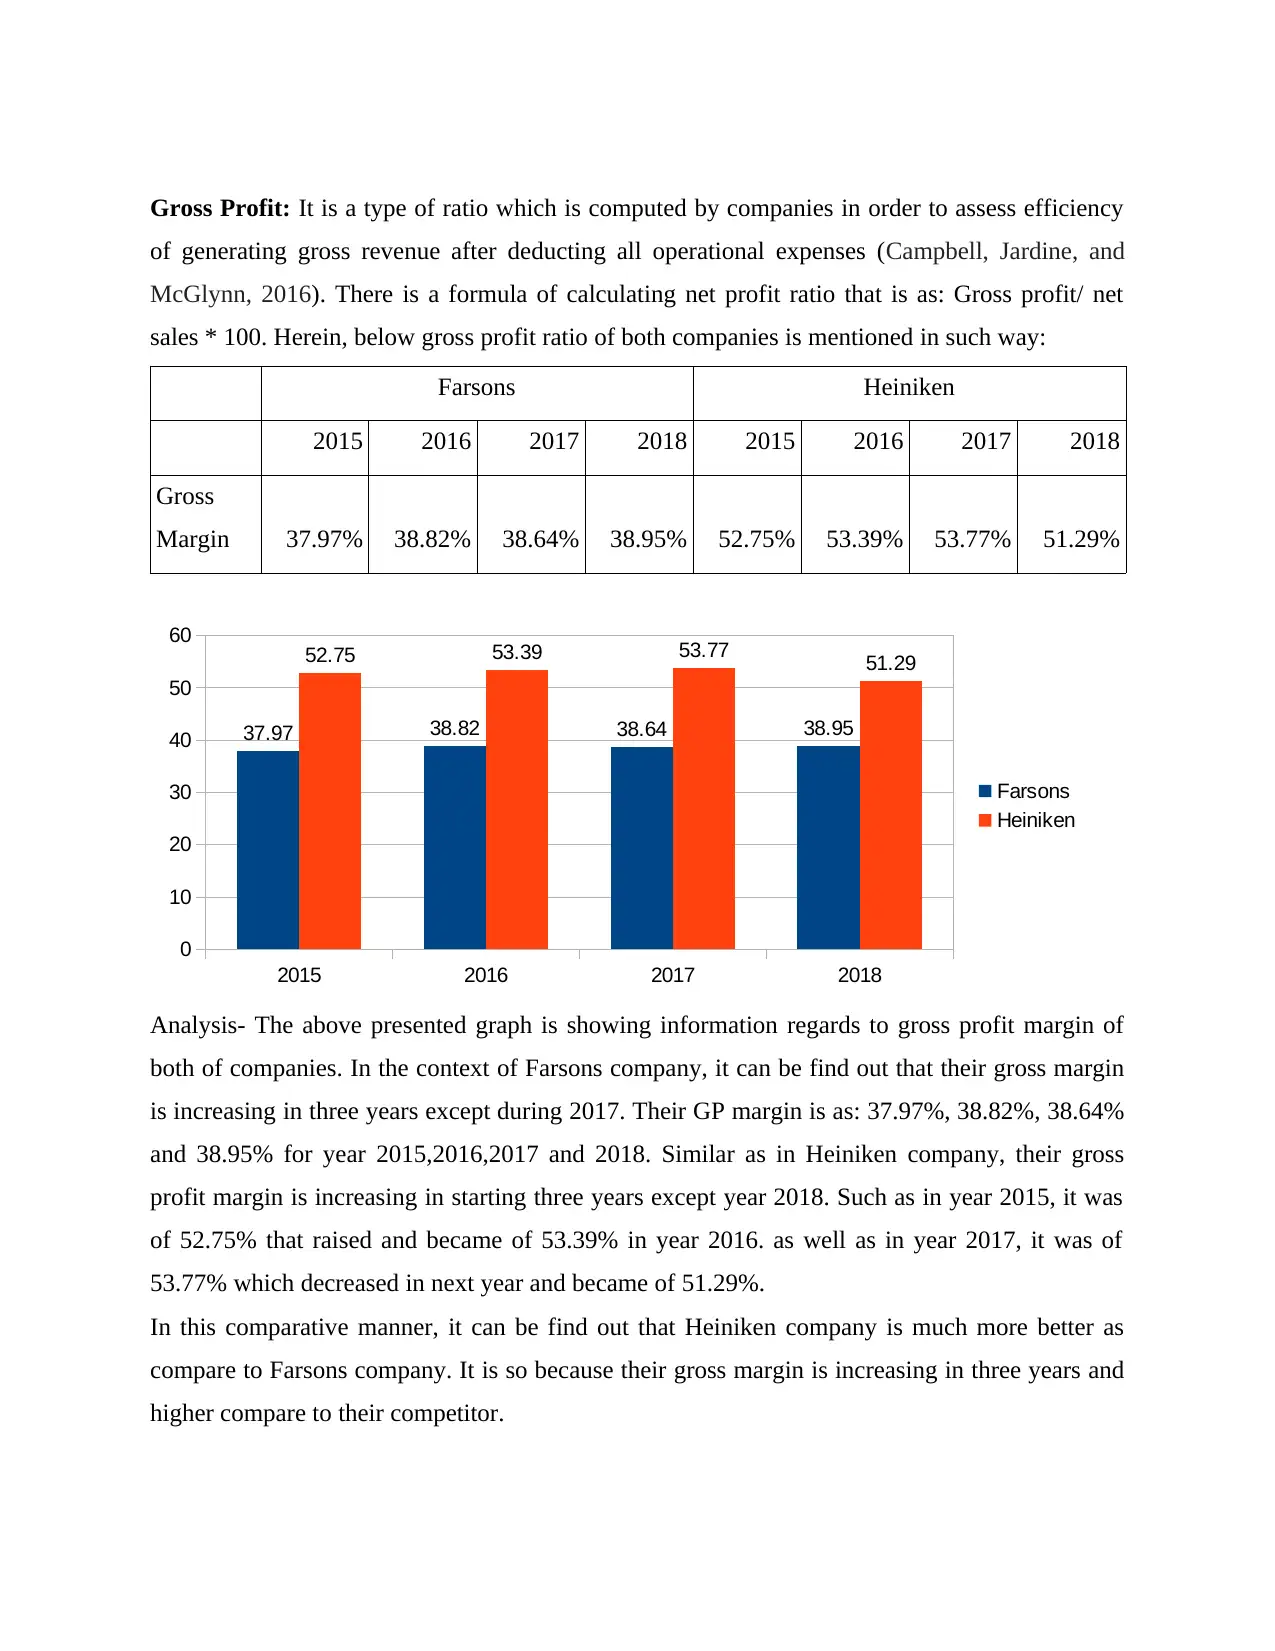
Gross Profit: It is a type of ratio which is computed by companies in order to assess efficiency
of generating gross revenue after deducting all operational expenses (Campbell, Jardine, and
McGlynn, 2016). There is a formula of calculating net profit ratio that is as: Gross profit/ net
sales * 100. Herein, below gross profit ratio of both companies is mentioned in such way:
Farsons Heiniken
2015 2016 2017 2018 2015 2016 2017 2018
Gross
Margin 37.97% 38.82% 38.64% 38.95% 52.75% 53.39% 53.77% 51.29%
2015 2016 2017 2018
0
10
20
30
40
50
60
37.97 38.82 38.64 38.95
52.75 53.39 53.77 51.29
Farsons
Heiniken
Analysis- The above presented graph is showing information regards to gross profit margin of
both of companies. In the context of Farsons company, it can be find out that their gross margin
is increasing in three years except during 2017. Their GP margin is as: 37.97%, 38.82%, 38.64%
and 38.95% for year 2015,2016,2017 and 2018. Similar as in Heiniken company, their gross
profit margin is increasing in starting three years except year 2018. Such as in year 2015, it was
of 52.75% that raised and became of 53.39% in year 2016. as well as in year 2017, it was of
53.77% which decreased in next year and became of 51.29%.
In this comparative manner, it can be find out that Heiniken company is much more better as
compare to Farsons company. It is so because their gross margin is increasing in three years and
higher compare to their competitor.
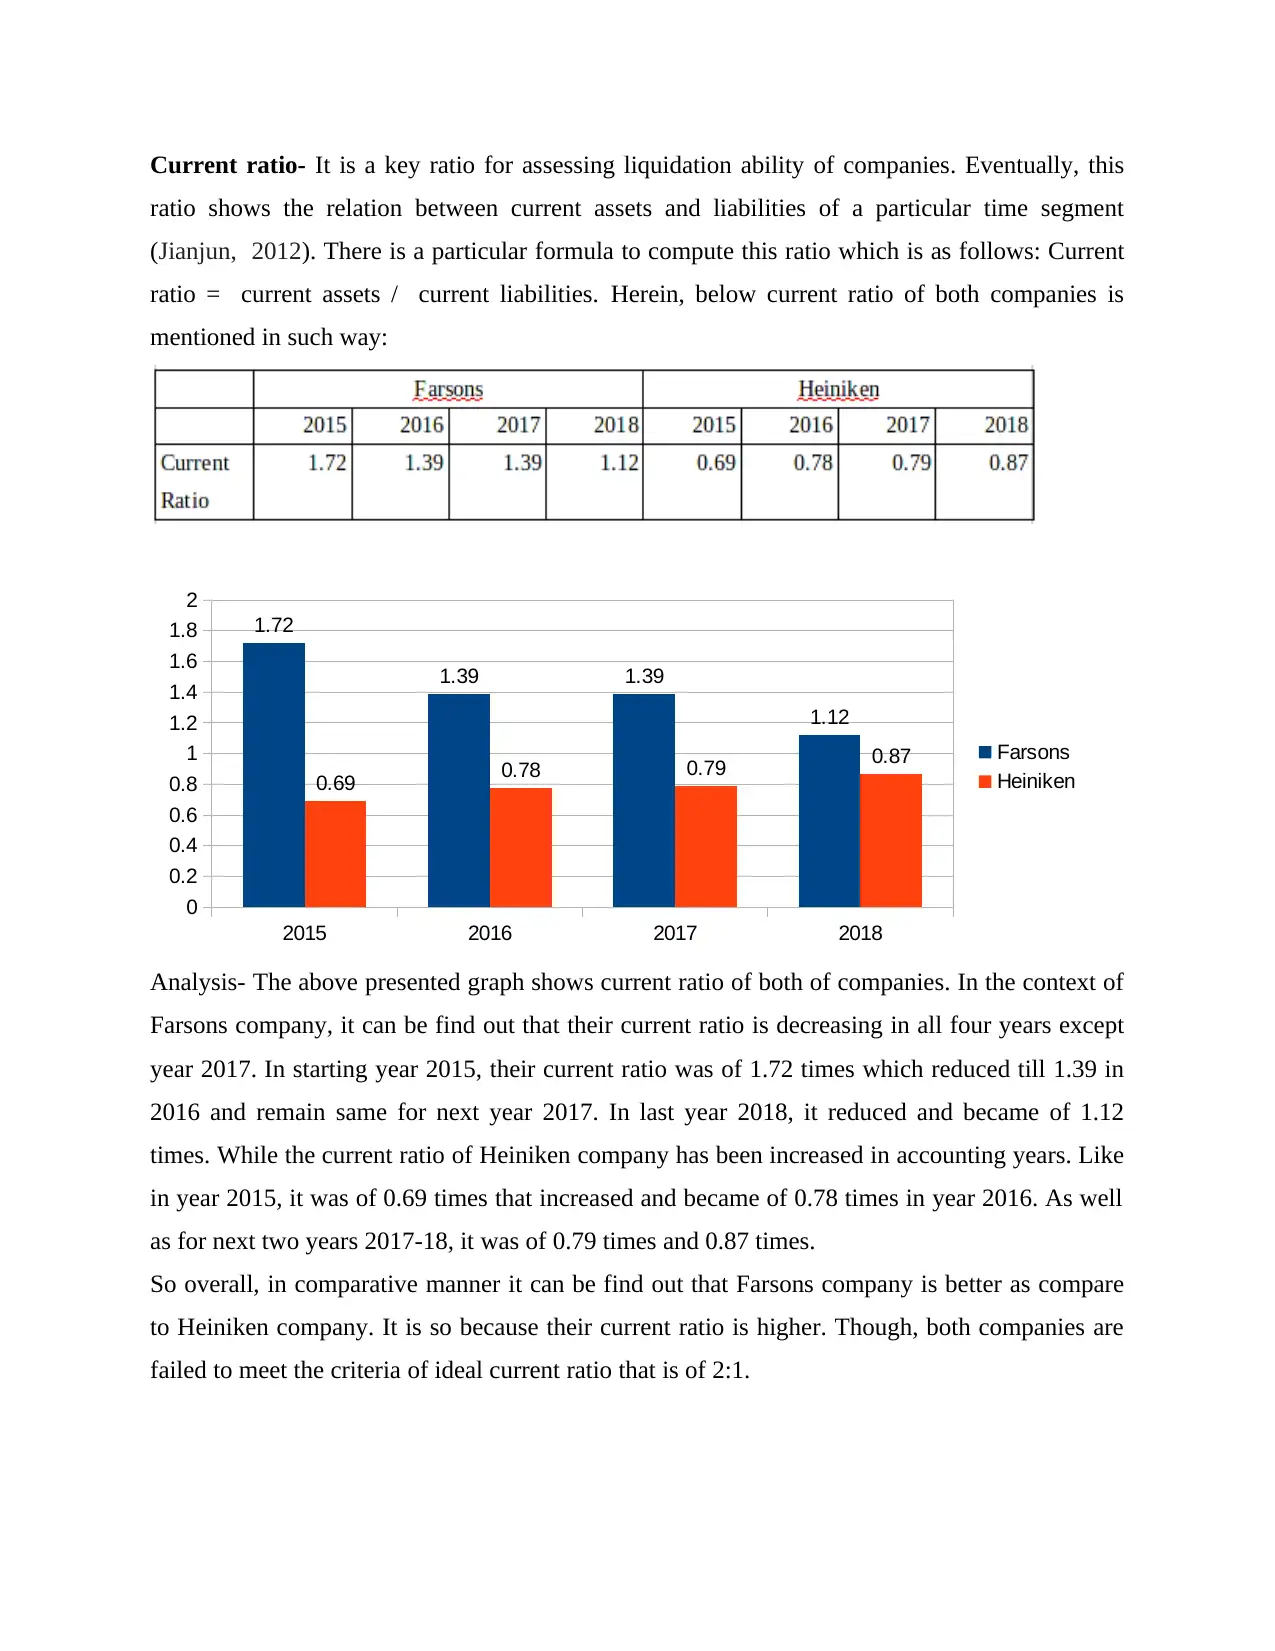
Current ratio- It is a key ratio for assessing liquidation ability of companies. Eventually, this
ratio shows the relation between current assets and liabilities of a particular time segment
(Jianjun, 2012). There is a particular formula to compute this ratio which is as follows: Current
ratio = current assets / current liabilities. Herein, below current ratio of both companies is
mentioned in such way:
2015 2016 2017 2018
0
0.2
0.4
0.6
0.8
1
1.2
1.4
1.6
1.8
2
1.72
1.39 1.39
1.12
0.69 0.78 0.79 0.87 Farsons
Heiniken
Analysis- The above presented graph shows current ratio of both of companies. In the context of
Farsons company, it can be find out that their current ratio is decreasing in all four years except
year 2017. In starting year 2015, their current ratio was of 1.72 times which reduced till 1.39 in
2016 and remain same for next year 2017. In last year 2018, it reduced and became of 1.12
times. While the current ratio of Heiniken company has been increased in accounting years. Like
in year 2015, it was of 0.69 times that increased and became of 0.78 times in year 2016. As well
as for next two years 2017-18, it was of 0.79 times and 0.87 times.
So overall, in comparative manner it can be find out that Farsons company is better as compare
to Heiniken company. It is so because their current ratio is higher. Though, both companies are
failed to meet the criteria of ideal current ratio that is of 2:1.
⊘ This is a preview!⊘
Do you want full access?
Subscribe today to unlock all pages.
Trusted by 1+ million students worldwide
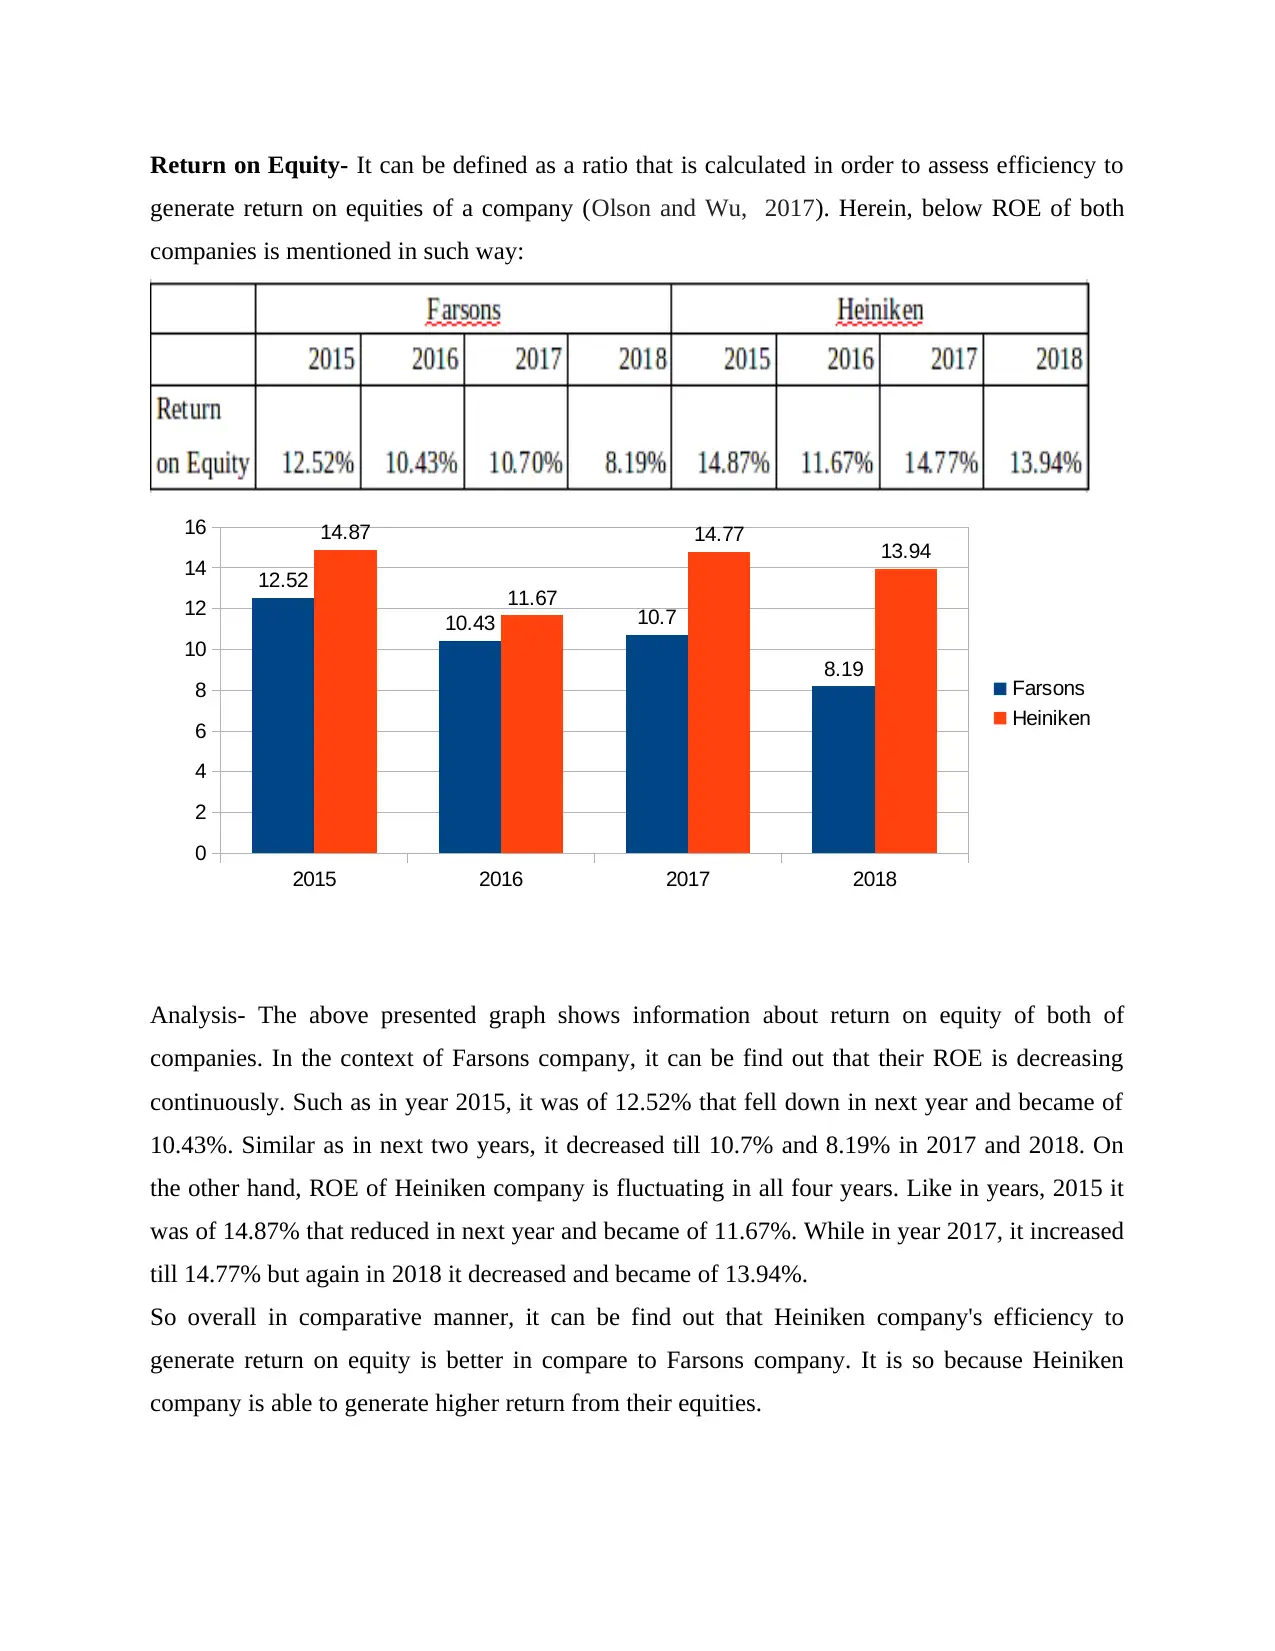
Return on Equity- It can be defined as a ratio that is calculated in order to assess efficiency to
generate return on equities of a company (Olson and Wu, 2017). Herein, below ROE of both
companies is mentioned in such way:
Analysis- The above presented graph shows information about return on equity of both of
companies. In the context of Farsons company, it can be find out that their ROE is decreasing
continuously. Such as in year 2015, it was of 12.52% that fell down in next year and became of
10.43%. Similar as in next two years, it decreased till 10.7% and 8.19% in 2017 and 2018. On
the other hand, ROE of Heiniken company is fluctuating in all four years. Like in years, 2015 it
was of 14.87% that reduced in next year and became of 11.67%. While in year 2017, it increased
till 14.77% but again in 2018 it decreased and became of 13.94%.
So overall in comparative manner, it can be find out that Heiniken company's efficiency to
generate return on equity is better in compare to Farsons company. It is so because Heiniken
company is able to generate higher return from their equities.
2015 2016 2017 2018
0
2
4
6
8
10
12
14
16
12.52
10.43 10.7
8.19
14.87
11.67
14.77 13.94
Farsons
Heiniken
Paraphrase This Document
Need a fresh take? Get an instant paraphrase of this document with our AI Paraphraser
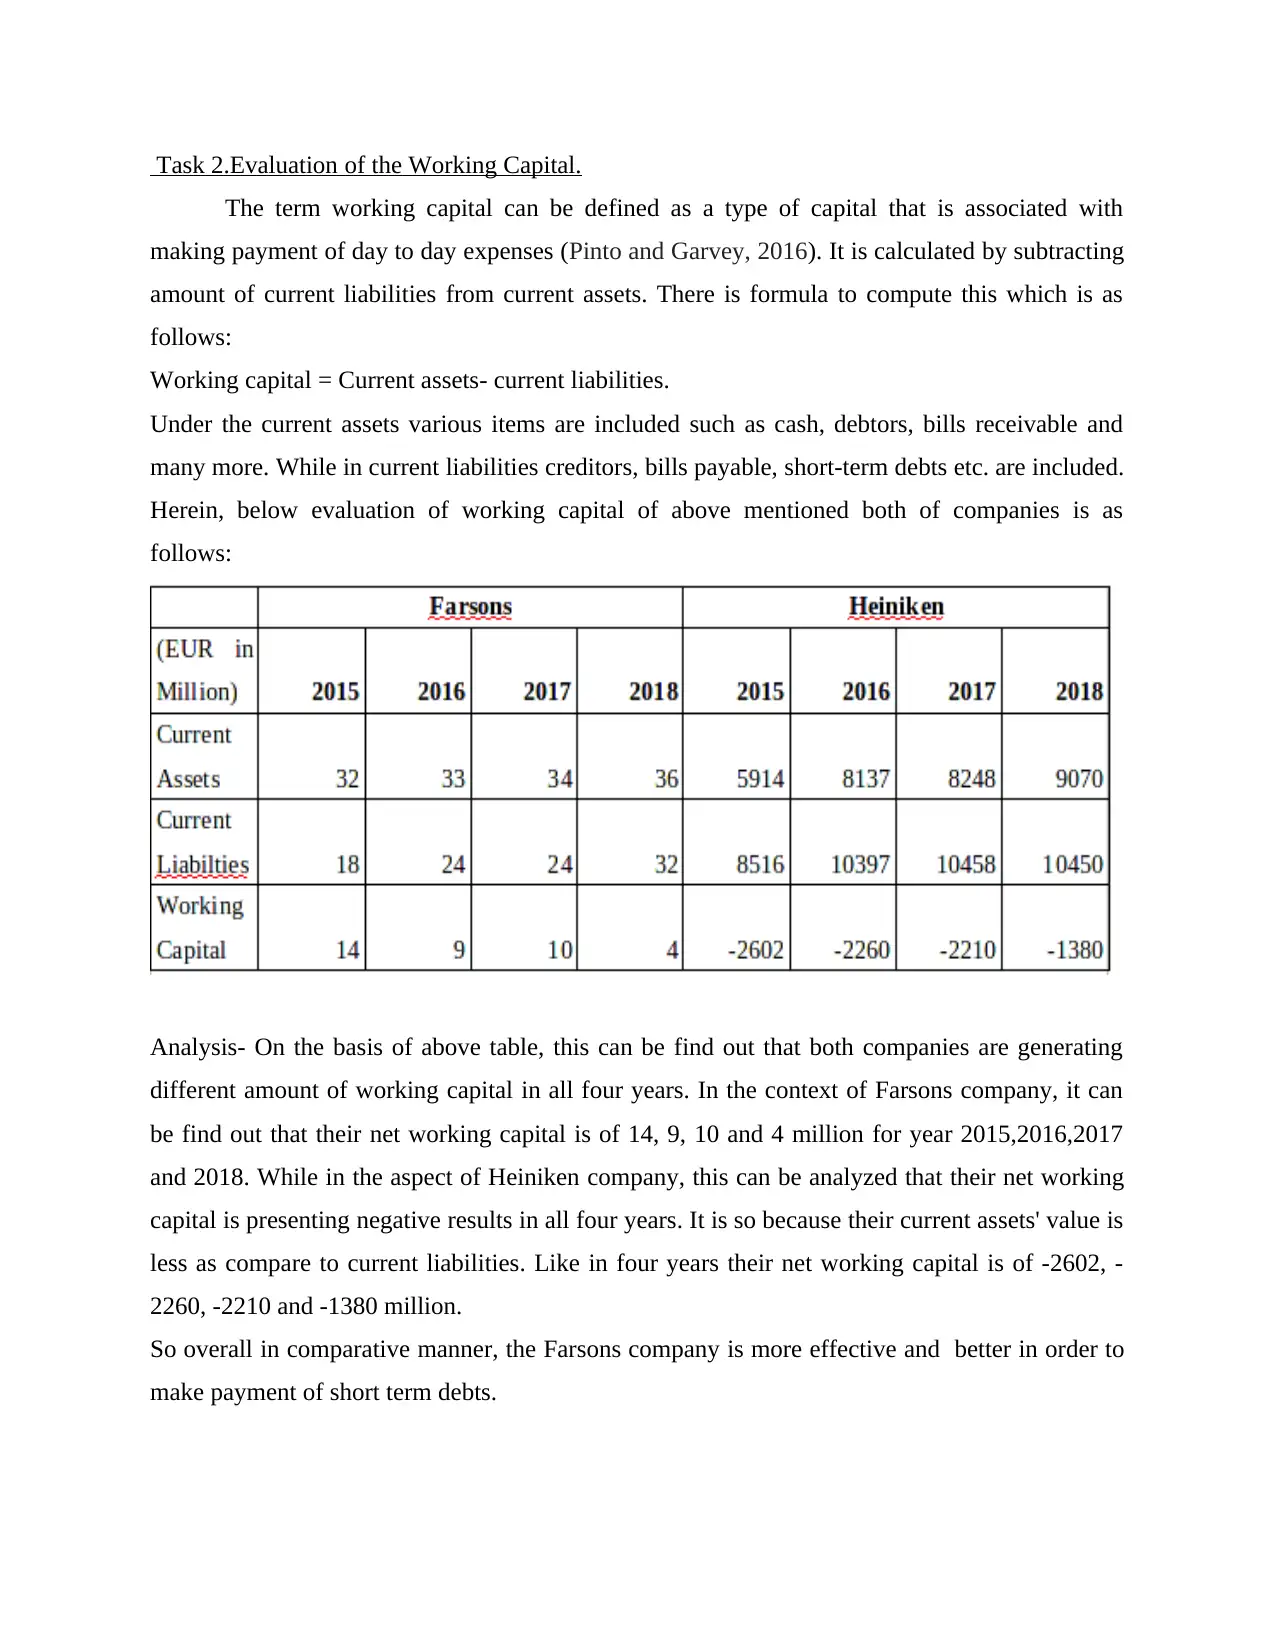
Task 2.Evaluation of the Working Capital.
The term working capital can be defined as a type of capital that is associated with
making payment of day to day expenses (Pinto and Garvey, 2016). It is calculated by subtracting
amount of current liabilities from current assets. There is formula to compute this which is as
follows:
Working capital = Current assets- current liabilities.
Under the current assets various items are included such as cash, debtors, bills receivable and
many more. While in current liabilities creditors, bills payable, short-term debts etc. are included.
Herein, below evaluation of working capital of above mentioned both of companies is as
follows:
Analysis- On the basis of above table, this can be find out that both companies are generating
different amount of working capital in all four years. In the context of Farsons company, it can
be find out that their net working capital is of 14, 9, 10 and 4 million for year 2015,2016,2017
and 2018. While in the aspect of Heiniken company, this can be analyzed that their net working
capital is presenting negative results in all four years. It is so because their current assets' value is
less as compare to current liabilities. Like in four years their net working capital is of -2602, -
2260, -2210 and -1380 million.
So overall in comparative manner, the Farsons company is more effective and better in order to
make payment of short term debts.
Task 3. Evaluation of the Cash Flow.
The term cash flow can be defined as flow of cash in a business entity during a particular
time period (Elgharbawy and Abdel-Kade, 2013). In order to assess cash flow, companies
produce cash flow statement that consists information about cash receipts and payments. This
statement is prepared by three activities which are operating, financing and investing activities. If
cash receipts are more then cash payments then there will be cash inflow. In the aspect of both of
companies, cash flow analysis is done below in such manner:
Heiniken: In the aspect of this company, it can be find out that their cash flow from operating
activities is increasing throughout the four years. Such as in year 2015, it was of 3489 million,
that raised and became of 3718 million in year 2016. Same as in next two years it increased and
became of 3882 and 4388 million. In addition, there is cash outflow of 2064 million, 2,007
million, 2965 million and 2355 million from investing activities. On the other hand, in the
context of financing activities there is outflow of cash that is of 1,173 million, 672 million, 966
million and 967 million for same time period. In addition their free cash flow is of 1,759 million,
1,852 million, 2,049 million and 2,333 million for above mentioned time period. Thus, it can be
stated that above company's financial position is better in order to have more cash receipts.
Farsons: On the basis of above mentioned cash flow of this company, it can be find out that
their cash flow from operating activities is of 16 million, 16 million, 13 million and 21 million in
year 2015, 2016, 2017 and 2018. On the other hand, there is outflow of cash from investing
activities that is of 7 million, 18 million, 20 million and 21 million during year 2015, 2016, 2017
and 2018. As well as cash flow from financing activities is of -4 million, -2 million, 4 million
and -1 million in 2015,2016,2017 and 2018 while their free cash-flows are 9 million, -1 million, -
6 million and 7 million during same period.
In the comparative manner, it can be find out that Heiniken company's cash flow is better
compare to Farsons company. It is so because they are able to generate positive cash flows from
all three activities.
CONCLUSION
On the basis of above project report, it can be concluded that financial analysis is
important for companies in order to do proper evaluation. The project report concludes about
⊘ This is a preview!⊘
Do you want full access?
Subscribe today to unlock all pages.
Trusted by 1+ million students worldwide
1 out of 36
Related Documents


Your All-in-One AI-Powered Toolkit for Academic Success.
+13062052269
info@desklib.com
Available 24*7 on WhatsApp / Email
![[object Object]](/_next/static/media/star-bottom.7253800d.svg)
Unlock your academic potential
Copyright © 2020–2026 A2Z Services. All Rights Reserved. Developed and managed by ZUCOL.