Accounting and Finance Report: APN Outdoor Group Financial Analysis
VerifiedAdded on 2020/04/01
|11
|2693
|31
Report
AI Summary
This report provides a detailed financial analysis of APN Outdoor Group, an ASX-listed outdoor advertising company. It examines the company's capital structure, including a comparison of its bonds with government bonds and an analysis of its debt and equity components. The report calculates the weighted average cost of capital (WACC) and compares APN's capital structure with that of Investa Office Funds. Furthermore, it analyzes key financial ratios, including profitability, liquidity, leverage, and asset turnover ratios, to evaluate the company's wealth maximization strategies over the past three years. The report also discusses the importance of minimizing the cost of capital and recommends strategies for APN Outdoor Group to lower its cost of capital, such as managing interest rates, capital structure policy, tax rates, and investment policy. The analysis concludes with insights into the company's financial performance and recommendations for future financial strategies.
Running head: ACCOUNTING AND FINANCE
ACCOUNTING AND FINANCE
ACCOUNTING AND FINANCE
Paraphrase This Document
Need a fresh take? Get an instant paraphrase of this document with our AI Paraphraser
ACCOUNTING AND FINANCE 2
Executive summary
In this study, the researcher has made critical analysis on the financial performance of APN
Outdoor Group. The researcher has also demonstrated the capital structure of APN outdoor
group and its wealth maximization strategy, with the help of different financial instruments like
financial ratios and comparative analysis. However, the study does not end here, further analysis
on the cost of capital of the company also been done with the help of examples.
ACCOUNTING AND FINANCE 3
Table of contents
Introduction......................................................................................................................................4
Discussing the capital structure of APN Outdoor Group................................................................4
Critically analyzing the wealth maximization strategy of APN Outdoor Group.............................6
Conclusion.....................................................................................................................................10
References......................................................................................................................................12
⊘ This is a preview!⊘
Do you want full access?
Subscribe today to unlock all pages.
Trusted by 1+ million students worldwide
ACCOUNTING AND FINANCE 4
Introduction
APN Outdoor group Limited (APO) is one of the greatest outdoor advertising operator in
Australia and in New Zealand. It is an ASX listed company which offers many advertising
services. These advertising includes digital billboards, static roadside billboards, advertisement
of rails and advertisement of airport in Australia and New Zealand. This study aims to
demonstrate the capital structure of APN outdoor group and its wealth maximization strategy,
with the help of different financial instruments like financial ratios and comparative analysis.
The researchers have also aimed to recommend the company for lowering its cost of capital.
Discussing the capital structure of APN Outdoor Group
Every business raises funds for financing its projects. It may raise funds either internally or
externally. If a firm raises funds internally it may use reserves and surpluses, retained earnings or
it may have to sell its assets. However, if the company needs huge funds, it has to raise funds by
issuing either equity shares or preference shares. Moreover, it may also borrow funds from
financial institutions or banks (Hope & Myllylahti, 2013). Thus, the capital structure is said to be
the mixture of short-term and long-term debt or equity.
a) Comparing the bonds of the company with government bonds
According to Wayne Castle, the CFO of APN Outdoor Group, the bonds of the company
distributed in the market proved to be the beneficial factor for the business. The rate of the bonds
was low as compared to the government, but the return on such bonds were reasonable. Thus, in
the year 2014, the company sold bonds in large distribution. This not only helped the parent
company to grow their business, but it's subsidiaries like iOM Pty Ltd, has largely gained benefit
in promoting them in the international market. On the counterpart, government bonds took
dominating position since 2015, due to its low risk, regular income and easy to buy and sell
factor (www.quotes.wsj.com, 2017).
b) Categorizing and calculating current capital structure and after tax weighted average
cost of capital
From the annual report of 2016, it has been found that the company APN outdoor group limited
has taken more borrowings in the year 2016 for its current project. It has been found that
company has not raised its funds from internal sources but it has raised its funds from external
sources like borrowings of $ 102,677 from bank and issued equity shares to the public, which is
fully paid up (Becker & Ivashina, 2015). The structure of equity debts is described below.
Paraphrase This Document
Need a fresh take? Get an instant paraphrase of this document with our AI Paraphraser
ACCOUNTING AND FINANCE 5
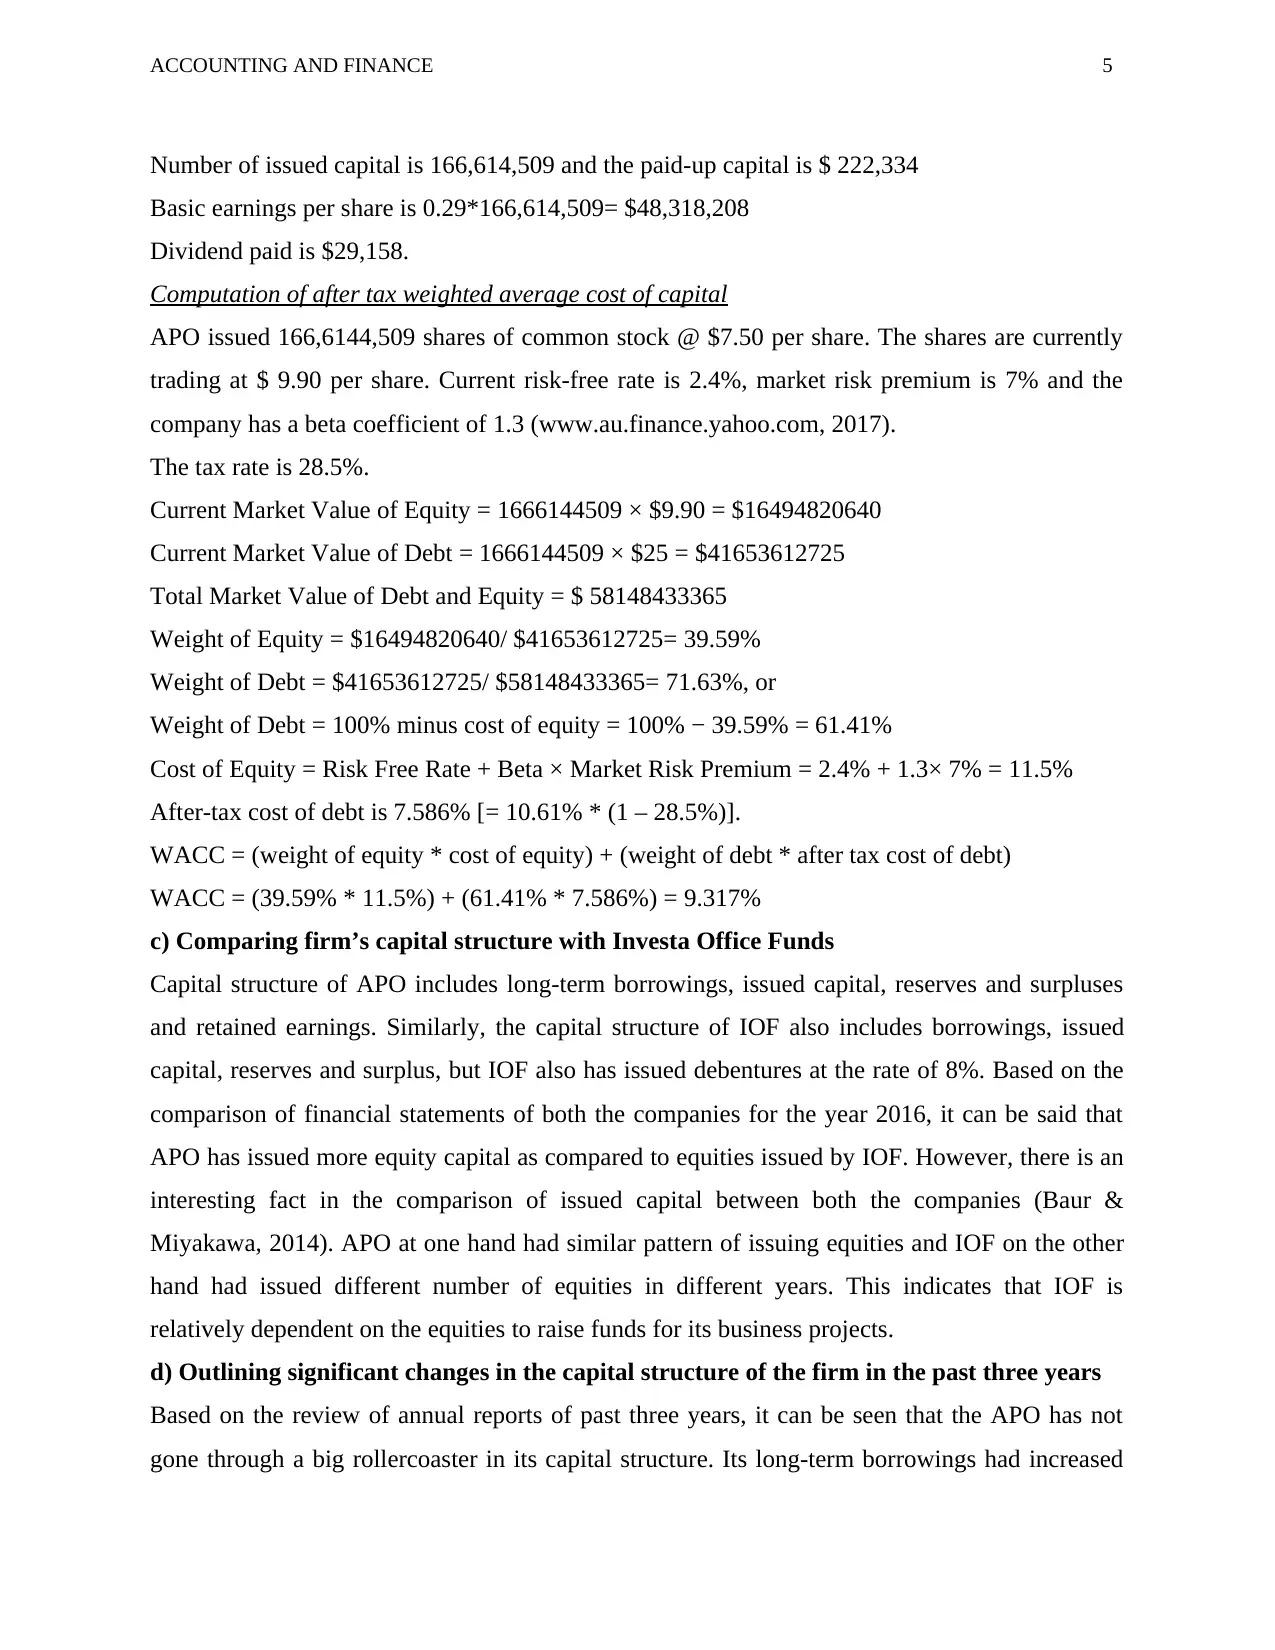
Number of issued capital is 166,614,509 and the paid-up capital is $ 222,334
Basic earnings per share is 0.29*166,614,509= $48,318,208
Dividend paid is $29,158.
Computation of after tax weighted average cost of capital
APO issued 166,6144,509 shares of common stock @ $7.50 per share. The shares are currently
trading at $ 9.90 per share. Current risk-free rate is 2.4%, market risk premium is 7% and the
company has a beta coefficient of 1.3 (www.au.finance.yahoo.com, 2017).
The tax rate is 28.5%.
Current Market Value of Equity = 1666144509 × $9.90 = $16494820640
Current Market Value of Debt = 1666144509 × $25 = $41653612725
Total Market Value of Debt and Equity = $ 58148433365
Weight of Equity = $16494820640/ $41653612725= 39.59%
Weight of Debt = $41653612725/ $58148433365= 71.63%, or
Weight of Debt = 100% minus cost of equity = 100% − 39.59% = 61.41%
Cost of Equity = Risk Free Rate + Beta × Market Risk Premium = 2.4% + 1.3× 7% = 11.5%
After-tax cost of debt is 7.586% [= 10.61% * (1 – 28.5%)].
WACC = (weight of equity * cost of equity) + (weight of debt * after tax cost of debt)
WACC = (39.59% * 11.5%) + (61.41% * 7.586%) = 9.317%
c) Comparing firm’s capital structure with Investa Office Funds
Capital structure of APO includes long-term borrowings, issued capital, reserves and surpluses
and retained earnings. Similarly, the capital structure of IOF also includes borrowings, issued
capital, reserves and surplus, but IOF also has issued debentures at the rate of 8%. Based on the
comparison of financial statements of both the companies for the year 2016, it can be said that
APO has issued more equity capital as compared to equities issued by IOF. However, there is an
interesting fact in the comparison of issued capital between both the companies (Baur &
Miyakawa, 2014). APO at one hand had similar pattern of issuing equities and IOF on the other
hand had issued different number of equities in different years. This indicates that IOF is
relatively dependent on the equities to raise funds for its business projects.
d) Outlining significant changes in the capital structure of the firm in the past three years
Based on the review of annual reports of past three years, it can be seen that the APO has not
gone through a big rollercoaster in its capital structure. Its long-term borrowings had increased
ACCOUNTING AND FINANCE 6
over three years, but issued and paid up capital remained unchanged. In addition, retained
earnings had significantly rose in every consecutive year, along with the considerable rise in the
reserves and surpluses (Robb & Robinson, 2014). This indicates that the company is wisely
applying wealth maximization strategies. However, the most eye-catching change can be seen,
the company had paid dividend in the year 2016 amounted to $ 29,158, which is more than twice
of previous year that is $ 9,164.
Critically analyzing the wealth maximization strategy of APN Outdoor Group
In every business shareholder value maximization plays a pivotal role in creating profit.
Therefore, wealth maximization balances the interest of shareholders and stakeholders.
Similarly, it becomes necessary to wisely chose the appropriate wealth maximization strategies.
Building credit, wisely investing, building wealth through retained earnings, and boosting stock
prices are the best ways to maximize wealth or shareholders value.
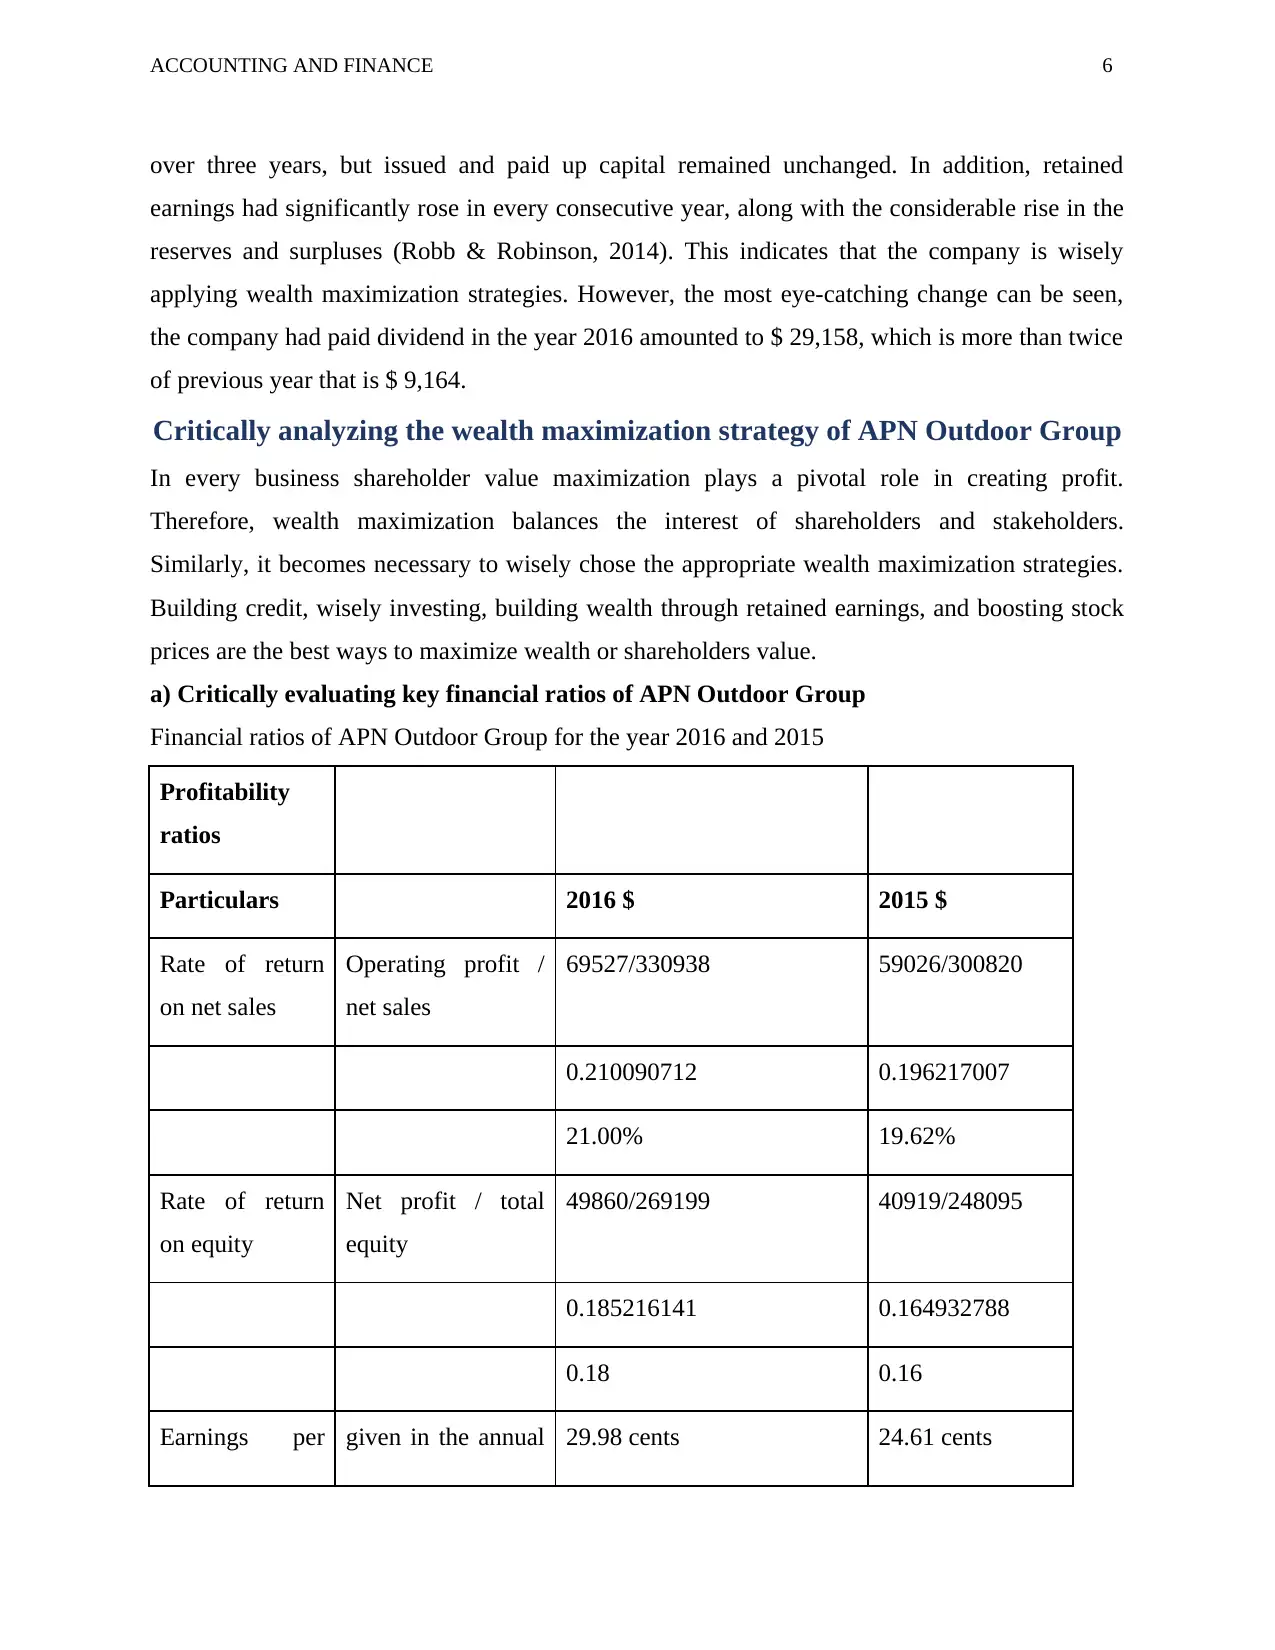
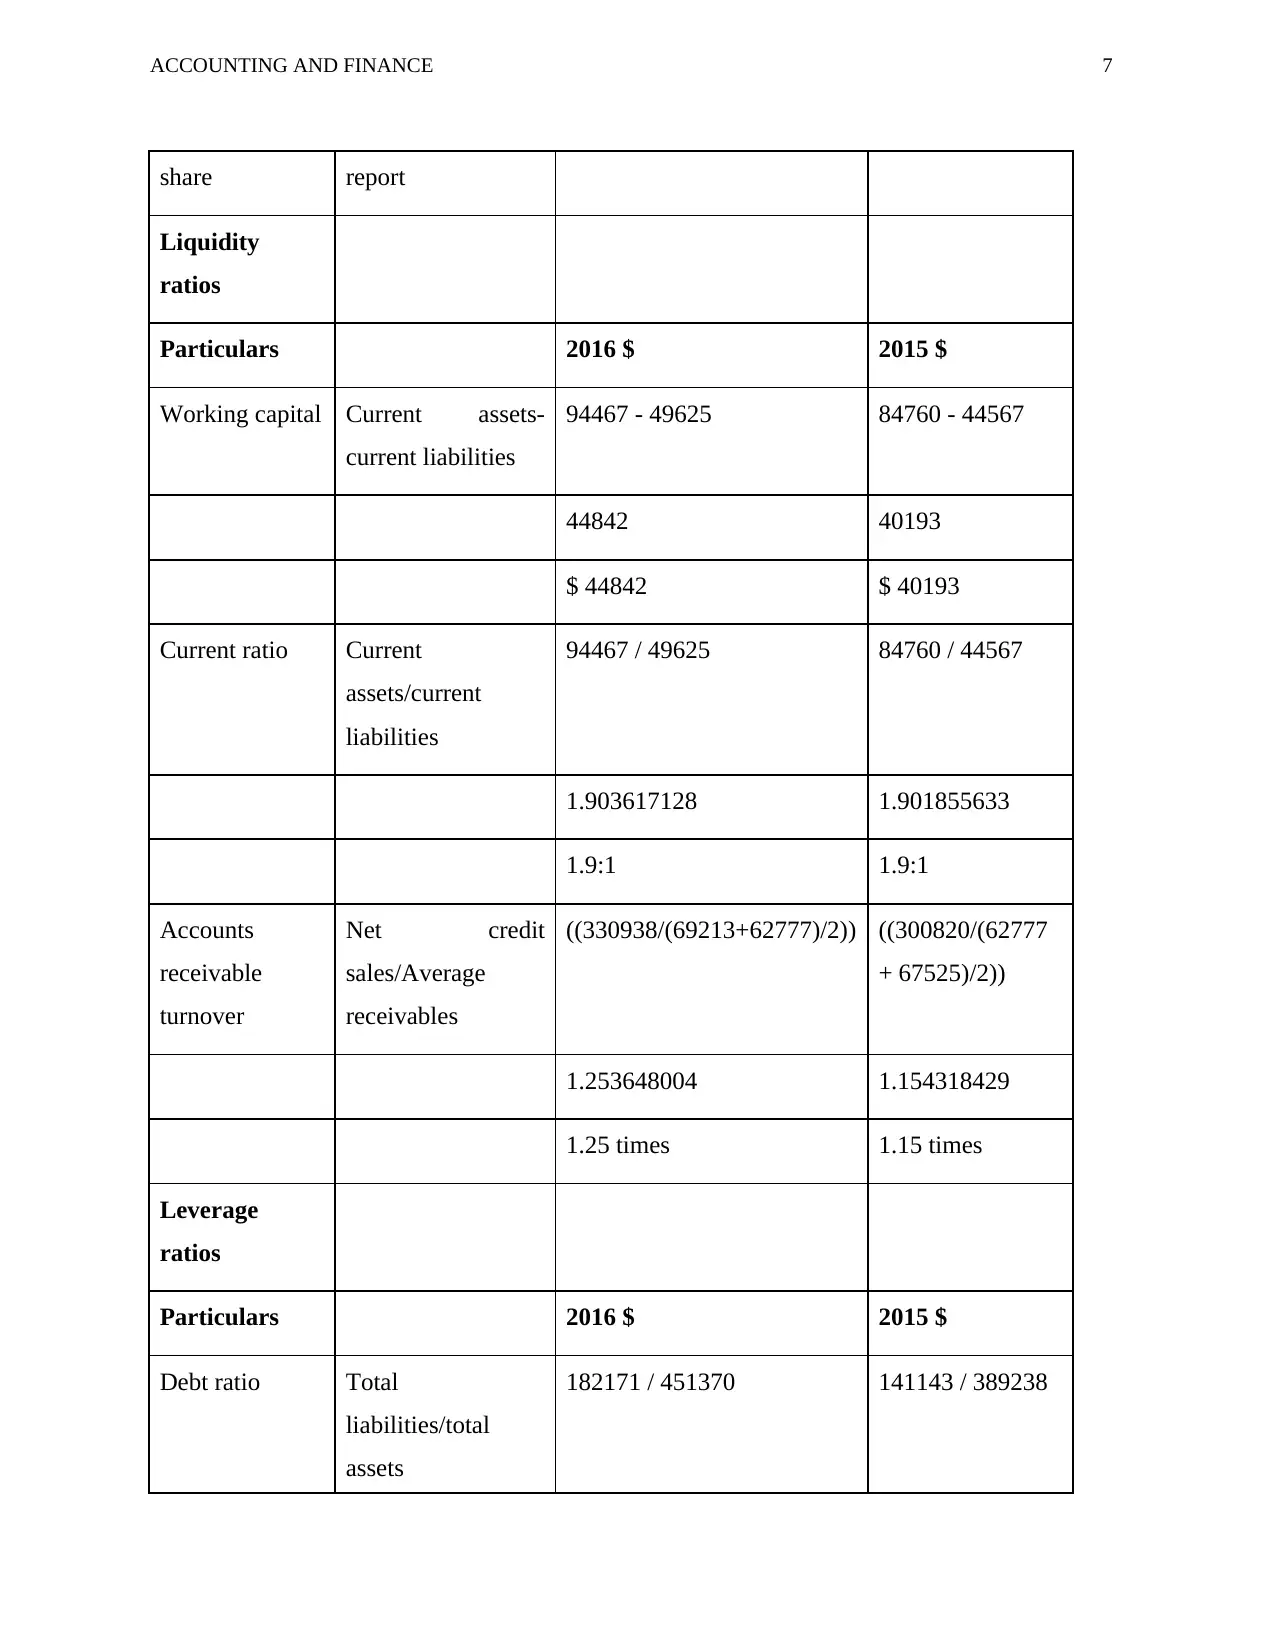
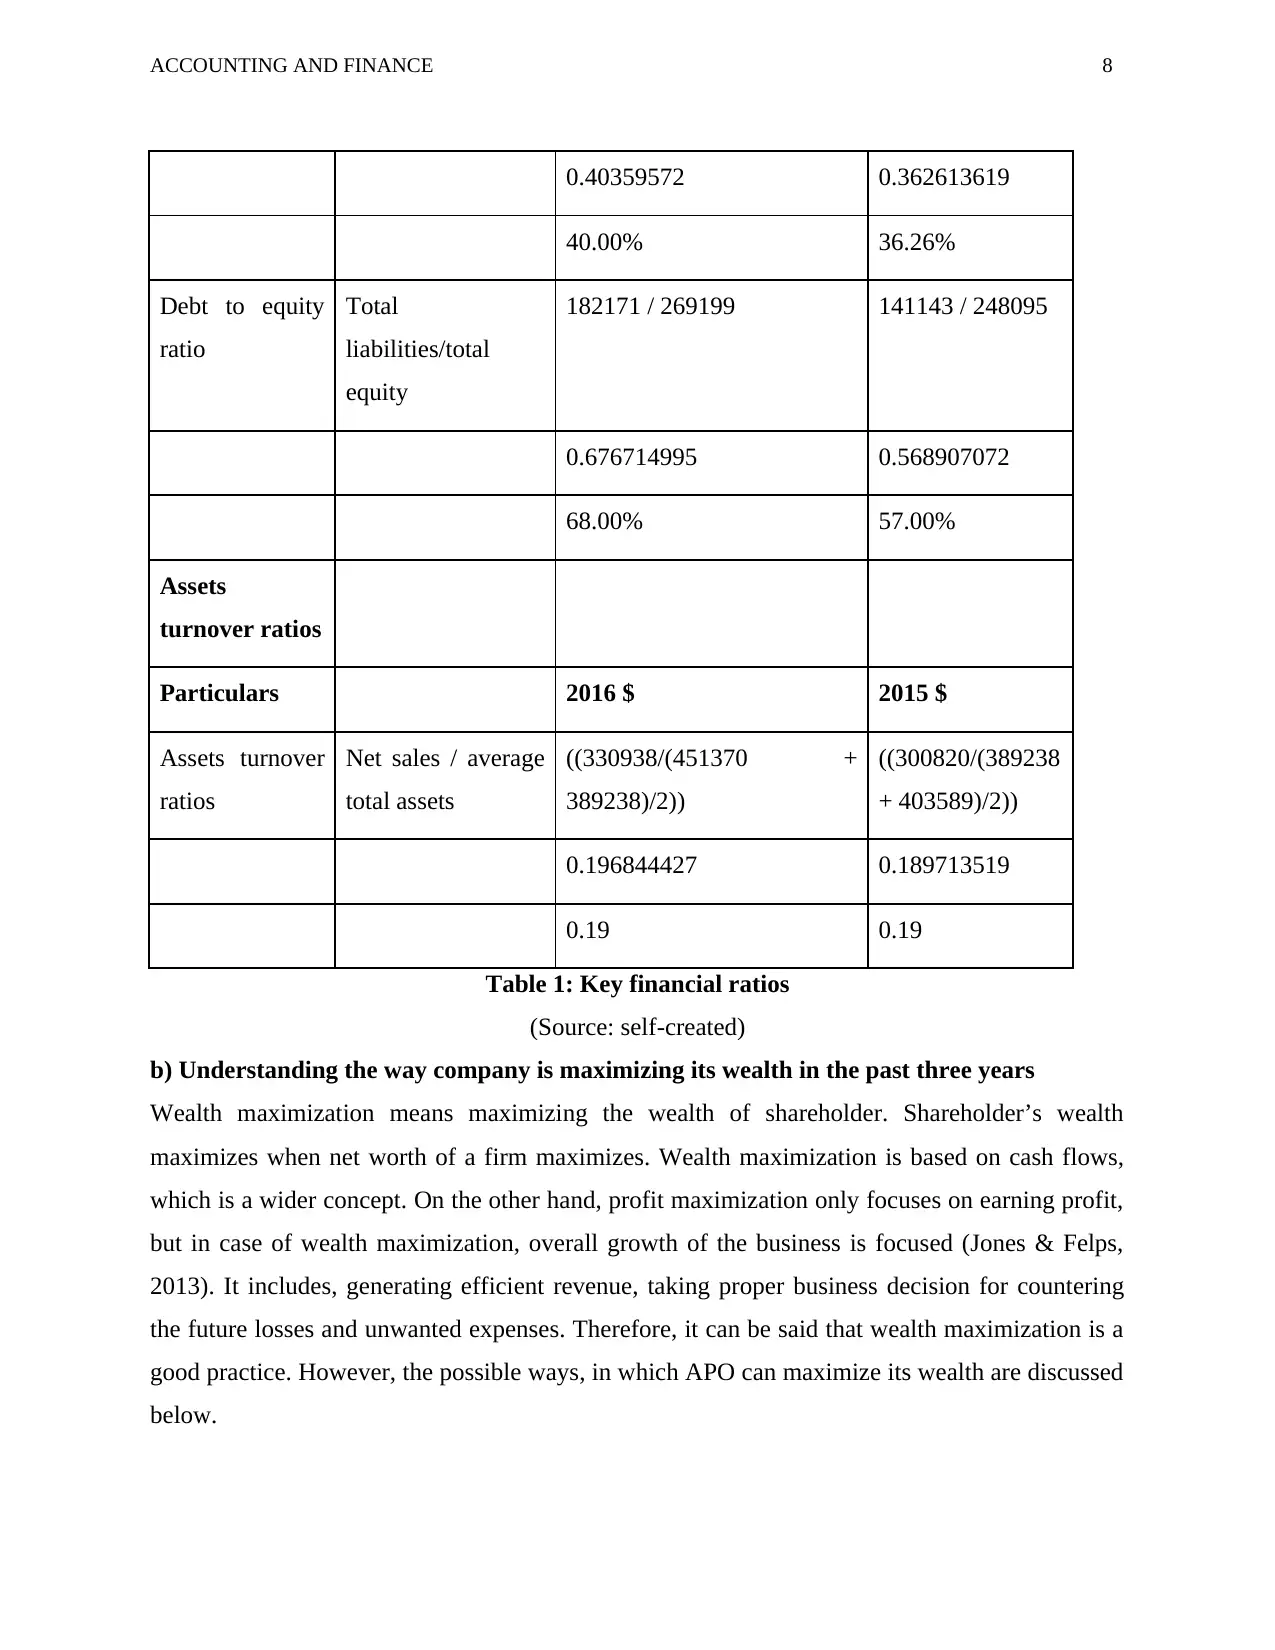
a) Critically evaluating key financial ratios of APN Outdoor Group
Financial ratios of APN Outdoor Group for the year 2016 and 2015
Profitability
ratios
Particulars 2016 $ 2015 $
Rate of return
on net sales
Operating profit /
net sales
69527/330938 59026/300820
0.210090712 0.196217007
21.00% 19.62%
Rate of return
on equity
Net profit / total
equity
49860/269199 40919/248095
0.185216141 0.164932788
0.18 0.16
Earnings per given in the annual 29.98 cents 24.61 cents
over three years, but issued and paid up capital remained unchanged. In addition, retained
earnings had significantly rose in every consecutive year, along with the considerable rise in the
reserves and surpluses (Robb & Robinson, 2014). This indicates that the company is wisely
applying wealth maximization strategies. However, the most eye-catching change can be seen,
the company had paid dividend in the year 2016 amounted to $ 29,158, which is more than twice
of previous year that is $ 9,164.
Critically analyzing the wealth maximization strategy of APN Outdoor Group
In every business shareholder value maximization plays a pivotal role in creating profit.
Therefore, wealth maximization balances the interest of shareholders and stakeholders.
Similarly, it becomes necessary to wisely chose the appropriate wealth maximization strategies.
Building credit, wisely investing, building wealth through retained earnings, and boosting stock
prices are the best ways to maximize wealth or shareholders value.
a) Critically evaluating key financial ratios of APN Outdoor Group
Financial ratios of APN Outdoor Group for the year 2016 and 2015
Profitability
ratios
Particulars 2016 $ 2015 $
Rate of return
on net sales
Operating profit /
net sales
69527/330938 59026/300820
0.210090712 0.196217007
21.00% 19.62%
Rate of return
on equity
Net profit / total
equity
49860/269199 40919/248095
0.185216141 0.164932788
0.18 0.16
Earnings per given in the annual 29.98 cents 24.61 cents
⊘ This is a preview!⊘
Do you want full access?
Subscribe today to unlock all pages.
Trusted by 1+ million students worldwide
ACCOUNTING AND FINANCE 7
share report
Liquidity
ratios
Particulars 2016 $ 2015 $
Working capital Current assets-
current liabilities
94467 - 49625 84760 - 44567
44842 40193
$ 44842 $ 40193
Current ratio Current
assets/current
liabilities
94467 / 49625 84760 / 44567
1.903617128 1.901855633
1.9:1 1.9:1
Accounts
receivable
turnover
Net credit
sales/Average
receivables
((330938/(69213+62777)/2)) ((300820/(62777
+ 67525)/2))
1.253648004 1.154318429
1.25 times 1.15 times
Leverage
ratios
Particulars 2016 $ 2015 $
Debt ratio Total
liabilities/total
assets
182171 / 451370 141143 / 389238
Paraphrase This Document
Need a fresh take? Get an instant paraphrase of this document with our AI Paraphraser
ACCOUNTING AND FINANCE 8
0.40359572 0.362613619
40.00% 36.26%
Debt to equity
ratio
Total
liabilities/total
equity
182171 / 269199 141143 / 248095
0.676714995 0.568907072
68.00% 57.00%
Assets
turnover ratios
Particulars 2016 $ 2015 $
Assets turnover
ratios
Net sales / average
total assets
((330938/(451370 +
389238)/2))
((300820/(389238
+ 403589)/2))
0.196844427 0.189713519
0.19 0.19
Table 1: Key financial ratios
(Source: self-created)
b) Understanding the way company is maximizing its wealth in the past three years
Wealth maximization means maximizing the wealth of shareholder. Shareholder’s wealth
maximizes when net worth of a firm maximizes. Wealth maximization is based on cash flows,
which is a wider concept. On the other hand, profit maximization only focuses on earning profit,
but in case of wealth maximization, overall growth of the business is focused (Jones & Felps,
2013). It includes, generating efficient revenue, taking proper business decision for countering
the future losses and unwanted expenses. Therefore, it can be said that wealth maximization is a
good practice. However, the possible ways, in which APO can maximize its wealth are discussed
below.
ACCOUNTING AND FINANCE 9
In this case, the company has generated huge revenue as compared to the previous year, which is
the first step of wealth maximization. The company APN outdoor group invested in a project and
get more internal rate of return and its net present value also increased, in this way shareholder’s
wealth increased (Grant, 2016). This company motivated its employee for the purpose of
maximizing its wealth.
The company’s total equity in the year 2016, 2015 and 2014 are $ 269,199, $ 248,095 and $
216274 respectively. However, total debt for the three consecutive years include borrowings,
amounted to $ 102,677, $ 65,926 and $ 85,121. On the other hand, issued and paid up capital
were remained unchanged. Thus, it can be said that the company is not completely dependent on
the raising funds from public. Whatever the funds required, it raises from borrowings.
c) Discussing the importance of minimizing cost of capital
Since cost of capital is that required of return, which is used for capital budgeting project, it
becomes important to minimize cost of capital, because high cost of capital will tend to increase
cost of capital budgeting like rise in cost of making plants, buildings, etc. (Dhaliwal et al. 2014).
However, lower cost of capital will allow only required cost of budgeting, unnecessary cost will
be abandoned. Thus, it is very important to minimize cost of capital. The importance is described
below.
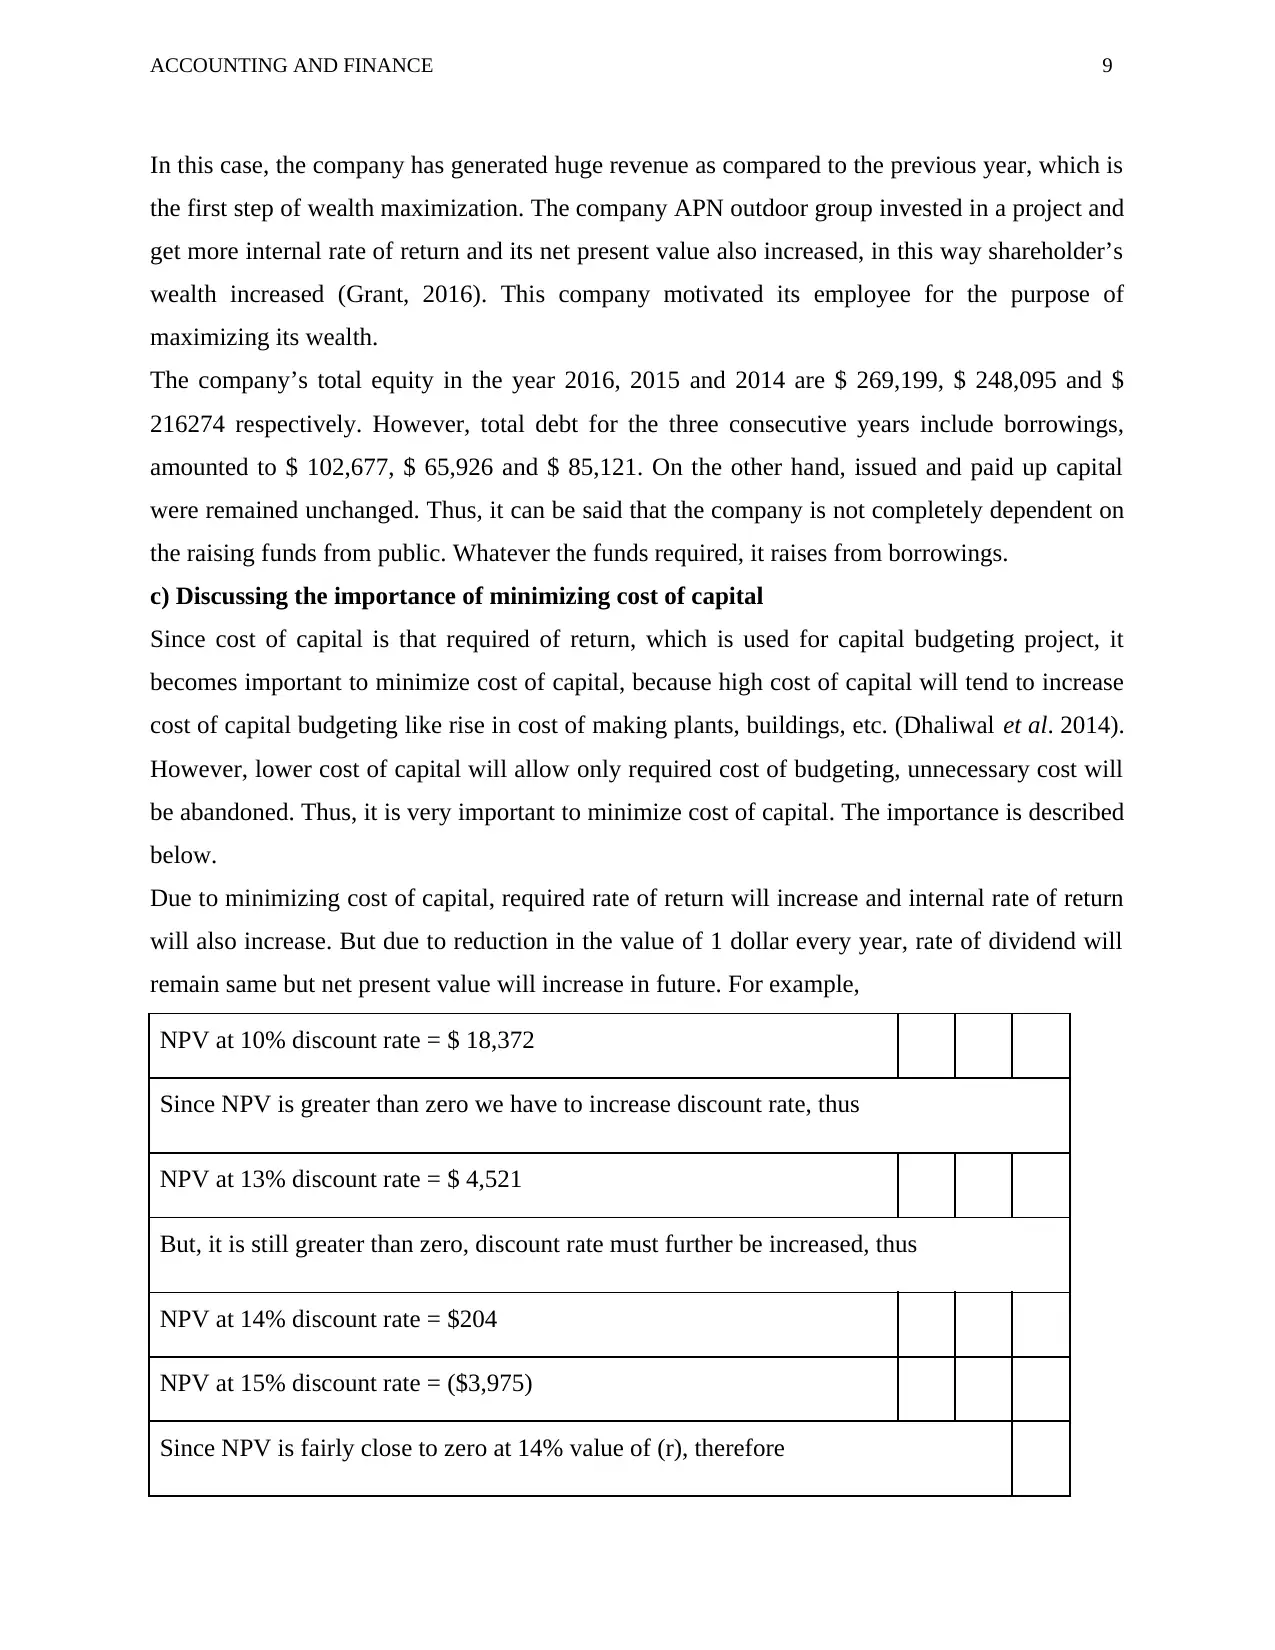
Due to minimizing cost of capital, required rate of return will increase and internal rate of return
will also increase. But due to reduction in the value of 1 dollar every year, rate of dividend will
remain same but net present value will increase in future. For example,
NPV at 10% discount rate = $ 18,372
Since NPV is greater than zero we have to increase discount rate, thus
NPV at 13% discount rate = $ 4,521
But, it is still greater than zero, discount rate must further be increased, thus
NPV at 14% discount rate = $204
NPV at 15% discount rate = ($3,975)
Since NPV is fairly close to zero at 14% value of (r), therefore
In this case, the company has generated huge revenue as compared to the previous year, which is
the first step of wealth maximization. The company APN outdoor group invested in a project and
get more internal rate of return and its net present value also increased, in this way shareholder’s
wealth increased (Grant, 2016). This company motivated its employee for the purpose of
maximizing its wealth.
The company’s total equity in the year 2016, 2015 and 2014 are $ 269,199, $ 248,095 and $
216274 respectively. However, total debt for the three consecutive years include borrowings,
amounted to $ 102,677, $ 65,926 and $ 85,121. On the other hand, issued and paid up capital
were remained unchanged. Thus, it can be said that the company is not completely dependent on
the raising funds from public. Whatever the funds required, it raises from borrowings.
c) Discussing the importance of minimizing cost of capital
Since cost of capital is that required of return, which is used for capital budgeting project, it
becomes important to minimize cost of capital, because high cost of capital will tend to increase
cost of capital budgeting like rise in cost of making plants, buildings, etc. (Dhaliwal et al. 2014).
However, lower cost of capital will allow only required cost of budgeting, unnecessary cost will
be abandoned. Thus, it is very important to minimize cost of capital. The importance is described
below.
Due to minimizing cost of capital, required rate of return will increase and internal rate of return
will also increase. But due to reduction in the value of 1 dollar every year, rate of dividend will
remain same but net present value will increase in future. For example,
NPV at 10% discount rate = $ 18,372
Since NPV is greater than zero we have to increase discount rate, thus
NPV at 13% discount rate = $ 4,521
But, it is still greater than zero, discount rate must further be increased, thus
NPV at 14% discount rate = $204
NPV at 15% discount rate = ($3,975)
Since NPV is fairly close to zero at 14% value of (r), therefore
⊘ This is a preview!⊘
Do you want full access?
Subscribe today to unlock all pages.
Trusted by 1+ million students worldwide
ACCOUNTING AND FINANCE 10
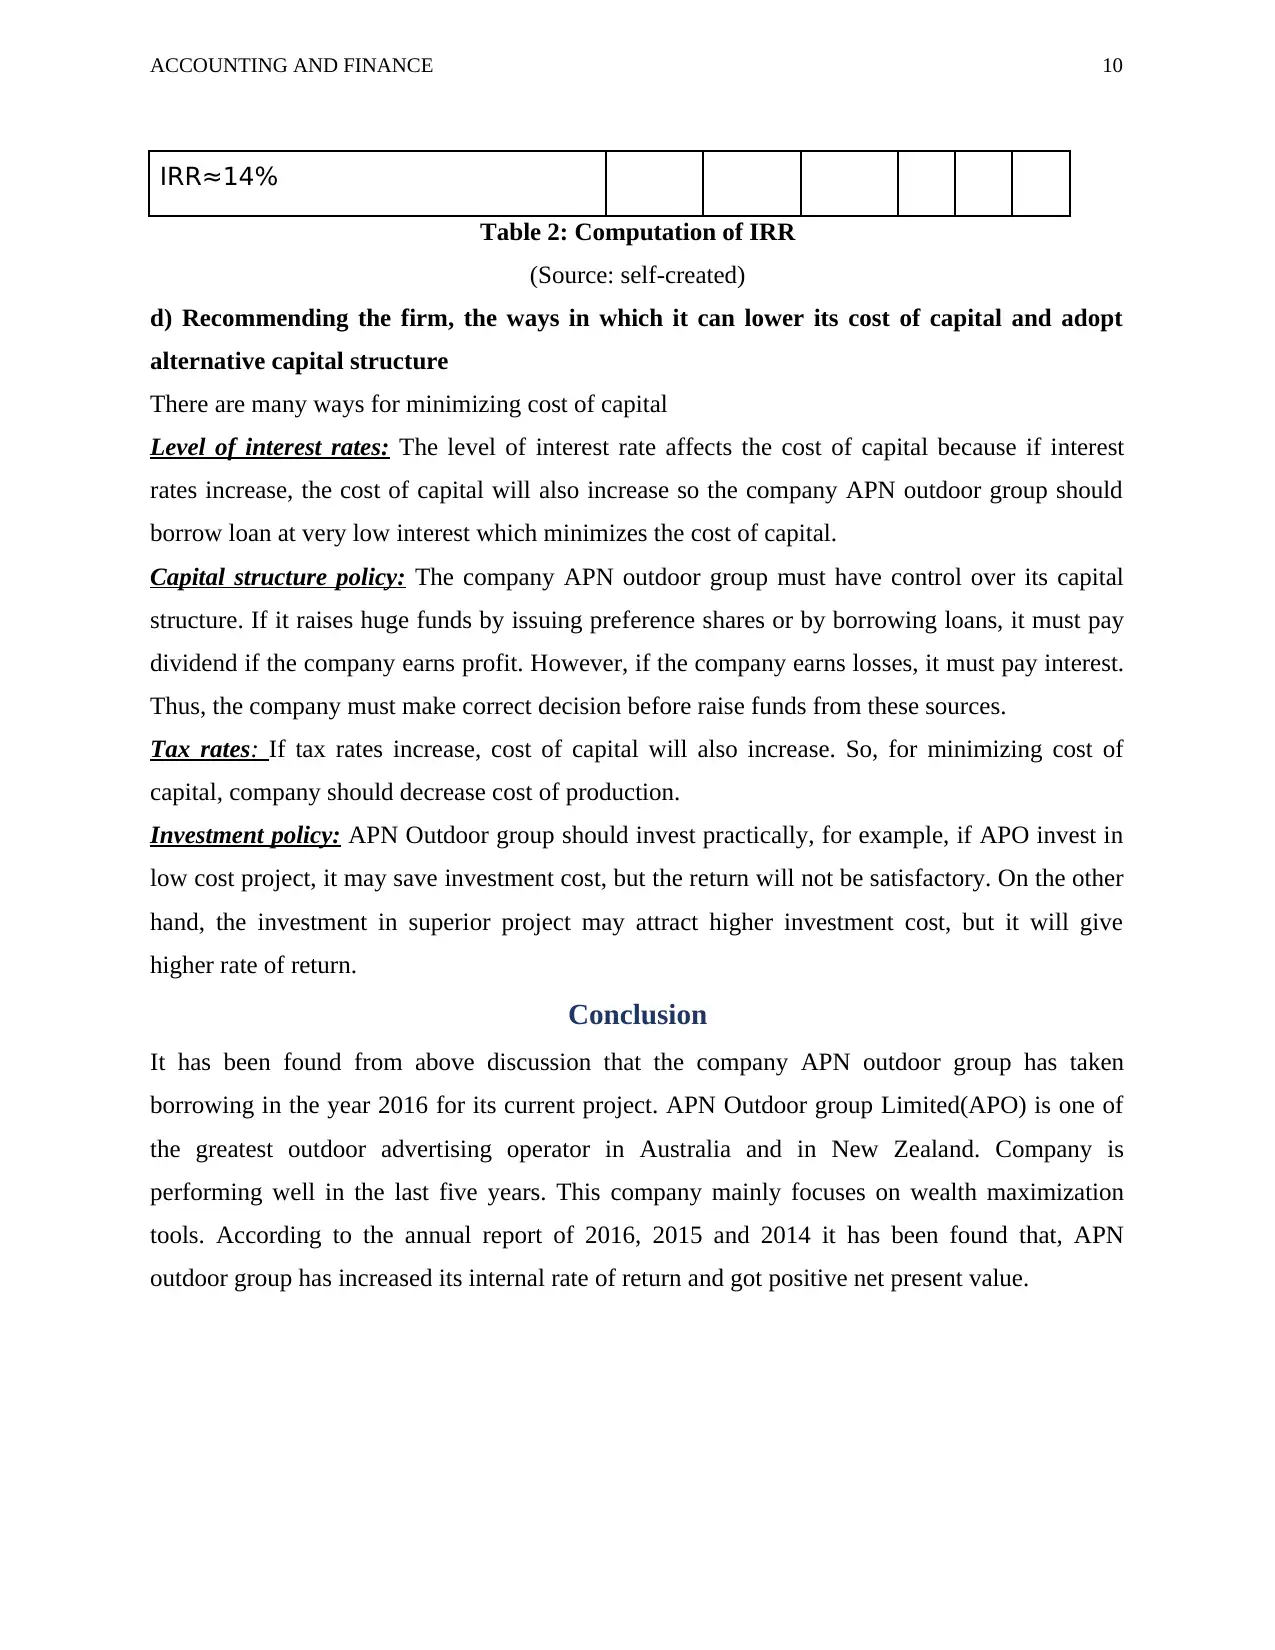
IRR≈14%
Table 2: Computation of IRR
(Source: self-created)
d) Recommending the firm, the ways in which it can lower its cost of capital and adopt
alternative capital structure
There are many ways for minimizing cost of capital
Level of interest rates: The level of interest rate affects the cost of capital because if interest
rates increase, the cost of capital will also increase so the company APN outdoor group should
borrow loan at very low interest which minimizes the cost of capital.
Capital structure policy: The company APN outdoor group must have control over its capital
structure. If it raises huge funds by issuing preference shares or by borrowing loans, it must pay
dividend if the company earns profit. However, if the company earns losses, it must pay interest.
Thus, the company must make correct decision before raise funds from these sources.
Tax rates: If tax rates increase, cost of capital will also increase. So, for minimizing cost of
capital, company should decrease cost of production.
Investment policy: APN Outdoor group should invest practically, for example, if APO invest in
low cost project, it may save investment cost, but the return will not be satisfactory. On the other
hand, the investment in superior project may attract higher investment cost, but it will give
higher rate of return.
Conclusion
It has been found from above discussion that the company APN outdoor group has taken
borrowing in the year 2016 for its current project. APN Outdoor group Limited(APO) is one of
the greatest outdoor advertising operator in Australia and in New Zealand. Company is
performing well in the last five years. This company mainly focuses on wealth maximization
tools. According to the annual report of 2016, 2015 and 2014 it has been found that, APN
outdoor group has increased its internal rate of return and got positive net present value.
Paraphrase This Document
Need a fresh take? Get an instant paraphrase of this document with our AI Paraphraser
ACCOUNTING AND FINANCE 11
References
APO.AU Stock Price & News - APN Outdoor Group Ltd. - Wall Street Journal.
(2017). Quotes.wsj.com. Retrieved on 17 September 2017, from
http://quotes.wsj.com/AU/XASX/APO
APO.AX: Summary for APNOUTDOOR FPO - Yahoo Finance. (2017). Au.finance.yahoo.com.
Retrieved 17 September 2017, from https://au.finance.yahoo.com/quote/APO.AX?
p=APO.AX
Baur, D. G., & Miyakawa, I. (2014). No puzzle: The foreign exchange exposure of Australian
firms. International Review of Financial Analysis, 32, 13-22.
Becker, B., & Ivashina, V. (2015). Reaching for yield in the bond market. The Journal of
Finance, 70(5), 1863-1902.
Dhaliwal, D., Li, O. Z., Tsang, A., & Yang, Y. G. (2014). Corporate social responsibility
disclosure and the cost of equity capital: The roles of stakeholder orientation and
financial transparency. Journal of Accounting and Public Policy, 33(4), 328-355.
Grant, R. M. (2016). Contemporary Strategy Analysis Text Only. John Wiley & Sons.
Hope, W., & Myllylahti, M. (2013). Financialisation of media ownership in New Zealand. New
Zealand Sociology, 28(3), 192.
Jones, T. M., & Felps, W. (2013). Shareholder wealth maximization and social welfare: A
utilitarian critique. Business Ethics Quarterly, 23(2), 207-238.
Robb, A. M., & Robinson, D. T. (2014). The capital structure decisions of new firms. The
Review of Financial Studies, 27(1), 153-179.
1 out of 11
Related Documents


Your All-in-One AI-Powered Toolkit for Academic Success.
+13062052269
info@desklib.com
Available 24*7 on WhatsApp / Email
![[object Object]](/_next/static/media/star-bottom.7253800d.svg)
Unlock your academic potential
Copyright © 2020–2026 A2Z Services. All Rights Reserved. Developed and managed by ZUCOL.