Apple vs. Samsung: A Detailed Financial Statement Analysis Report

Verified

Added on  2023/06/11

|24
|3706
|314
Report
AI Summary
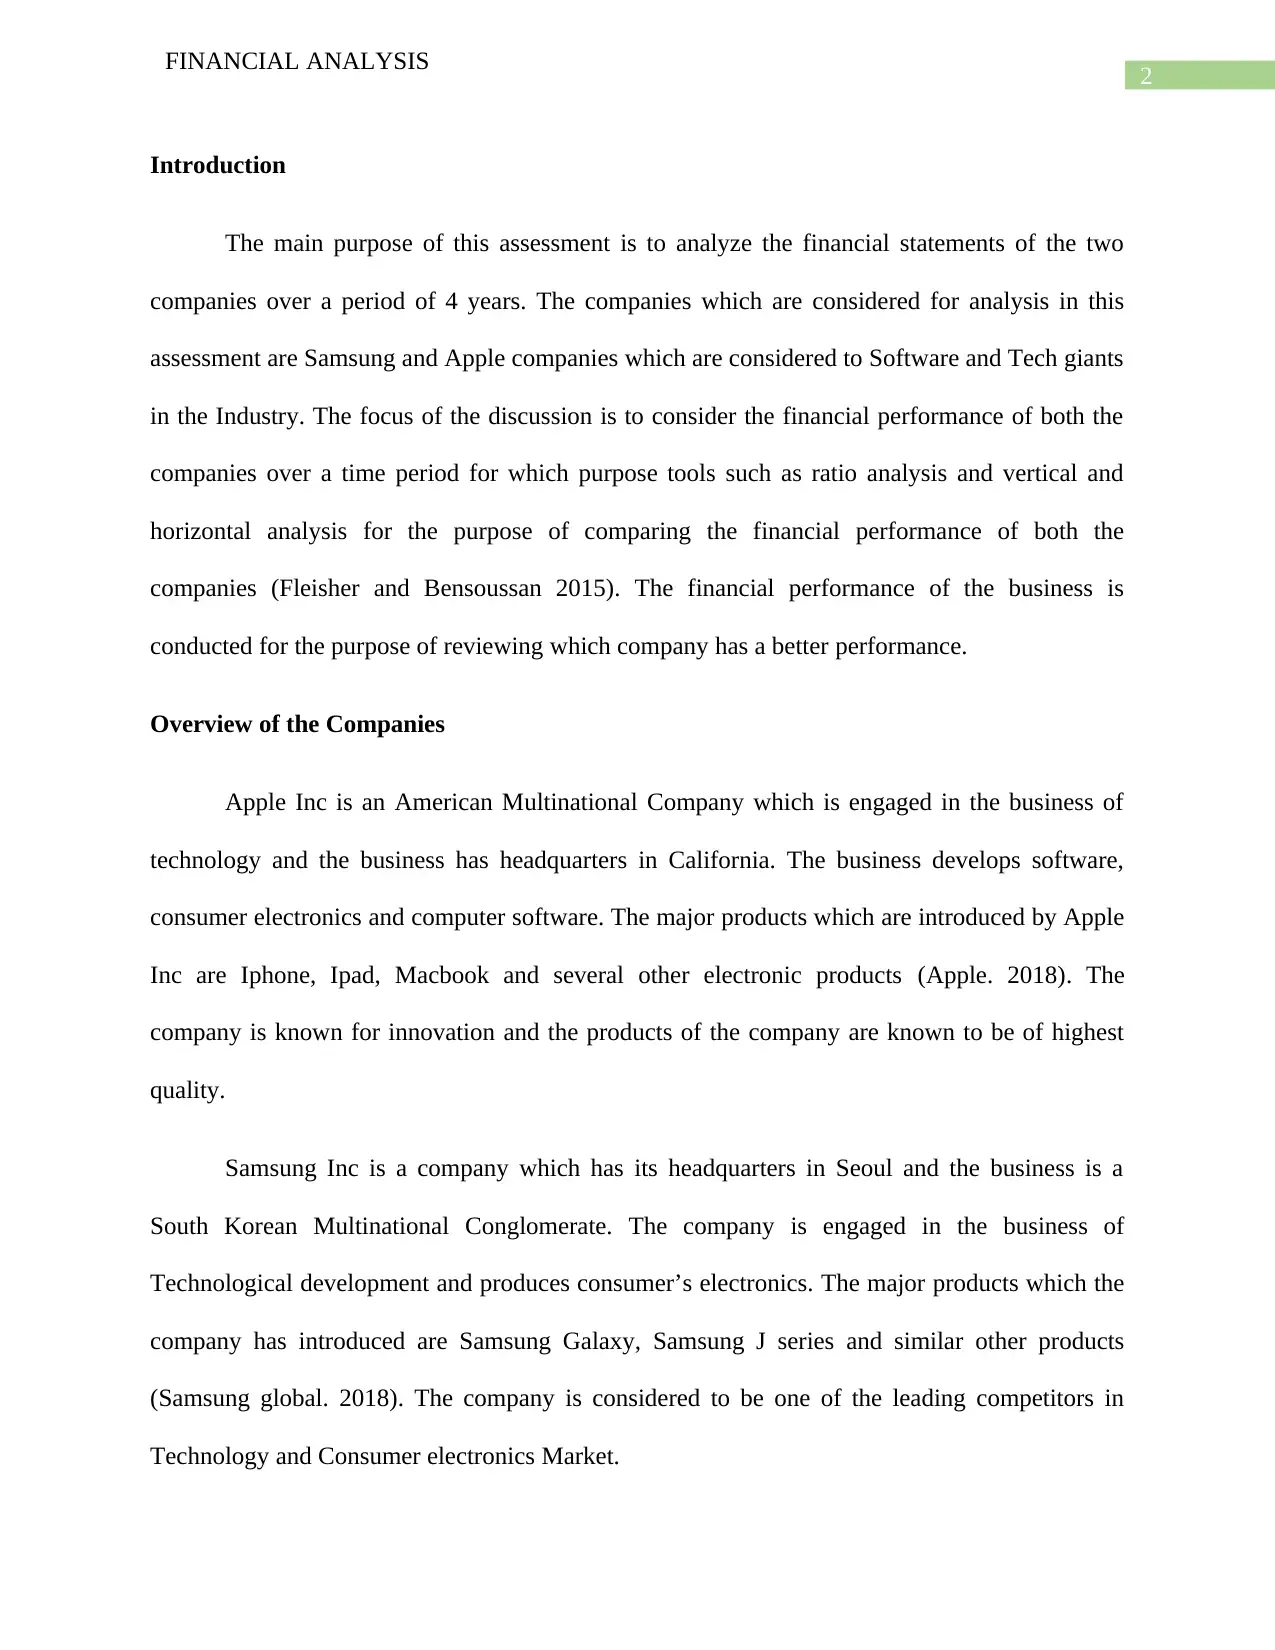
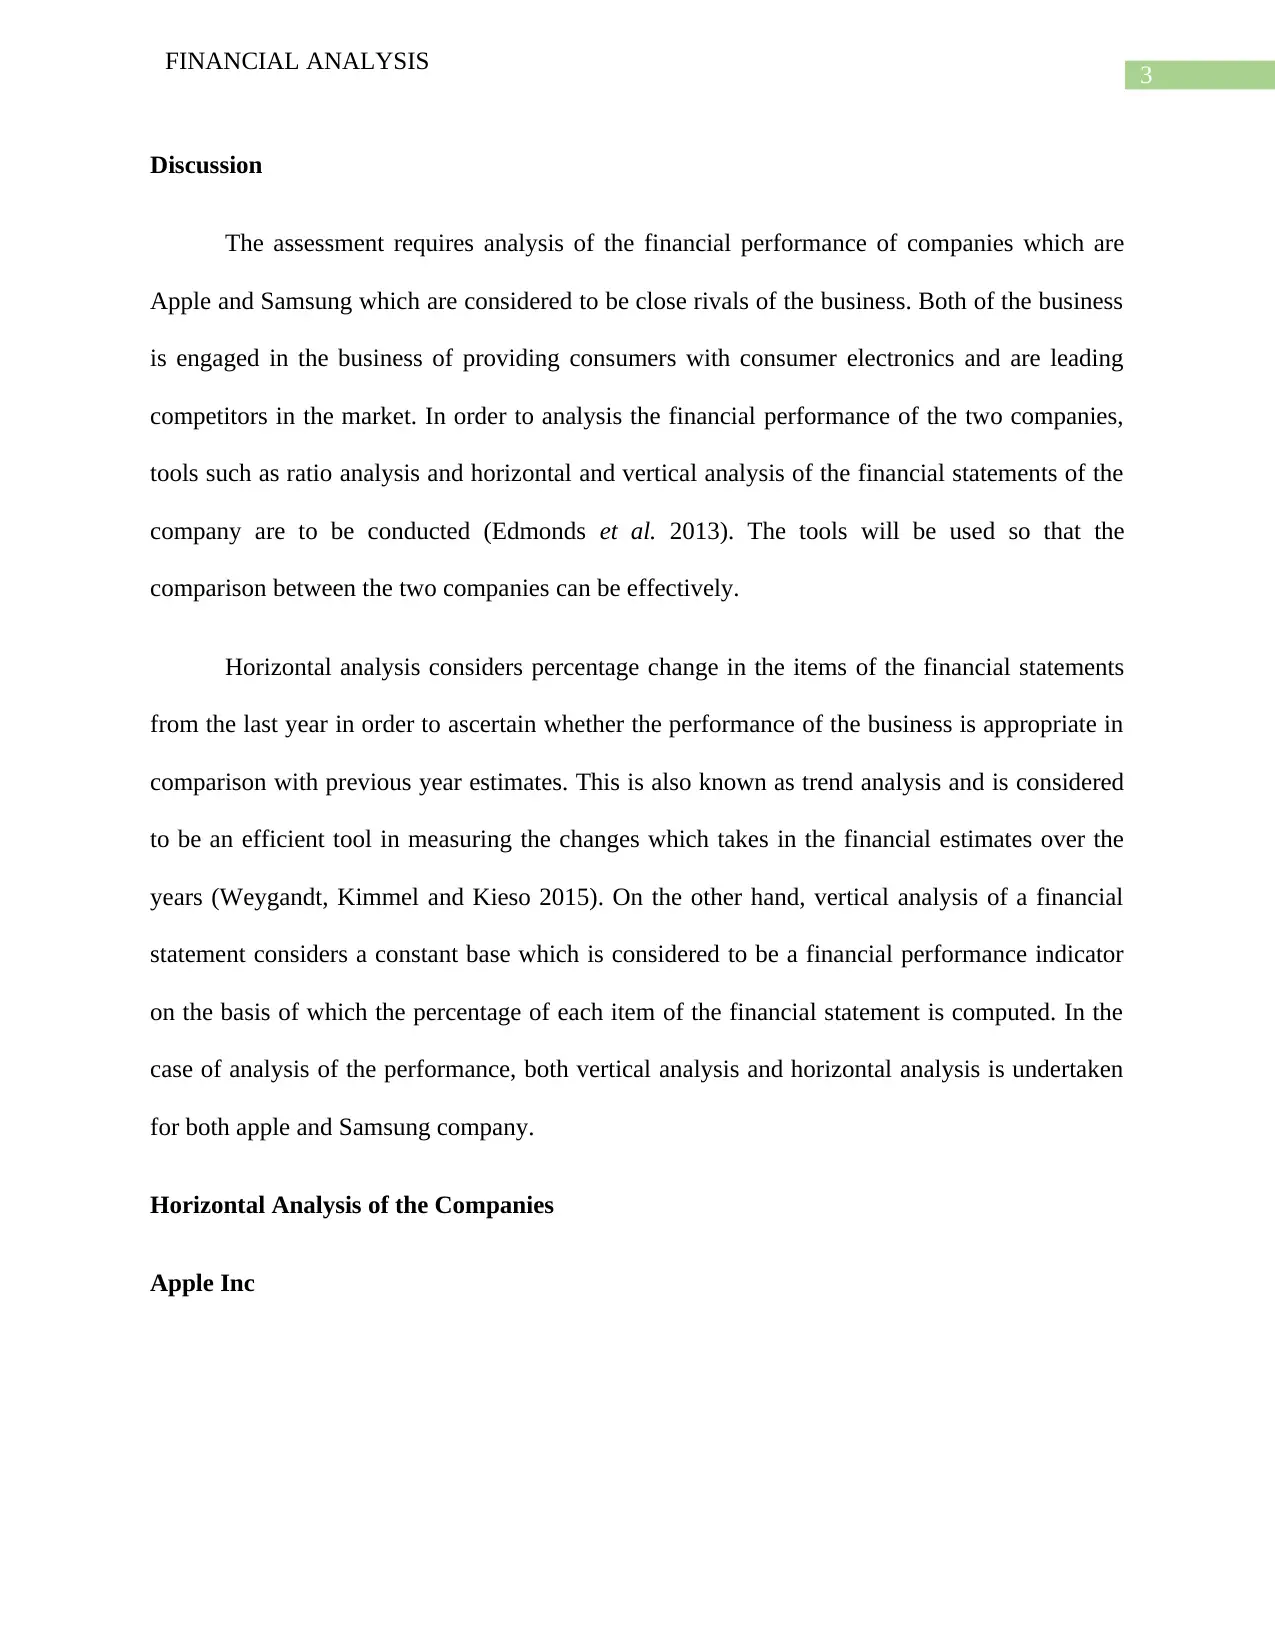
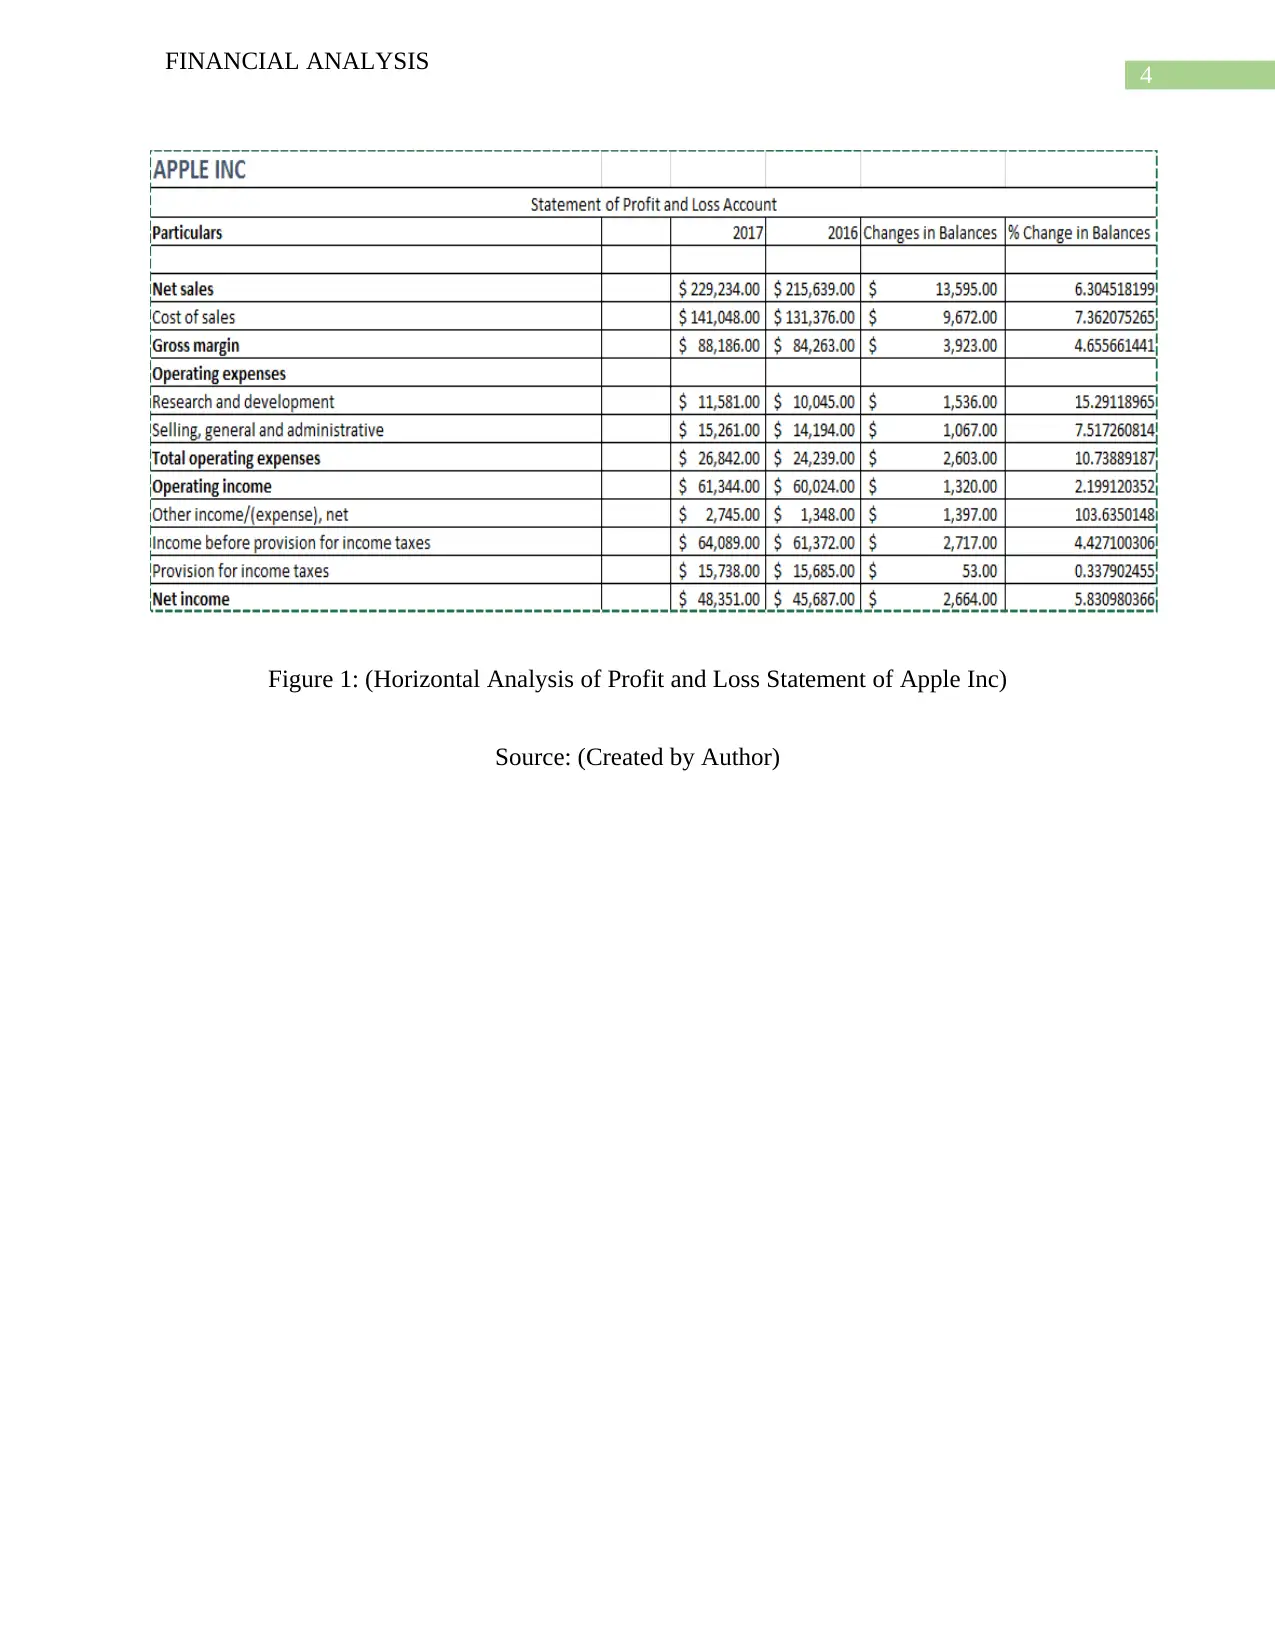
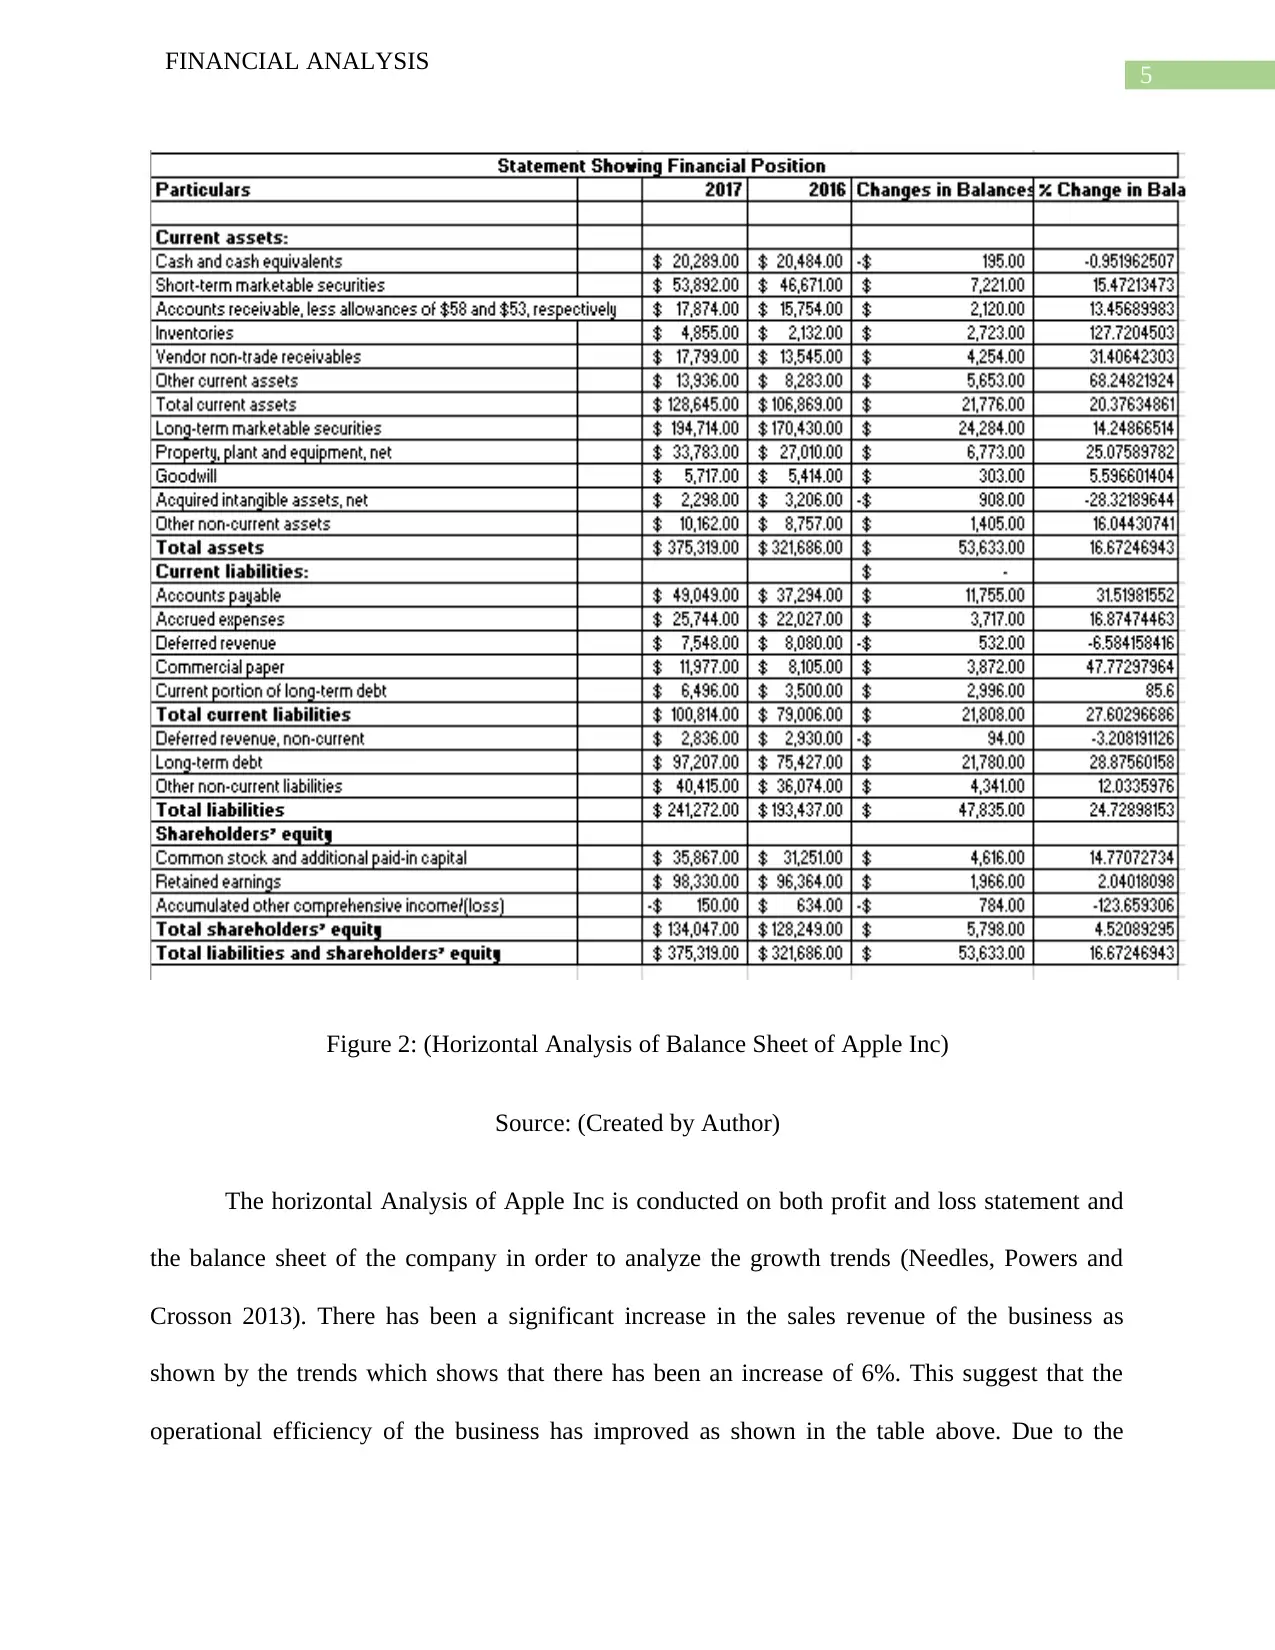
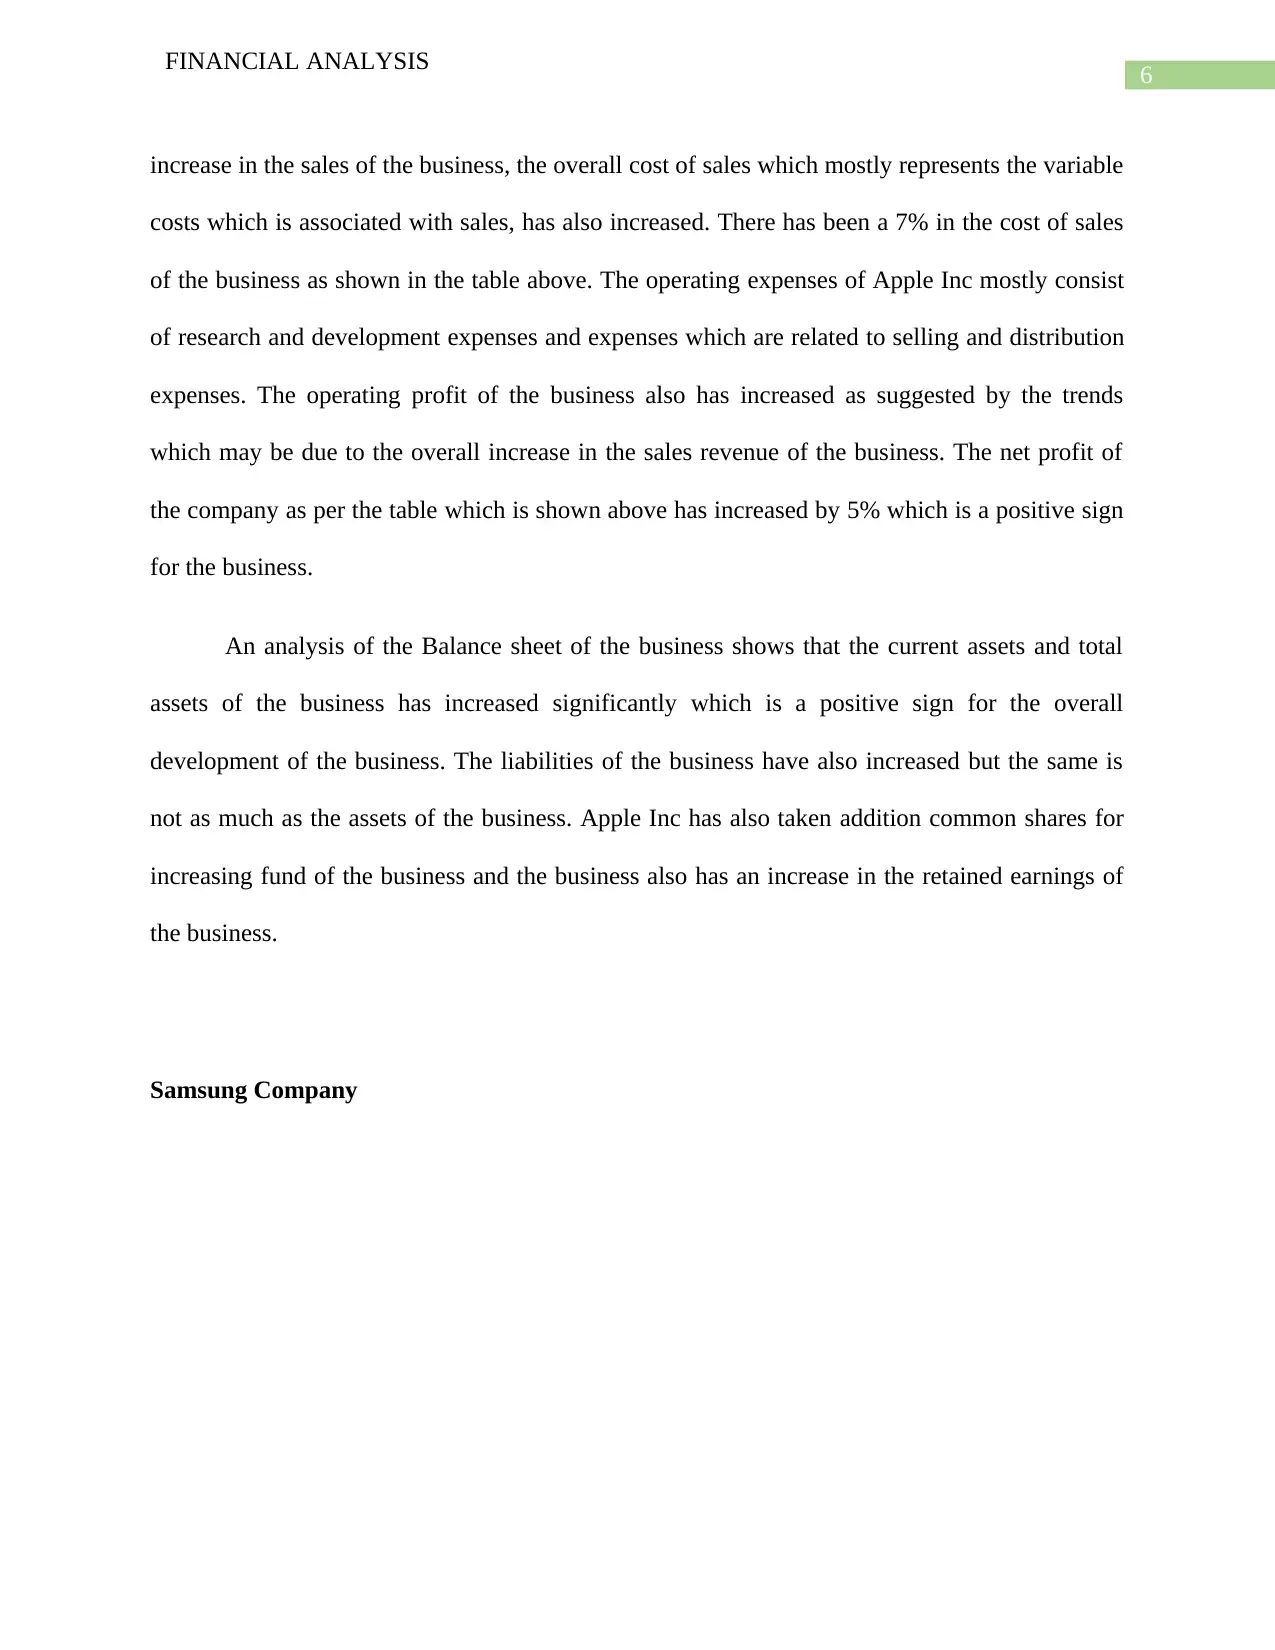
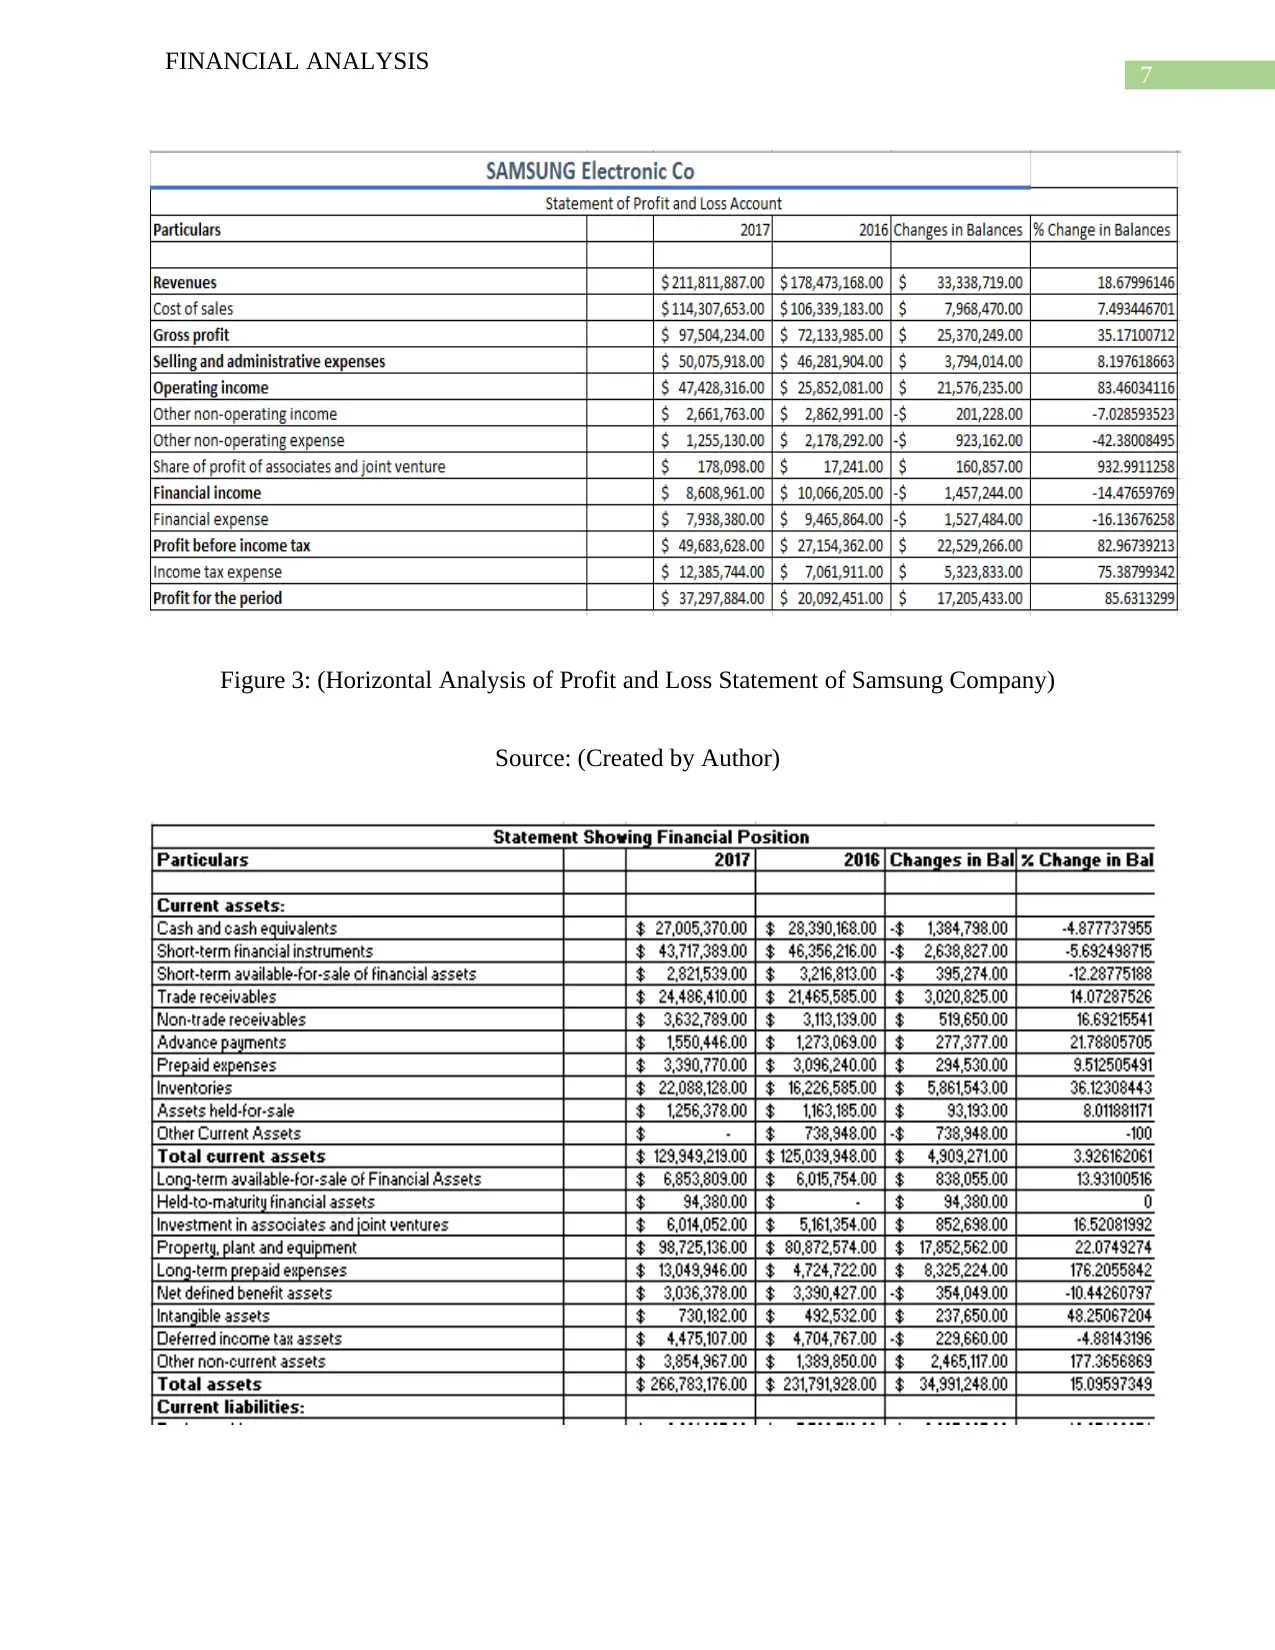
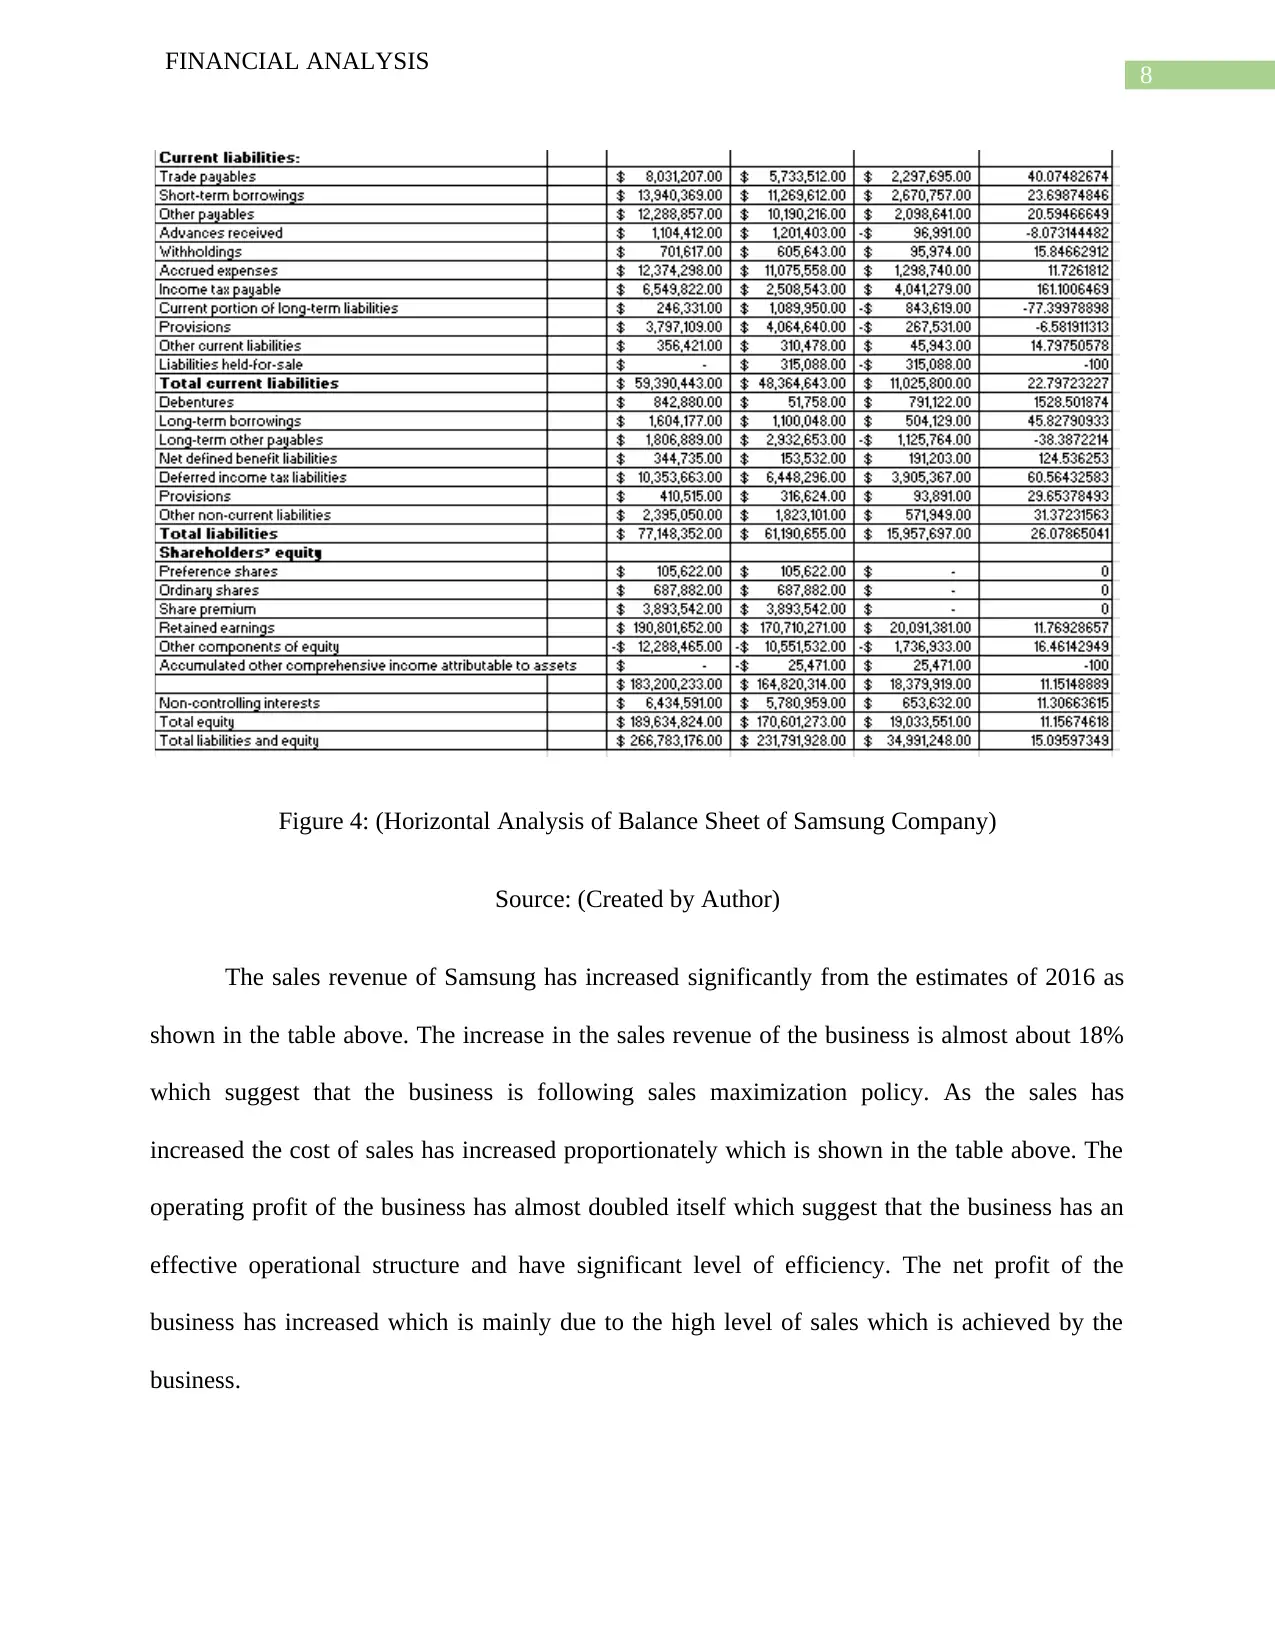
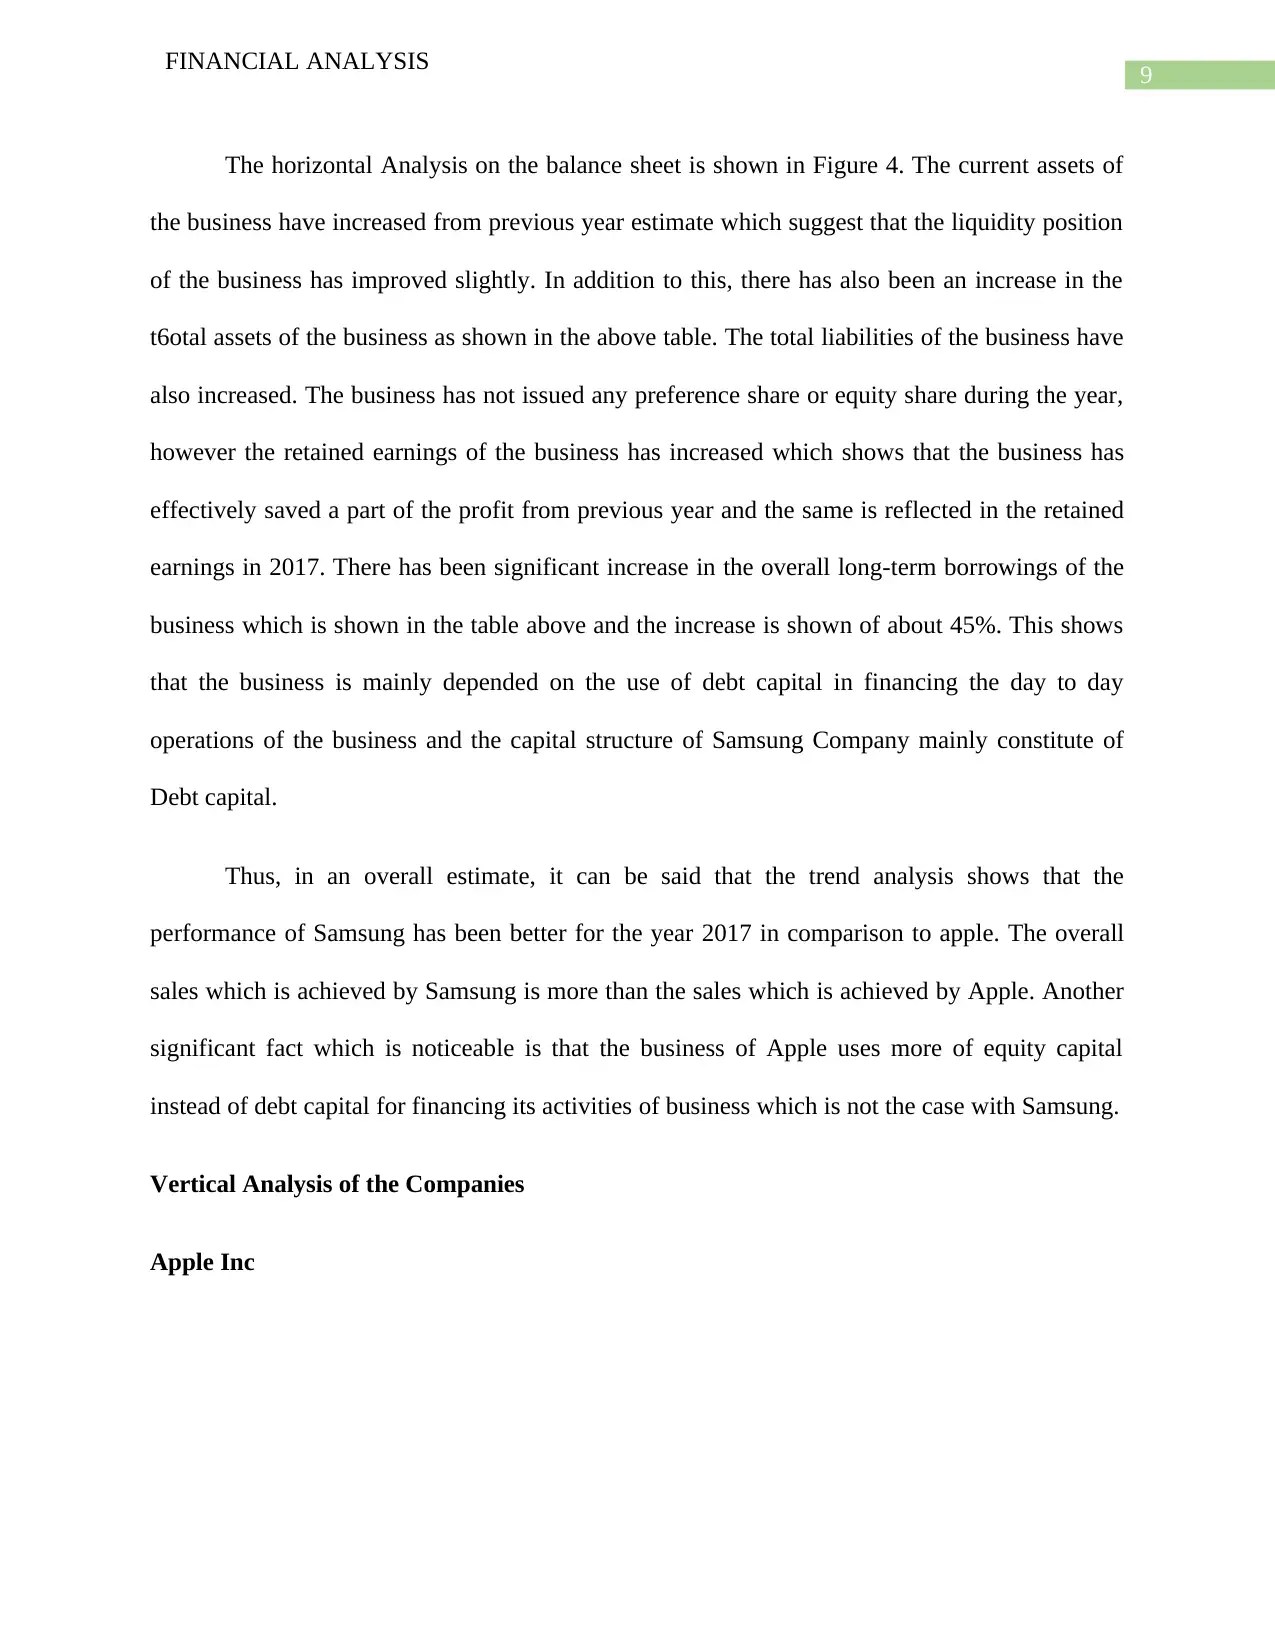
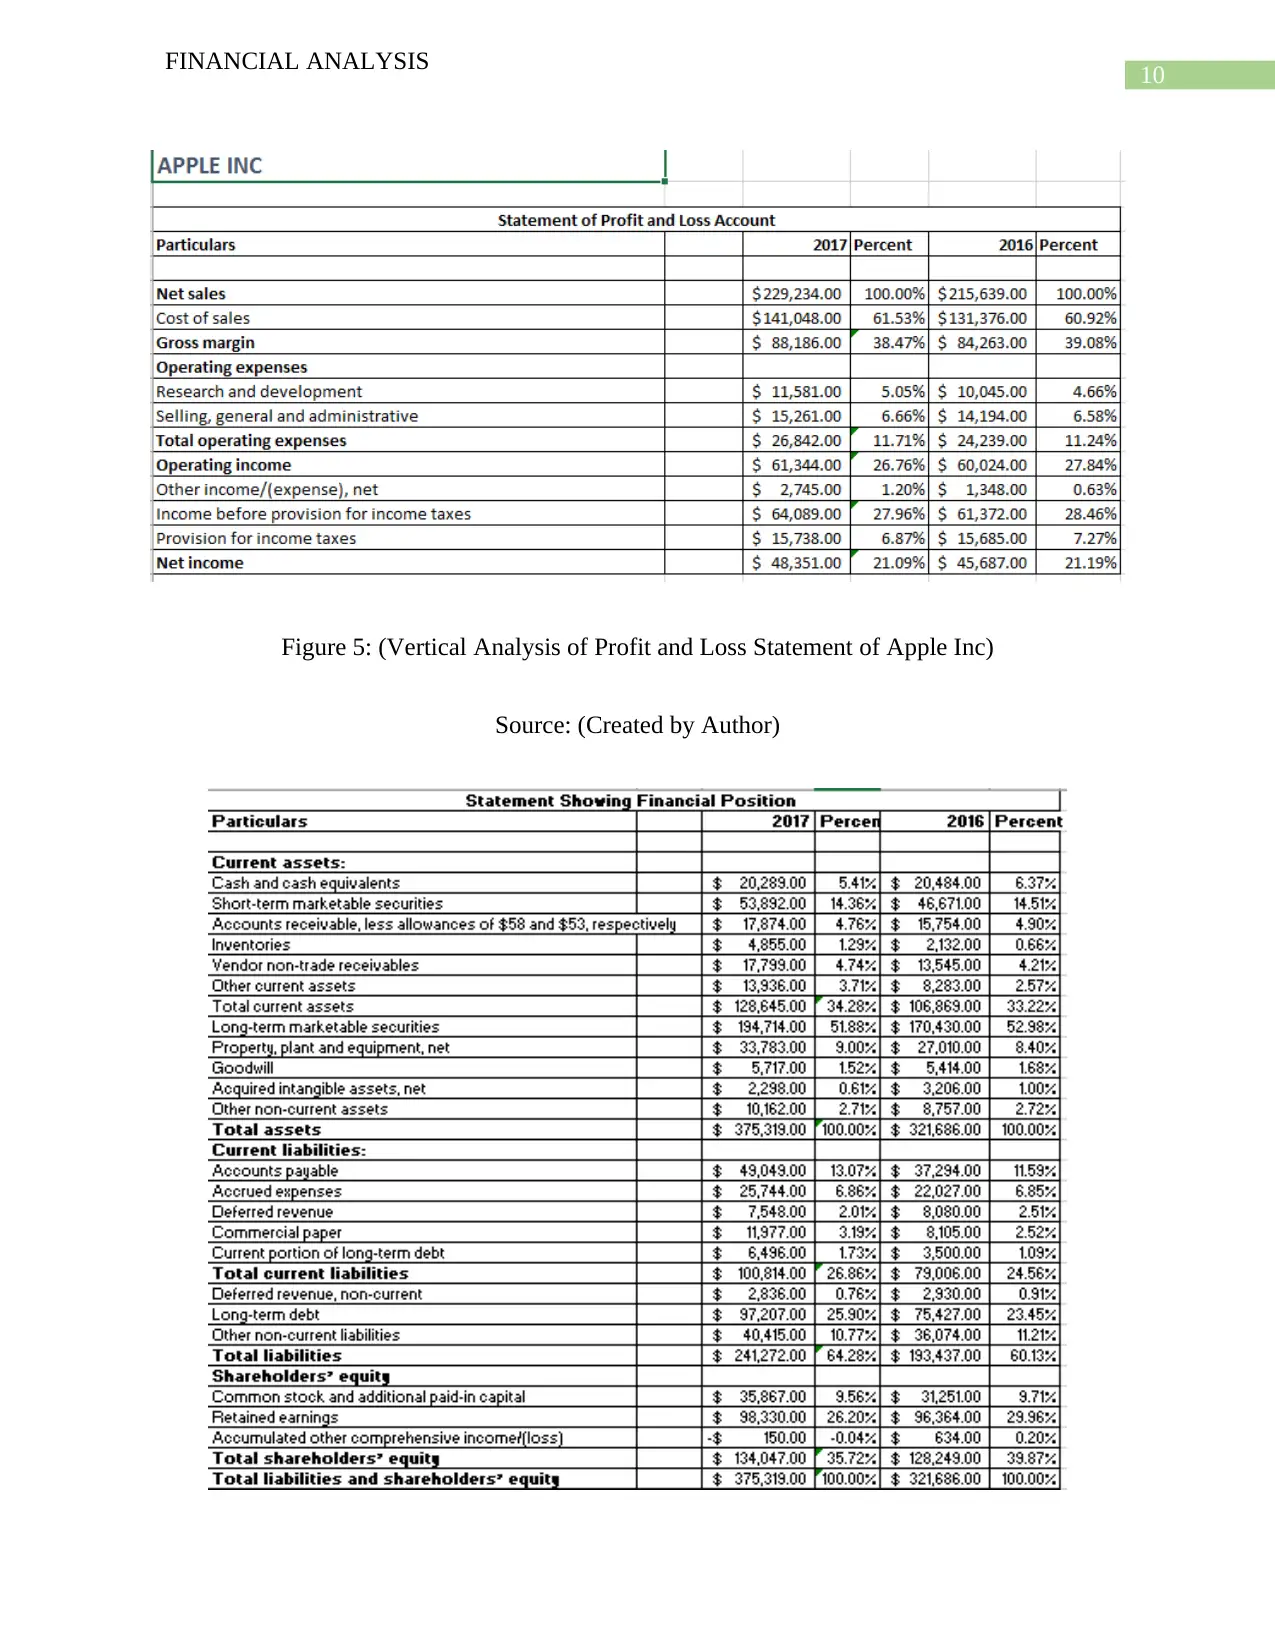
This assessment provides a comparative financial analysis of Apple Inc. and Samsung, two leading tech giants, over a four-year period. It employs tools such as ratio analysis, horizontal analysis, and vertical analysis to evaluate and compare their financial performance. The analysis covers key aspects including sales revenue, cost of sales, operating expenses, and net profit, derived from both the profit and loss statements and balance sheets of each company. The horizontal analysis reveals trends in financial statement items, while the vertical analysis examines each item as a percentage of a base figure (net sales for income statement, total assets for balance sheet). Key financial ratios, including profitability ratios like gross margin, net margin, return on assets, and return on equity, are calculated and compared. The report concludes by evaluating the corporate social responsibility initiatives of both companies, providing a holistic view of their financial and ethical standing. Desklib provides access to this and similar solved assignments for students.
tabler-icon-diamond-filled.svg

Contribute Materials

Your contribution can guide someone’s learning journey. Share your documents today.
Document Page
Running head: FINANCIAL ANALYSIS
Financial Analysis
Name of the Student:
Name of the University:
Author’s Note:
tabler-icon-diamond-filled.svg

Secure Best Marks with AI Grader

Need help grading? Try our AI Grader for instant feedback on your assignments.
Document Page
1
FINANCIAL ANALYSIS
Table of Contents
Introduction......................................................................................................................................2
Discussion........................................................................................................................................3
Horizontal Analysis of the Companies........................................................................................3
Vertical Analysis of the Companies............................................................................................9
Ratio Analysis............................................................................................................................14
Corporate Social Responsibility of Companies.........................................................................19
Reference.......................................................................................................................................22
Document Page
2
FINANCIAL ANALYSIS
Introduction
The main purpose of this assessment is to analyze the financial statements of the two
companies over a period of 4 years. The companies which are considered for analysis in this
assessment are Samsung and Apple companies which are considered to Software and Tech giants
in the Industry. The focus of the discussion is to consider the financial performance of both the
companies over a time period for which purpose tools such as ratio analysis and vertical and
horizontal analysis for the purpose of comparing the financial performance of both the
companies (Fleisher and Bensoussan 2015). The financial performance of the business is
conducted for the purpose of reviewing which company has a better performance.
Overview of the Companies
Apple Inc is an American Multinational Company which is engaged in the business of
technology and the business has headquarters in California. The business develops software,
consumer electronics and computer software. The major products which are introduced by Apple
Inc are Iphone, Ipad, Macbook and several other electronic products (Apple. 2018). The
company is known for innovation and the products of the company are known to be of highest
quality.
Samsung Inc is a company which has its headquarters in Seoul and the business is a
South Korean Multinational Conglomerate. The company is engaged in the business of
Technological development and produces consumer’s electronics. The major products which the
company has introduced are Samsung Galaxy, Samsung J series and similar other products
(Samsung global. 2018). The company is considered to be one of the leading competitors in
Technology and Consumer electronics Market.
Document Page
3
FINANCIAL ANALYSIS
Discussion
The assessment requires analysis of the financial performance of companies which are
Apple and Samsung which are considered to be close rivals of the business. Both of the business
is engaged in the business of providing consumers with consumer electronics and are leading
competitors in the market. In order to analysis the financial performance of the two companies,
tools such as ratio analysis and horizontal and vertical analysis of the financial statements of the
company are to be conducted (Edmonds et al. 2013). The tools will be used so that the
comparison between the two companies can be effectively.
Horizontal analysis considers percentage change in the items of the financial statements
from the last year in order to ascertain whether the performance of the business is appropriate in
comparison with previous year estimates. This is also known as trend analysis and is considered
to be an efficient tool in measuring the changes which takes in the financial estimates over the
years (Weygandt, Kimmel and Kieso 2015). On the other hand, vertical analysis of a financial
statement considers a constant base which is considered to be a financial performance indicator
on the basis of which the percentage of each item of the financial statement is computed. In the
case of analysis of the performance, both vertical analysis and horizontal analysis is undertaken
for both apple and Samsung company.
Horizontal Analysis of the Companies
Apple Inc
tabler-icon-diamond-filled.svg

Secure Best Marks with AI Grader

Need help grading? Try our AI Grader for instant feedback on your assignments.
Document Page
4
FINANCIAL ANALYSIS
Figure 1: (Horizontal Analysis of Profit and Loss Statement of Apple Inc)
Source: (Created by Author)
Document Page
5
FINANCIAL ANALYSIS
Figure 2: (Horizontal Analysis of Balance Sheet of Apple Inc)
Source: (Created by Author)
The horizontal Analysis of Apple Inc is conducted on both profit and loss statement and
the balance sheet of the company in order to analyze the growth trends (Needles, Powers and
Crosson 2013). There has been a significant increase in the sales revenue of the business as
shown by the trends which shows that there has been an increase of 6%. This suggest that the
operational efficiency of the business has improved as shown in the table above. Due to the
Document Page
6
FINANCIAL ANALYSIS
increase in the sales of the business, the overall cost of sales which mostly represents the variable
costs which is associated with sales, has also increased. There has been a 7% in the cost of sales
of the business as shown in the table above. The operating expenses of Apple Inc mostly consist
of research and development expenses and expenses which are related to selling and distribution
expenses. The operating profit of the business also has increased as suggested by the trends
which may be due to the overall increase in the sales revenue of the business. The net profit of
the company as per the table which is shown above has increased by 5% which is a positive sign
for the business.
An analysis of the Balance sheet of the business shows that the current assets and total
assets of the business has increased significantly which is a positive sign for the overall
development of the business. The liabilities of the business have also increased but the same is
not as much as the assets of the business. Apple Inc has also taken addition common shares for
increasing fund of the business and the business also has an increase in the retained earnings of
the business.
Samsung Company
tabler-icon-diamond-filled.svg

Paraphrase This Document

Need a fresh take? Get an instant paraphrase of this document with our AI Paraphraser
Document Page
7
FINANCIAL ANALYSIS
Figure 3: (Horizontal Analysis of Profit and Loss Statement of Samsung Company)
Source: (Created by Author)
Document Page
8
FINANCIAL ANALYSIS
Figure 4: (Horizontal Analysis of Balance Sheet of Samsung Company)
Source: (Created by Author)
The sales revenue of Samsung has increased significantly from the estimates of 2016 as
shown in the table above. The increase in the sales revenue of the business is almost about 18%
which suggest that the business is following sales maximization policy. As the sales has
increased the cost of sales has increased proportionately which is shown in the table above. The
operating profit of the business has almost doubled itself which suggest that the business has an
effective operational structure and have significant level of efficiency. The net profit of the
business has increased which is mainly due to the high level of sales which is achieved by the
business.
Document Page
9
FINANCIAL ANALYSIS
The horizontal Analysis on the balance sheet is shown in Figure 4. The current assets of
the business have increased from previous year estimate which suggest that the liquidity position
of the business has improved slightly. In addition to this, there has also been an increase in the
t6otal assets of the business as shown in the above table. The total liabilities of the business have
also increased. The business has not issued any preference share or equity share during the year,
however the retained earnings of the business has increased which shows that the business has
effectively saved a part of the profit from previous year and the same is reflected in the retained
earnings in 2017. There has been significant increase in the overall long-term borrowings of the
business which is shown in the table above and the increase is shown of about 45%. This shows
that the business is mainly depended on the use of debt capital in financing the day to day
operations of the business and the capital structure of Samsung Company mainly constitute of
Debt capital.
Thus, in an overall estimate, it can be said that the trend analysis shows that the
performance of Samsung has been better for the year 2017 in comparison to apple. The overall
sales which is achieved by Samsung is more than the sales which is achieved by Apple. Another
significant fact which is noticeable is that the business of Apple uses more of equity capital
instead of debt capital for financing its activities of business which is not the case with Samsung.
Vertical Analysis of the Companies
Apple Inc
tabler-icon-diamond-filled.svg

Secure Best Marks with AI Grader

Need help grading? Try our AI Grader for instant feedback on your assignments.
Document Page
10
FINANCIAL ANALYSIS
Figure 5: (Vertical Analysis of Profit and Loss Statement of Apple Inc)
Source: (Created by Author)
Document Page
11
FINANCIAL ANALYSIS
Figure 6: (Vertical Analysis of Balance Sheet of Apple Inc)
Source: (Created by Author)
As per the vertical analysis of the financial statements of Apple Inc, the first step is to
consider a constant on the basis of which the percentage are to be calculated for all the items of
the financial statement. The constant which is considered for the analysis is net sales figure of
the business and in case of vertical analysis of the balance sheet, the total assets and total equities
and liabilities figure is taken as base for vertical analysis of the financial statements of the
business. The main purpose behind vertical analysis of the financial is to consider the various
items in terms of percentage of the constant which is considered for the analysis. The percentage
for cost of sales for Apple Inc has increased from previous year and gross margin of the business
has decreased from previous year’s estimate due to similar reasons. The operating expenses of
the business is shown to be 11.71% which has slightly increased from the estimate of previous
year which means that in current year the operating expenses forms more of sales as shown in
the above figure. The net income as a percentage of sales is shown to be 21.09% which can be
considered to be a good sign for the business. In case of balance sheet, the total asset figure is
taken as a base for computing the percentage of various items which are shown in the asset area
of the financial statement. The current assets of the business forms around 34% of the total assets
figure which is clearly shown in the table which is given above.
Samsung Company
Document Page
12
FINANCIAL ANALYSIS
Figure 7: (Vertical Analysis of Profit and Loss Statement of Samsung Company)
Source: (Created by Author)
tabler-icon-diamond-filled.svg

Paraphrase This Document

Need a fresh take? Get an instant paraphrase of this document with our AI Paraphraser
Document Page
13
FINANCIAL ANALYSIS
Document Page
14
FINANCIAL ANALYSIS
Figure 8: (Vertical Analysis of Balance Sheet of Samsung Company)
Source: (Created by Author)
The analysis of the financial performance of Samsung Company is analyzed by
conducting a vertical analysis of the financial statement. The base is taken as similar to Apple
case which are total revenues generated in case of profit and loss account and total assets and
total equity and liabilities in case of Balance sheet (Brooks and Mukherjee 2013). The cost of
sales as a percentage of sales of the company is computed as 54%. The profit for the period is
shown to be 17% as a percentage of sales of the business which is much lesser to that of
percentage of profit which is achieved by Apple Inc which suggest that operation of the business
is better than that of Samsung Company. The balance sheet of the company shows that the
business posses a large variety of assets which is shown in the table above and for each item a
percentage is computed considering the base to be the total asset figure.
Ratio Analysis
Apple Inc’s Key Financial Ratios
Document Page
15
FINANCIAL ANALYSIS
tabler-icon-diamond-filled.svg

Secure Best Marks with AI Grader

Need help grading? Try our AI Grader for instant feedback on your assignments.
Document Page
16
FINANCIAL ANALYSIS
Samsung Company’s Key Financial Ratios
Document Page
17
FINANCIAL ANALYSIS
As per the above tables shows the significant ratio calculations which are considered to
be a measure of the financial performance of the business. The profitability ratio analyzes gross
margin, net margin, return on assets and return on equity for both the companies (Kim, Kraft and
Ryan 2013). The gross margin for Apple Inc for the year 2017 is shown to 0.615 which is on a
growing trend as can been seen from the gross margin for previous years and the same is better
that the gross margin of Samsung which is shown to be 0.540. This signifies that the operational
efficiency of Apple Inc is more superior than that of Samsung Company. The net profit margin
Document Page
18
FINANCIAL ANALYSIS
of Apple Inc has slightly decreased from the previous year which can be due to the vast
expansion policy which Apple Company follows which requires vast resources. In addition to
this, the net profit margin of the Apple Inc is much better than that of Samsung Company which
may be due to the higher sales and operational efficiency which the management of Apple has
achieved. The return on assets and return on equity ratios signifies the returns which the
company can achieved while utilizing the assets of the business and the share capital of the
business. Both the estimates show that Apple Inc is able to meet the expectations of the
shareholders and also has appropriate return on assets of the business. The return on assets and
return on equity of Samsung Company shows a result of 0.140 and 0.197 for the year 2017 and
the same has improved significantly from previous years estimates which suggest that the
company is developing further. However, the estimates which is computed for Samsung
company for the current year is lesser than that which is achieved by Apple Inc.
The current ratio of Apple Inc for the year 2017 has decreased slightly which should be
matter concern for the business as the same affects the liquidity of the company whereas the
current ratio computed for Samsung Company is significantly better than apple which suggest
that Samsung has a better liquidity position in comparison to Apple. The estimate of times
interest earned ratio shows the ability of the company to service the debts of the business and the
same is shown to be better for Samsung Company (Weil, Schipper and Francis 2013). The debt
equity ratio of Apple Inc is shown to be appropriate in comparison to that of Samsung Company
which suggest that the capital structure of the Apple Inc is better than that of Samsung Company.
In addition to this, the debt equity ratio and Debt ratio of both companies shows that Apple Inc
puts more emphasis on debt capital and utilizes the same more than Samsung Company. The
inventory turnover ratio of the apple is much better than inventory turnover ratio of Samsung
tabler-icon-diamond-filled.svg

Paraphrase This Document

Need a fresh take? Get an instant paraphrase of this document with our AI Paraphraser
Document Page
19
FINANCIAL ANALYSIS
company. This shows that the efficiency of the business of Apple Inc is better than that of
Samsung Company. The receivable turnover ratio of Apple Inc is better than that of Samsung
Company which is clearly shown in the table above.
The analysis of the key financial ratios of both the companies shows that the performance
of Apple Inc is better than that of Samsung Company. The gross profit margin and net profit
margin is shown to be better of Apple Inc and also the efficiency ratio also suggest that the
management of Apple Inc is better than Samsung Inc.
Corporate Social Responsibility of Companies
Corporate Social Responsibility refers to the various activities which are undertaken by
the business for the development of the needs of the society (Schwartz 2017). The CSR policies
generally looks after the needs of the society and also consider the environmental and social
responsibilities.
The corporate social responsibility of Samsung Company is effectively shown in the
sustainability report which is prepared by the company. The sustainability report of Samsung
shows that the business is committed towards creating value for the customers in sustainable way
and also aware of its responsibility of showing strong leadership qualities in the ear of intense
competition which is taking place in the market. The management of Samsung Company is also
engaged in innovation and development activities so as to ensure that the new products which are
introduced by the business are sustainable and does not harm the environment in any way.
Moreover, the management adopts the UN Sustainable Development Goals in order to balance
the responsibility of economy, society and environment and also is engaged in value creation.
The business has also established a Corporate Governance Committee to look after the needs of
Document Page
20
FINANCIAL ANALYSIS
sustainability and ethical policies of the business. In addition the role of the committee is to
supervise the operations of the business and also consider the shareholder’s value for the
business. The management also regularly held open communication with all the stakeholders of
the business in order to address their grievances and also know the expectations which the
stakeholders have from the company (Suliman, Al-Khatib and Thomas 2016). The management
of Samsung Company needs to consider the value creation process of the business through
sustainable management of the company. Through this management, the business not only looks
after the needs of the society but also the environmental consideration of the business.
The business of Apple Inc also shows that the management is effectively committed
towards the sustainable development of the business. The management is committed towards the
responsibility of the business for ensuring the products which are introduced by the business are
environmental friendly and also meets the needs of the shareholders and society. The objectives
of the business which are stated in the environmental sustainability report of the business are
shown below in details:
The management of Apple Inc is committed towards reducing the impact of the business
activities on the changes in climate. This is done by using renewable sources of energy
and driving product efficiency in the products which are introduced and the facilities of
the business.
The business of Apple Inc also aims to conserve precious resources of the society so that
the business can thrive in a sustainable manner.
The material which are used by organization are such that the products which are
introduced by the business are safe for use.
Document Page
21
FINANCIAL ANALYSIS
The management of the company needs to ensure that the all the process of the business is
sustainable in nature and the same should be accounted for in the sustainable reports of the
company. The management of Apple Inc has also set up various committees for ensuring the
sustainability practice of the business are effectively follows by every department of the
business. In case of evaluating global energy policy of the company, the management supports
suppliers who are there to promote the energy efficient regulations and renewable sources of
energy. The management of Apple Inc has also introduced clean energy portal in order to share
the insights of the company on utilization of renewable source of energy in business operations.
In addition to this, the management of Apple is providing the manufactures better technical
support and economic support for accelerating the transition to clean energy sources (Ni and Van
Wart 2015). The management of the company also focuses on lowering the carbon emission of
the business in manufacturing its products such as the Iphones. The management has started
utilizing more of aluminum so as to reduce the emission of carbon and thereby protect the
environment. In addition to this, the management of Apple Inc focuses on building Green
corporate Houses so that the impact on the environment can be minimized. Apple Inc is also
known for its sustainable practices which is employed by the business for sustainable
development of the process of the business.
tabler-icon-diamond-filled.svg

Secure Best Marks with AI Grader

Need help grading? Try our AI Grader for instant feedback on your assignments.
Document Page
22
FINANCIAL ANALYSIS
Reference
Apple. (2018). Investor Relations - Apple. [online] Available at: http://investor.apple.com/
[Accessed 19 Jul. 2018].
Brooks, R. and Mukherjee, A.K., 2013. Financial management: core concepts. Pearson.
Edmonds, T.P., McNair, F.M., Olds, P.R. and Milam, E.E., 2013. Fundamental financial
accounting concepts. New York, NY: McGraw
Fleisher, C.S. and Bensoussan, B.E., 2015. Business and competitive analysis: effective
application of new and classic methods. FT Press.
Kim, S., Kraft, P. and Ryan, S.G., 2013. Financial statement comparability and credit
risk. Review of Accounting Studies, 18(3), pp.783-823.
Needles, B.E., Powers, M. and Crosson, S.V., 2013. Financial and managerial accounting.
Cengage Learning.
Ni, A. and Van Wart, M., 2015. Corporate Social Responsibility: Doing Well and Doing Good.
In Building Business-Government Relations (pp. 175-196). Routledge.
Samsung global. (2018). Investor Relations Samsung. [online] Available at:
https://www.samsung.com/global/ir/ [Accessed 19 Jul. 2018].
Schwartz, M.S., 2017. Corporate social responsibility. Routledge.
Suliman, A.M., Al-Khatib, H.T. and Thomas, S.E., 2016. Corporate social
responsibility. Corporate Social Performance: Reflecting on the Past and Investing in the
Future, p.15.
Document Page
23
FINANCIAL ANALYSIS
Weil, R.L., Schipper, K. and Francis, J., 2013. Financial accounting: an introduction to
concepts, methods and uses. Cengage Learning.
Weygandt, J.J., Kimmel, P.D. and Kieso, D.E., 2015. Financial & managerial accounting. John
Wiley & Sons.
chevron_up_icon
1 out of 24
circle_padding
hide_on_mobile
zoom_out_icon
logo.png

Your All-in-One AI-Powered Toolkit for Academic Success.

Available 24*7 on WhatsApp / Email

[object Object]